Cities with the Lowest Unemployment Rate Amomg Youth Under the Age of 25 in Louisiana
RELATED REPORTS & OPTIONS
Lowest Unemployment | Youth < 25
Louisiana
Compare Cities
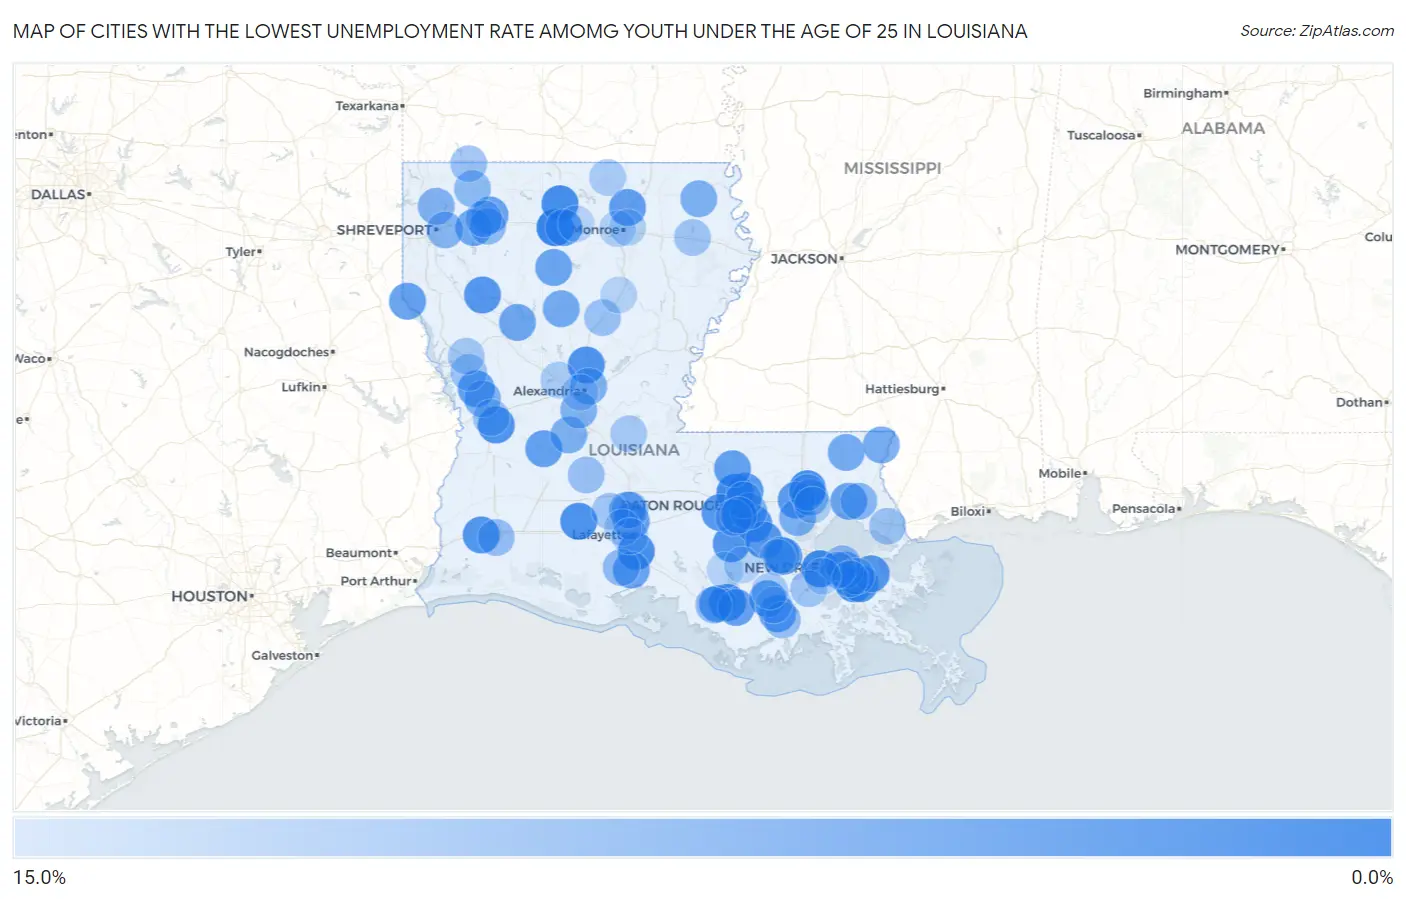
Map of Cities with the Lowest Unemployment Rate Amomg Youth Under the Age of 25 in Louisiana
15.0%
0.0%
Cities with the Lowest Unemployment Rate Amomg Youth Under the Age of 25 in Louisiana
| City | Youth Unemployment | vs State | vs National | |
| 1. | Grambling | 0.40% | 13.8%(-13.4)#1 | 10.9%(-10.5)#29 |
| 2. | Brownfields | 1.2% | 13.8%(-12.6)#2 | 10.9%(-9.70)#175 |
| 3. | Destrehan | 1.3% | 13.8%(-12.5)#3 | 10.9%(-9.60)#191 |
| 4. | Tickfaw | 1.8% | 13.8%(-12.0)#4 | 10.9%(-9.10)#397 |
| 5. | Dubach | 1.9% | 13.8%(-11.9)#5 | 10.9%(-9.00)#427 |
| 6. | Village St George | 2.3% | 13.8%(-11.5)#6 | 10.9%(-8.60)#596 |
| 7. | Youngsville | 2.4% | 13.8%(-11.4)#7 | 10.9%(-8.50)#640 |
| 8. | Morgan City | 2.4% | 13.8%(-11.4)#8 | 10.9%(-8.50)#645 |
| 9. | Iota | 2.5% | 13.8%(-11.3)#9 | 10.9%(-8.40)#745 |
| 10. | Pollock | 2.7% | 13.8%(-11.1)#10 | 10.9%(-8.20)#889 |
| 11. | Fort Polk South | 2.8% | 13.8%(-11.0)#11 | 10.9%(-8.10)#914 |
| 12. | Woodmere | 2.9% | 13.8%(-10.9)#12 | 10.9%(-8.00)#960 |
| 13. | White Castle | 3.0% | 13.8%(-10.8)#13 | 10.9%(-7.90)#1,045 |
| 14. | Prairieville | 3.1% | 13.8%(-10.7)#14 | 10.9%(-7.80)#1,072 |
| 15. | Sulphur | 3.2% | 13.8%(-10.6)#15 | 10.9%(-7.70)#1,157 |
| 16. | Belle Chasse | 3.3% | 13.8%(-10.5)#16 | 10.9%(-7.60)#1,239 |
| 17. | Meraux | 3.5% | 13.8%(-10.3)#17 | 10.9%(-7.40)#1,362 |
| 18. | Coushatta | 3.5% | 13.8%(-10.3)#18 | 10.9%(-7.40)#1,386 |
| 19. | Brusly | 3.6% | 13.8%(-10.2)#19 | 10.9%(-7.30)#1,451 |
| 20. | Sorrento | 3.6% | 13.8%(-10.2)#20 | 10.9%(-7.30)#1,457 |
| 21. | Gramercy | 3.7% | 13.8%(-10.1)#21 | 10.9%(-7.20)#1,506 |
| 22. | Central | 3.8% | 13.8%(-10.00)#22 | 10.9%(-7.10)#1,546 |
| 23. | Albany | 3.8% | 13.8%(-10.00)#23 | 10.9%(-7.10)#1,598 |
| 24. | Hornbeck | 4.4% | 13.8%(-9.40)#24 | 10.9%(-6.50)#2,019 |
| 25. | Ruston | 4.5% | 13.8%(-9.30)#25 | 10.9%(-6.40)#2,031 |
| 26. | Sterlington | 4.5% | 13.8%(-9.30)#26 | 10.9%(-6.40)#2,072 |
| 27. | Bayou Cane | 4.6% | 13.8%(-9.20)#27 | 10.9%(-6.30)#2,116 |
| 28. | Bayou Vista | 4.6% | 13.8%(-9.20)#28 | 10.9%(-6.30)#2,142 |
| 29. | Elizabeth | 4.6% | 13.8%(-9.20)#29 | 10.9%(-6.30)#2,169 |
| 30. | Slaughter | 4.7% | 13.8%(-9.10)#30 | 10.9%(-6.20)#2,235 |
| 31. | Carencro | 4.9% | 13.8%(-8.90)#31 | 10.9%(-6.00)#2,353 |
| 32. | Logansport | 5.0% | 13.8%(-8.80)#32 | 10.9%(-5.90)#2,446 |
| 33. | Amelia | 5.1% | 13.8%(-8.70)#33 | 10.9%(-5.80)#2,509 |
| 34. | Minden | 5.3% | 13.8%(-8.50)#34 | 10.9%(-5.60)#2,636 |
| 35. | Covington | 5.3% | 13.8%(-8.50)#35 | 10.9%(-5.60)#2,637 |
| 36. | Jefferson | 5.3% | 13.8%(-8.50)#36 | 10.9%(-5.60)#2,641 |
| 37. | Erath | 5.4% | 13.8%(-8.40)#37 | 10.9%(-5.50)#2,741 |
| 38. | Schriever | 5.6% | 13.8%(-8.20)#38 | 10.9%(-5.30)#2,880 |
| 39. | Jonesboro | 5.6% | 13.8%(-8.20)#39 | 10.9%(-5.30)#2,885 |
| 40. | Doyline | 5.7% | 13.8%(-8.10)#40 | 10.9%(-5.20)#2,994 |
| 41. | Clarence | 6.0% | 13.8%(-7.80)#41 | 10.9%(-4.90)#3,256 |
| 42. | Winnfield | 6.4% | 13.8%(-7.40)#42 | 10.9%(-4.50)#3,539 |
| 43. | Franklinton | 6.6% | 13.8%(-7.20)#43 | 10.9%(-4.30)#3,685 |
| 44. | Varnado | 6.8% | 13.8%(-7.00)#44 | 10.9%(-4.10)#3,886 |
| 45. | Sunset | 7.0% | 13.8%(-6.80)#45 | 10.9%(-3.90)#4,002 |
| 46. | Killian | 7.3% | 13.8%(-6.50)#46 | 10.9%(-3.60)#4,242 |
| 47. | Shenandoah | 7.5% | 13.8%(-6.30)#47 | 10.9%(-3.40)#4,349 |
| 48. | Glenmora | 7.5% | 13.8%(-6.30)#48 | 10.9%(-3.40)#4,382 |
| 49. | Anacoco | 7.5% | 13.8%(-6.30)#49 | 10.9%(-3.40)#4,390 |
| 50. | Pioneer | 7.6% | 13.8%(-6.20)#50 | 10.9%(-3.30)#4,484 |
| 51. | Pineville | 7.8% | 13.8%(-6.00)#51 | 10.9%(-3.10)#4,606 |
| 52. | Woodworth | 8.0% | 13.8%(-5.80)#52 | 10.9%(-2.90)#4,780 |
| 53. | Benton | 8.0% | 13.8%(-5.80)#53 | 10.9%(-2.90)#4,781 |
| 54. | Hammond | 8.3% | 13.8%(-5.50)#54 | 10.9%(-2.60)#4,955 |
| 55. | Lutcher | 8.5% | 13.8%(-5.30)#55 | 10.9%(-2.40)#5,164 |
| 56. | Bossier City | 8.6% | 13.8%(-5.20)#56 | 10.9%(-2.30)#5,210 |
| 57. | Abita Springs | 8.6% | 13.8%(-5.20)#57 | 10.9%(-2.30)#5,252 |
| 58. | Cotton Valley | 9.0% | 13.8%(-4.80)#58 | 10.9%(-1.90)#5,600 |
| 59. | Sibley | 9.2% | 13.8%(-4.60)#59 | 10.9%(-1.70)#5,776 |
| 60. | Abbeville | 9.3% | 13.8%(-4.50)#60 | 10.9%(-1.60)#5,818 |
| 61. | Monticello | 9.3% | 13.8%(-4.50)#61 | 10.9%(-1.60)#5,834 |
| 62. | Patterson | 9.4% | 13.8%(-4.40)#62 | 10.9%(-1.50)#5,918 |
| 63. | Metairie | 9.5% | 13.8%(-4.30)#63 | 10.9%(-1.40)#5,947 |
| 64. | Gardere | 9.7% | 13.8%(-4.10)#64 | 10.9%(-1.20)#6,133 |
| 65. | Lake Charles | 9.8% | 13.8%(-4.00)#65 | 10.9%(-1.10)#6,191 |
| 66. | Dixie Inn | 9.9% | 13.8%(-3.90)#66 | 10.9%(-1.000)#6,327 |
| 67. | Houma | 10.0% | 13.8%(-3.80)#67 | 10.9%(-0.900)#6,351 |
| 68. | Springhill | 10.3% | 13.8%(-3.50)#68 | 10.9%(-0.600)#6,610 |
| 69. | Reddell | 10.3% | 13.8%(-3.50)#69 | 10.9%(-0.600)#6,650 |
| 70. | Slidell | 10.4% | 13.8%(-3.40)#70 | 10.9%(-0.500)#6,672 |
| 71. | Urania | 10.4% | 13.8%(-3.40)#71 | 10.9%(-0.500)#6,731 |
| 72. | Gretna | 10.6% | 13.8%(-3.20)#72 | 10.9%(-0.300)#6,838 |
| 73. | Leesville | 10.6% | 13.8%(-3.20)#73 | 10.9%(-0.300)#6,865 |
| 74. | River Ridge | 10.7% | 13.8%(-3.10)#74 | 10.9%(-0.200)#6,924 |
| 75. | Des Allemands | 10.7% | 13.8%(-3.10)#75 | 10.9%(-0.200)#6,941 |
| 76. | Florien | 10.7% | 13.8%(-3.10)#76 | 10.9%(-0.200)#6,951 |
| 77. | Grand Coteau | 10.8% | 13.8%(-3.00)#77 | 10.9%(-0.100)#7,018 |
| 78. | Oak Hills Place | 10.9% | 13.8%(-2.90)#78 | 10.9%(=0.000)#7,055 |
| 79. | Delhi | 10.9% | 13.8%(-2.90)#79 | 10.9%(=0.000)#7,069 |
| 80. | Natalbany | 11.0% | 13.8%(-2.80)#80 | 10.9%(+0.100)#7,117 |
| 81. | Church Point | 11.1% | 13.8%(-2.70)#81 | 10.9%(+0.200)#7,159 |
| 82. | Gray | 11.2% | 13.8%(-2.60)#82 | 10.9%(+0.300)#7,285 |
| 83. | Many | 11.3% | 13.8%(-2.50)#83 | 10.9%(+0.400)#7,349 |
| 84. | Thibodaux | 11.6% | 13.8%(-2.20)#84 | 10.9%(+0.700)#7,523 |
| 85. | Cottonport | 11.8% | 13.8%(-2.00)#85 | 10.9%(+0.900)#7,674 |
| 86. | Marion | 12.1% | 13.8%(-1.70)#86 | 10.9%(+1.20)#7,857 |
| 87. | Marrero | 12.2% | 13.8%(-1.60)#87 | 10.9%(+1.30)#7,877 |
| 88. | Boyce | 12.2% | 13.8%(-1.60)#88 | 10.9%(+1.30)#7,916 |
| 89. | Ponchatoula | 12.4% | 13.8%(-1.40)#89 | 10.9%(+1.50)#7,996 |
| 90. | West Monroe | 12.6% | 13.8%(-1.20)#90 | 10.9%(+1.70)#8,138 |
| 91. | Ossun | 12.6% | 13.8%(-1.20)#91 | 10.9%(+1.70)#8,152 |
| 92. | Alexandria | 12.7% | 13.8%(-1.10)#92 | 10.9%(+1.80)#8,182 |
| 93. | Lafayette | 12.9% | 13.8%(-0.900)#93 | 10.9%(+2.00)#8,288 |
| 94. | Monroe | 13.0% | 13.8%(-0.800)#94 | 10.9%(+2.10)#8,343 |
| 95. | Pierre Part | 13.0% | 13.8%(-0.800)#95 | 10.9%(+2.10)#8,381 |
| 96. | Clarks | 13.0% | 13.8%(-0.800)#96 | 10.9%(+2.10)#8,396 |
| 97. | Luling | 13.2% | 13.8%(-0.600)#97 | 10.9%(+2.30)#8,481 |
| 98. | Grand Point | 13.3% | 13.8%(-0.500)#98 | 10.9%(+2.40)#8,541 |
| 99. | Choudrant | 13.3% | 13.8%(-0.500)#99 | 10.9%(+2.40)#8,548 |
| 100. | Paincourtville | 13.3% | 13.8%(-0.500)#100 | 10.9%(+2.40)#8,549 |
Common Questions
What are the Top 10 Cities with the Lowest Unemployment Rate Amomg Youth Under the Age of 25 in Louisiana?
Top 10 Cities with the Lowest Unemployment Rate Amomg Youth Under the Age of 25 in Louisiana are:
#1
0.40%
#2
1.2%
#3
1.3%
#4
1.8%
#5
1.9%
#6
2.3%
#7
2.4%
#8
2.4%
#9
2.5%
#10
2.7%
What city has the Lowest Unemployment Rate Amomg Youth Under the Age of 25 in Louisiana?
Grambling has the Lowest Unemployment Rate Amomg Youth Under the Age of 25 in Louisiana with 0.40%.
What is the Unemployment Rate Amomg Youth Under the Age of 25 in the State of Louisiana?
Unemployment Rate Amomg Youth Under the Age of 25 in Louisiana is 13.8%.
What is the Unemployment Rate Amomg Youth Under the Age of 25 in the United States?
Unemployment Rate Amomg Youth Under the Age of 25 in the United States is 10.9%.