Cities with the Lowest Unemployment Rate Amomg Youth Under the Age of 25 in Connecticut
RELATED REPORTS & OPTIONS
Lowest Unemployment | Youth < 25
Connecticut
Compare Cities
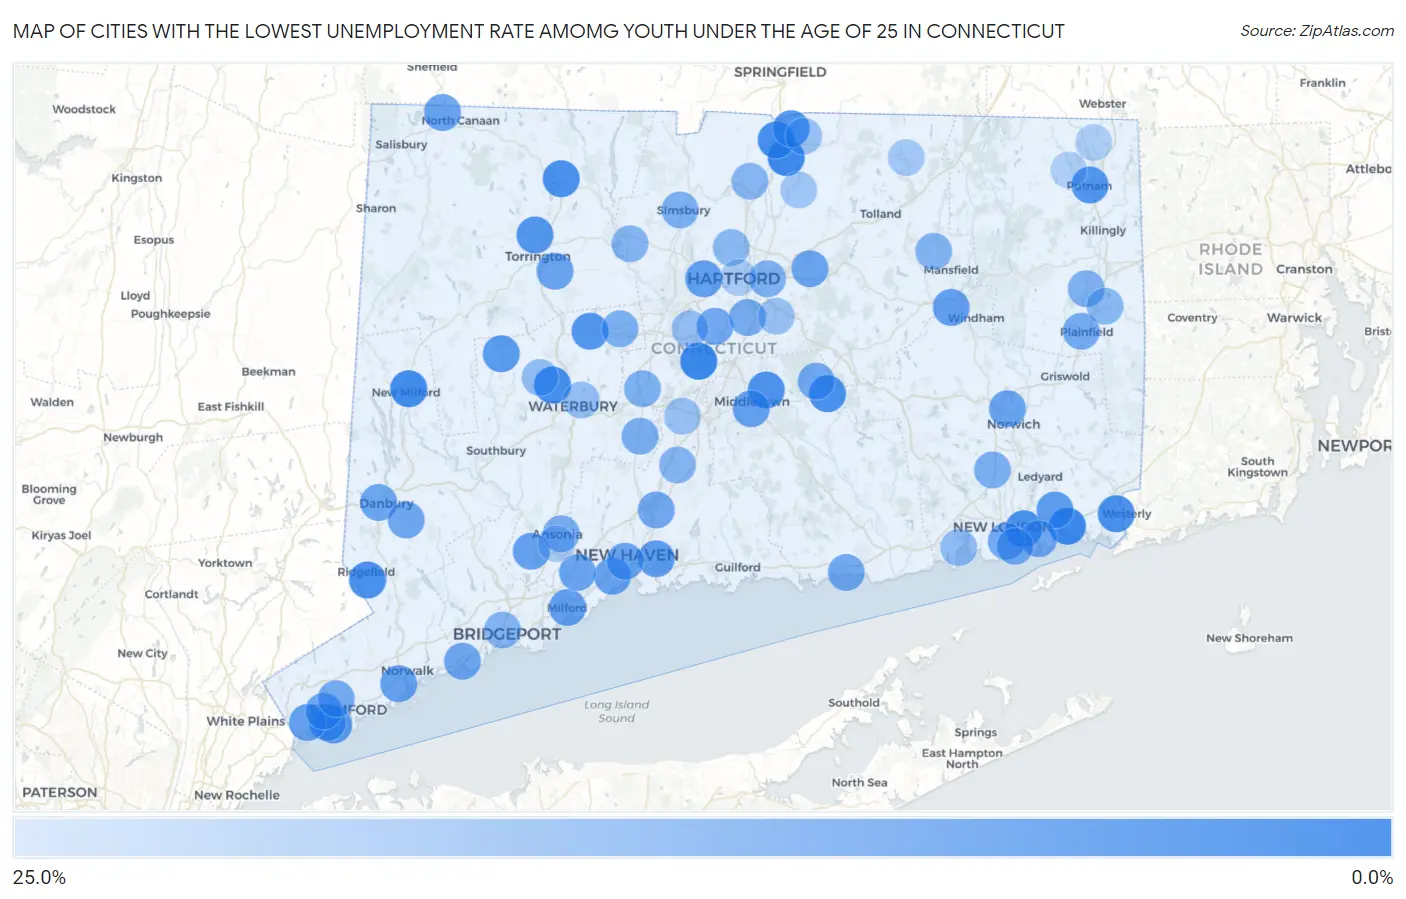
Map of Cities with the Lowest Unemployment Rate Amomg Youth Under the Age of 25 in Connecticut
25.0%
0.0%
Cities with the Lowest Unemployment Rate Amomg Youth Under the Age of 25 in Connecticut
| City | Youth Unemployment | vs State | vs National | |
| 1. | Sacred Heart University | 1.4% | 11.8%(-10.4)#1 | 10.9%(-9.50)#232 |
| 2. | Kensington | 1.9% | 11.8%(-9.90)#2 | 10.9%(-9.00)#404 |
| 3. | Mystic | 2.0% | 11.8%(-9.80)#3 | 10.9%(-8.90)#458 |
| 4. | Southwood Acres | 2.6% | 11.8%(-9.20)#4 | 10.9%(-8.30)#774 |
| 5. | Quinnipiac University | 2.8% | 11.8%(-9.00)#5 | 10.9%(-8.10)#923 |
| 6. | New Milford | 3.0% | 11.8%(-8.80)#6 | 10.9%(-7.90)#1,029 |
| 7. | Thompsonville | 3.4% | 11.8%(-8.40)#7 | 10.9%(-7.50)#1,303 |
| 8. | Oakville | 3.6% | 11.8%(-8.20)#8 | 10.9%(-7.30)#1,434 |
| 9. | Pawcatuck | 4.0% | 11.8%(-7.80)#9 | 10.9%(-6.90)#1,702 |
| 10. | Ridgefield | 4.4% | 11.8%(-7.40)#10 | 10.9%(-6.50)#1,974 |
| 11. | Winsted | 4.5% | 11.8%(-7.30)#11 | 10.9%(-6.40)#2,052 |
| 12. | Long Hill | 4.5% | 11.8%(-7.30)#12 | 10.9%(-6.40)#2,062 |
| 13. | East Hampton | 4.5% | 11.8%(-7.30)#13 | 10.9%(-6.40)#2,065 |
| 14. | Portland | 4.7% | 11.8%(-7.10)#14 | 10.9%(-6.20)#2,208 |
| 15. | Northford | 5.1% | 11.8%(-6.70)#15 | 10.9%(-5.80)#2,494 |
| 16. | Bantam Borough | 5.2% | 11.8%(-6.60)#16 | 10.9%(-5.70)#2,604 |
| 17. | Sherwood Manor | 5.4% | 11.8%(-6.40)#17 | 10.9%(-5.50)#2,727 |
| 18. | Torrington | 5.7% | 11.8%(-6.10)#18 | 10.9%(-5.20)#2,927 |
| 19. | Putnam | 5.8% | 11.8%(-6.00)#19 | 10.9%(-5.10)#3,027 |
| 20. | Terryville | 5.8% | 11.8%(-6.00)#20 | 10.9%(-5.10)#3,036 |
| 21. | Fairfield University | 6.5% | 11.8%(-5.30)#21 | 10.9%(-4.40)#3,622 |
| 22. | Tashua | 6.9% | 11.8%(-4.90)#22 | 10.9%(-4.00)#3,932 |
| 23. | Noroton Heights | 6.9% | 11.8%(-4.90)#23 | 10.9%(-4.00)#3,934 |
| 24. | Bethlehem Village | 6.9% | 11.8%(-4.90)#24 | 10.9%(-4.00)#3,938 |
| 25. | Noroton | 7.2% | 11.8%(-4.60)#25 | 10.9%(-3.70)#4,146 |
| 26. | Old Greenwich | 7.3% | 11.8%(-4.50)#26 | 10.9%(-3.60)#4,219 |
| 27. | Riverside | 7.4% | 11.8%(-4.40)#27 | 10.9%(-3.50)#4,289 |
| 28. | East Haven | 7.7% | 11.8%(-4.10)#28 | 10.9%(-3.20)#4,531 |
| 29. | Old Mystic | 7.7% | 11.8%(-4.10)#29 | 10.9%(-3.20)#4,563 |
| 30. | Jewett City Borough | 7.9% | 11.8%(-3.90)#30 | 10.9%(-3.00)#4,705 |
| 31. | Willimantic | 8.1% | 11.8%(-3.70)#31 | 10.9%(-2.80)#4,822 |
| 32. | Oronoque | 8.1% | 11.8%(-3.70)#32 | 10.9%(-2.80)#4,850 |
| 33. | West Hartford | 8.3% | 11.8%(-3.50)#33 | 10.9%(-2.60)#4,938 |
| 34. | Milford City Balance | 8.3% | 11.8%(-3.50)#34 | 10.9%(-2.60)#4,940 |
| 35. | Daniels Farm | 8.4% | 11.8%(-3.40)#35 | 10.9%(-2.50)#5,075 |
| 36. | Middletown | 8.6% | 11.8%(-3.20)#36 | 10.9%(-2.30)#5,212 |
| 37. | Norwalk | 8.9% | 11.8%(-2.90)#37 | 10.9%(-2.00)#5,469 |
| 38. | Greenwich | 8.9% | 11.8%(-2.90)#38 | 10.9%(-2.00)#5,493 |
| 39. | West Haven | 9.0% | 11.8%(-2.80)#39 | 10.9%(-1.90)#5,541 |
| 40. | Shelton | 9.1% | 11.8%(-2.70)#40 | 10.9%(-1.80)#5,663 |
| 41. | Northwest Harwinton | 9.2% | 11.8%(-2.60)#41 | 10.9%(-1.70)#5,764 |
| 42. | Canaan | 9.3% | 11.8%(-2.50)#42 | 10.9%(-1.60)#5,854 |
| 43. | Norwich | 9.5% | 11.8%(-2.30)#43 | 10.9%(-1.40)#5,959 |
| 44. | New Haven | 9.6% | 11.8%(-2.20)#44 | 10.9%(-1.30)#6,031 |
| 45. | Manchester | 9.8% | 11.8%(-2.00)#45 | 10.9%(-1.10)#6,195 |
| 46. | Orange | 9.8% | 11.8%(-2.00)#46 | 10.9%(-1.10)#6,207 |
| 47. | Cos Cob | 9.9% | 11.8%(-1.90)#47 | 10.9%(-1.000)#6,285 |
| 48. | Danbury | 10.1% | 11.8%(-1.70)#48 | 10.9%(-0.800)#6,433 |
| 49. | Coleytown | 10.1% | 11.8%(-1.70)#49 | 10.9%(-0.800)#6,474 |
| 50. | Bethel | 10.4% | 11.8%(-1.40)#50 | 10.9%(-0.500)#6,693 |
| 51. | Southport | 10.4% | 11.8%(-1.40)#51 | 10.9%(-0.500)#6,727 |
| 52. | North Haven | 10.5% | 11.8%(-1.30)#52 | 10.9%(-0.400)#6,751 |
| 53. | Poquonock Bridge | 10.5% | 11.8%(-1.30)#53 | 10.9%(-0.400)#6,790 |
| 54. | Lake Pocotopaug | 10.7% | 11.8%(-1.10)#54 | 10.9%(-0.200)#6,932 |
| 55. | Newington | 10.8% | 11.8%(-1.000)#55 | 10.9%(-0.100)#6,976 |
| 56. | New London | 10.8% | 11.8%(-1.000)#56 | 10.9%(-0.100)#6,978 |
| 57. | Westbrook Center | 11.1% | 11.8%(-0.700)#57 | 10.9%(+0.200)#7,178 |
| 58. | Stamford | 11.3% | 11.8%(-0.500)#58 | 10.9%(+0.400)#7,313 |
| 59. | Plainfield Village | 11.3% | 11.8%(-0.500)#59 | 10.9%(+0.400)#7,347 |
| 60. | Groton | 11.5% | 11.8%(-0.300)#60 | 10.9%(+0.600)#7,455 |
| 61. | Wethersfield | 11.6% | 11.8%(-0.200)#61 | 10.9%(+0.700)#7,514 |
| 62. | Ansonia | 12.0% | 11.8%(+0.200)#62 | 10.9%(+1.10)#7,759 |
| 63. | Cheshire Village | 12.0% | 11.8%(+0.200)#63 | 10.9%(+1.10)#7,775 |
| 64. | Oxoboxo River | 12.5% | 11.8%(+0.700)#64 | 10.9%(+1.60)#8,071 |
| 65. | Bristol | 12.7% | 11.8%(+0.900)#65 | 10.9%(+1.80)#8,177 |
| 66. | Simsbury Center | 12.7% | 11.8%(+0.900)#66 | 10.9%(+1.80)#8,205 |
| 67. | Plantsville | 12.7% | 11.8%(+0.900)#67 | 10.9%(+1.80)#8,221 |
| 68. | Wauregan | 13.1% | 11.8%(+1.30)#68 | 10.9%(+2.20)#8,448 |
| 69. | East Hartford | 13.2% | 11.8%(+1.40)#69 | 10.9%(+2.30)#8,471 |
| 70. | Storrs | 13.7% | 11.8%(+1.90)#70 | 10.9%(+2.80)#8,770 |
| 71. | Woodmont Borough | 13.7% | 11.8%(+1.90)#71 | 10.9%(+2.80)#8,799 |
| 72. | Greens Farms | 14.0% | 11.8%(+2.20)#72 | 10.9%(+3.10)#8,975 |
| 73. | Bridgeport | 14.1% | 11.8%(+2.30)#73 | 10.9%(+3.20)#9,002 |
| 74. | Wallingford Center | 14.2% | 11.8%(+2.40)#74 | 10.9%(+3.30)#9,046 |
| 75. | Collinsville | 14.2% | 11.8%(+2.40)#75 | 10.9%(+3.30)#9,070 |
| 76. | Windsor Locks | 14.3% | 11.8%(+2.50)#76 | 10.9%(+3.40)#9,180 |
| 77. | Moosup | 14.9% | 11.8%(+3.10)#77 | 10.9%(+4.00)#9,463 |
| 78. | Blue Hills | 14.9% | 11.8%(+3.10)#78 | 10.9%(+4.00)#9,469 |
| 79. | Compo | 15.0% | 11.8%(+3.20)#79 | 10.9%(+4.10)#9,513 |
| 80. | South Wilton | 15.1% | 11.8%(+3.30)#80 | 10.9%(+4.20)#9,575 |
| 81. | Niantic | 15.7% | 11.8%(+3.90)#81 | 10.9%(+4.80)#9,834 |
| 82. | Watertown | 16.0% | 11.8%(+4.20)#82 | 10.9%(+5.10)#9,964 |
| 83. | Candlewood Orchards | 16.0% | 11.8%(+4.20)#83 | 10.9%(+5.10)#9,989 |
| 84. | New Britain | 16.6% | 11.8%(+4.80)#84 | 10.9%(+5.70)#10,174 |
| 85. | Naugatuck Borough | 16.6% | 11.8%(+4.80)#85 | 10.9%(+5.70)#10,181 |
| 86. | Waterbury | 16.9% | 11.8%(+5.10)#86 | 10.9%(+6.00)#10,338 |
| 87. | Sandy Hook | 17.3% | 11.8%(+5.50)#87 | 10.9%(+6.40)#10,494 |
| 88. | Hazardville | 17.4% | 11.8%(+5.60)#88 | 10.9%(+6.50)#10,545 |
| 89. | Meriden | 17.6% | 11.8%(+5.80)#89 | 10.9%(+6.70)#10,604 |
| 90. | Glastonbury Center | 17.6% | 11.8%(+5.80)#90 | 10.9%(+6.70)#10,623 |
| 91. | Broad Brook | 18.6% | 11.8%(+6.80)#91 | 10.9%(+7.70)#11,011 |
| 92. | Tokeneke | 18.8% | 11.8%(+7.00)#92 | 10.9%(+7.90)#11,092 |
| 93. | Stafford Springs | 19.1% | 11.8%(+7.30)#93 | 10.9%(+8.20)#11,181 |
| 94. | Hartford | 19.9% | 11.8%(+8.10)#94 | 10.9%(+9.00)#11,388 |
| 95. | Lordship | 19.9% | 11.8%(+8.10)#95 | 10.9%(+9.00)#11,407 |
| 96. | Derby | 20.0% | 11.8%(+8.20)#96 | 10.9%(+9.10)#11,449 |
| 97. | North Grosvenor Dale | 20.5% | 11.8%(+8.70)#97 | 10.9%(+9.60)#11,618 |
| 98. | Candlewood Shores | 20.7% | 11.8%(+8.90)#98 | 10.9%(+9.80)#11,668 |
| 99. | South Woodstock | 21.1% | 11.8%(+9.30)#99 | 10.9%(+10.2)#11,786 |
| 100. | Old Hill | 22.0% | 11.8%(+10.2)#100 | 10.9%(+11.1)#11,994 |
1
2Common Questions
What are the Top 10 Cities with the Lowest Unemployment Rate Amomg Youth Under the Age of 25 in Connecticut?
Top 10 Cities with the Lowest Unemployment Rate Amomg Youth Under the Age of 25 in Connecticut are:
#1
1.9%
#2
2.0%
#3
2.6%
#4
3.0%
#5
3.4%
#6
3.6%
#7
4.0%
#8
4.4%
#9
4.5%
#10
4.5%
What city has the Lowest Unemployment Rate Amomg Youth Under the Age of 25 in Connecticut?
Kensington has the Lowest Unemployment Rate Amomg Youth Under the Age of 25 in Connecticut with 1.9%.
What is the Unemployment Rate Amomg Youth Under the Age of 25 in the State of Connecticut?
Unemployment Rate Amomg Youth Under the Age of 25 in Connecticut is 11.8%.
What is the Unemployment Rate Amomg Youth Under the Age of 25 in the United States?
Unemployment Rate Amomg Youth Under the Age of 25 in the United States is 10.9%.