Cities with the Lowest Unemployment Rate Amomg Youth Under the Age of 25 in Alaska
RELATED REPORTS & OPTIONS
Lowest Unemployment | Youth < 25
Alaska
Compare Cities
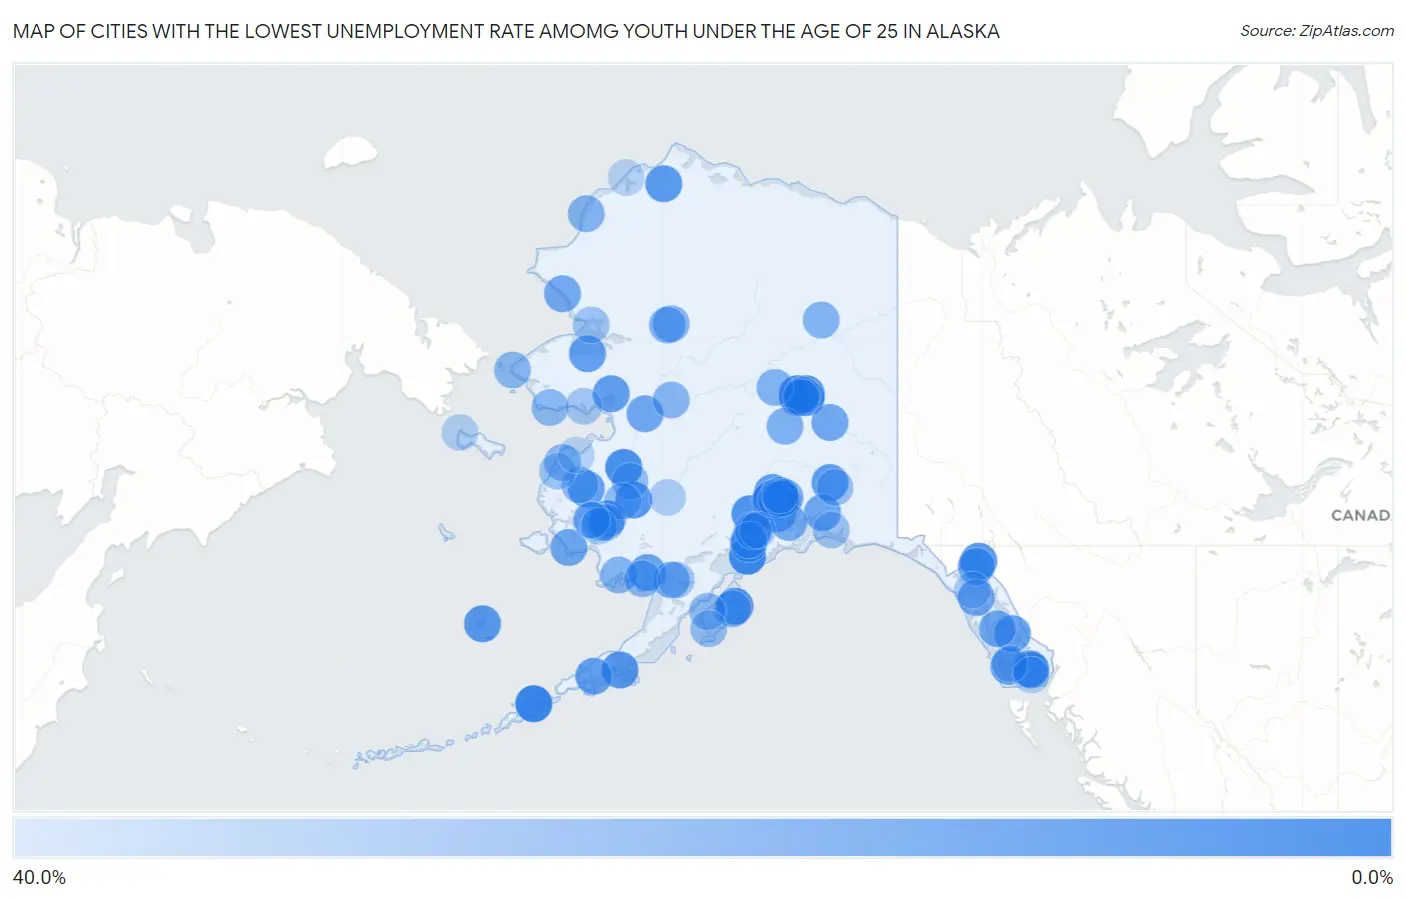
Map of Cities with the Lowest Unemployment Rate Amomg Youth Under the Age of 25 in Alaska
40.0%
0.0%
Cities with the Lowest Unemployment Rate Amomg Youth Under the Age of 25 in Alaska
| City | Youth Unemployment | vs State | vs National | |
| 1. | Unalaska | 0.20% | 12.6%(-12.4)#1 | 10.9%(-10.7)#12 |
| 2. | Goldstream | 1.1% | 12.6%(-11.5)#2 | 10.9%(-9.80)#159 |
| 3. | Homer | 2.1% | 12.6%(-10.5)#3 | 10.9%(-8.80)#504 |
| 4. | Sitka City And Borough | 4.4% | 12.6%(-8.20)#4 | 10.9%(-6.50)#1,973 |
| 5. | Anvik | 4.5% | 12.6%(-8.10)#5 | 10.9%(-6.40)#2,101 |
| 6. | Gateway | 5.2% | 12.6%(-7.40)#6 | 10.9%(-5.70)#2,561 |
| 7. | Tyonek | 5.6% | 12.6%(-7.00)#7 | 10.9%(-5.30)#2,921 |
| 8. | Fairbanks | 5.7% | 12.6%(-6.90)#8 | 10.9%(-5.20)#2,929 |
| 9. | Ketchikan | 5.7% | 12.6%(-6.90)#9 | 10.9%(-5.20)#2,948 |
| 10. | Steele Creek | 5.8% | 12.6%(-6.80)#10 | 10.9%(-5.10)#3,030 |
| 11. | Badger | 5.9% | 12.6%(-6.70)#11 | 10.9%(-5.00)#3,102 |
| 12. | College | 6.2% | 12.6%(-6.40)#12 | 10.9%(-4.70)#3,353 |
| 13. | Kodiak | 6.8% | 12.6%(-5.80)#13 | 10.9%(-4.10)#3,836 |
| 14. | Sand Point | 7.2% | 12.6%(-5.40)#14 | 10.9%(-3.70)#4,171 |
| 15. | Aniak | 7.3% | 12.6%(-5.30)#15 | 10.9%(-3.60)#4,248 |
| 16. | Skagway | 7.5% | 12.6%(-5.10)#16 | 10.9%(-3.40)#4,385 |
| 17. | St Paul | 7.6% | 12.6%(-5.00)#17 | 10.9%(-3.30)#4,494 |
| 18. | Akiachak | 8.6% | 12.6%(-4.00)#18 | 10.9%(-2.30)#5,284 |
| 19. | Atqasuk | 8.6% | 12.6%(-4.00)#19 | 10.9%(-2.30)#5,295 |
| 20. | Glennallen | 8.8% | 12.6%(-3.80)#20 | 10.9%(-2.10)#5,461 |
| 21. | Willow | 9.2% | 12.6%(-3.40)#21 | 10.9%(-1.70)#5,770 |
| 22. | Meadow Lakes | 9.4% | 12.6%(-3.20)#22 | 10.9%(-1.50)#5,912 |
| 23. | North Lakes | 9.5% | 12.6%(-3.10)#23 | 10.9%(-1.40)#5,984 |
| 24. | Koyuk | 9.9% | 12.6%(-2.70)#24 | 10.9%(-1.000)#6,326 |
| 25. | Wrangell City And Borough | 10.0% | 12.6%(-2.60)#25 | 10.9%(-0.900)#6,389 |
| 26. | Craig | 10.1% | 12.6%(-2.50)#26 | 10.9%(-0.800)#6,488 |
| 27. | Butte | 10.2% | 12.6%(-2.40)#27 | 10.9%(-0.700)#6,540 |
| 28. | Pilot Station | 10.3% | 12.6%(-2.30)#28 | 10.9%(-0.600)#6,651 |
| 29. | Big Lake | 10.4% | 12.6%(-2.20)#29 | 10.9%(-0.500)#6,714 |
| 30. | Ninilchik | 10.6% | 12.6%(-2.00)#30 | 10.9%(-0.300)#6,892 |
| 31. | Anchorage | 11.1% | 12.6%(-1.50)#31 | 10.9%(+0.200)#7,125 |
| 32. | Chena Ridge | 11.1% | 12.6%(-1.50)#32 | 10.9%(+0.200)#7,156 |
| 33. | King Cove | 11.1% | 12.6%(-1.50)#33 | 10.9%(+0.200)#7,193 |
| 34. | Deering | 11.1% | 12.6%(-1.50)#34 | 10.9%(+0.200)#7,242 |
| 35. | Petersburg | 11.4% | 12.6%(-1.20)#35 | 10.9%(+0.500)#7,402 |
| 36. | Kenai | 11.9% | 12.6%(-0.700)#36 | 10.9%(+1.00)#7,710 |
| 37. | Dillingham | 12.0% | 12.6%(-0.600)#37 | 10.9%(+1.10)#7,787 |
| 38. | Knik Fairview | 12.2% | 12.6%(-0.400)#38 | 10.9%(+1.30)#7,887 |
| 39. | Tanaina | 12.4% | 12.6%(-0.200)#39 | 10.9%(+1.50)#7,991 |
| 40. | Haines | 12.5% | 12.6%(-0.100)#40 | 10.9%(+1.60)#8,078 |
| 41. | Kipnuk | 12.9% | 12.6%(+0.300)#41 | 10.9%(+2.00)#8,337 |
| 42. | Valdez | 13.6% | 12.6%(+1.00)#42 | 10.9%(+2.70)#8,720 |
| 43. | Kake | 13.6% | 12.6%(+1.00)#43 | 10.9%(+2.70)#8,749 |
| 44. | Hoonah | 13.8% | 12.6%(+1.20)#44 | 10.9%(+2.90)#8,897 |
| 45. | Kaltag | 13.8% | 12.6%(+1.20)#45 | 10.9%(+2.90)#8,902 |
| 46. | Juneau City And Borough | 13.9% | 12.6%(+1.30)#46 | 10.9%(+3.00)#8,909 |
| 47. | Houston | 14.0% | 12.6%(+1.40)#47 | 10.9%(+3.10)#8,987 |
| 48. | Farm Loop | 14.4% | 12.6%(+1.80)#48 | 10.9%(+3.50)#9,232 |
| 49. | Delta Junction | 14.4% | 12.6%(+1.80)#49 | 10.9%(+3.50)#9,244 |
| 50. | Kivalina | 14.7% | 12.6%(+2.10)#50 | 10.9%(+3.80)#9,368 |
| 51. | Lazy Mountain | 15.6% | 12.6%(+3.00)#51 | 10.9%(+4.70)#9,793 |
| 52. | Farmers Loop | 15.8% | 12.6%(+3.20)#52 | 10.9%(+4.90)#9,889 |
| 53. | Naknek | 16.0% | 12.6%(+3.40)#53 | 10.9%(+5.10)#9,993 |
| 54. | Whittier | 16.1% | 12.6%(+3.50)#54 | 10.9%(+5.20)#10,038 |
| 55. | Bethel | 16.5% | 12.6%(+3.90)#55 | 10.9%(+5.60)#10,160 |
| 56. | Wasilla | 17.1% | 12.6%(+4.50)#56 | 10.9%(+6.20)#10,415 |
| 57. | South Lakes | 17.4% | 12.6%(+4.80)#57 | 10.9%(+6.50)#10,544 |
| 58. | Healy | 18.0% | 12.6%(+5.40)#58 | 10.9%(+7.10)#10,821 |
| 59. | Point Lay | 18.1% | 12.6%(+5.50)#59 | 10.9%(+7.20)#10,885 |
| 60. | Kobuk | 18.1% | 12.6%(+5.50)#60 | 10.9%(+7.20)#10,888 |
| 61. | Minto | 18.1% | 12.6%(+5.50)#61 | 10.9%(+7.20)#10,890 |
| 62. | Shungnak | 18.7% | 12.6%(+6.10)#62 | 10.9%(+7.80)#11,065 |
| 63. | Venetie | 18.7% | 12.6%(+6.10)#63 | 10.9%(+7.80)#11,066 |
| 64. | Togiak | 19.0% | 12.6%(+6.40)#64 | 10.9%(+8.10)#11,151 |
| 65. | Womens Bay | 19.2% | 12.6%(+6.60)#65 | 10.9%(+8.30)#11,222 |
| 66. | Saxman | 19.2% | 12.6%(+6.60)#66 | 10.9%(+8.30)#11,231 |
| 67. | Palmer | 19.9% | 12.6%(+7.30)#67 | 10.9%(+9.00)#11,403 |
| 68. | Galena | 19.9% | 12.6%(+7.30)#68 | 10.9%(+9.00)#11,430 |
| 69. | Wales | 20.0% | 12.6%(+7.40)#69 | 10.9%(+9.10)#11,486 |
| 70. | Nome | 20.2% | 12.6%(+7.60)#70 | 10.9%(+9.30)#11,543 |
| 71. | St Mary S | 20.3% | 12.6%(+7.70)#71 | 10.9%(+9.40)#11,576 |
| 72. | Nunapitchuk | 20.3% | 12.6%(+7.70)#72 | 10.9%(+9.40)#11,578 |
| 73. | Emmonak | 20.6% | 12.6%(+8.00)#73 | 10.9%(+9.70)#11,643 |
| 74. | Manokotak | 20.6% | 12.6%(+8.00)#74 | 10.9%(+9.70)#11,647 |
| 75. | Karluk | 21.4% | 12.6%(+8.80)#75 | 10.9%(+10.5)#11,869 |
| 76. | Soldotna | 21.5% | 12.6%(+8.90)#76 | 10.9%(+10.6)#11,881 |
| 77. | Akhiok | 22.2% | 12.6%(+9.60)#77 | 10.9%(+11.3)#12,080 |
| 78. | South Van Horn | 23.0% | 12.6%(+10.4)#78 | 10.9%(+12.1)#12,263 |
| 79. | Holy Cross | 23.0% | 12.6%(+10.4)#79 | 10.9%(+12.1)#12,271 |
| 80. | Upper Kalskag | 23.0% | 12.6%(+10.4)#80 | 10.9%(+12.1)#12,274 |
| 81. | Utqiagvik | 23.5% | 12.6%(+10.9)#81 | 10.9%(+12.6)#12,369 |
| 82. | Kwethluk | 23.7% | 12.6%(+11.1)#82 | 10.9%(+12.8)#12,427 |
| 83. | Copper Center | 23.8% | 12.6%(+11.2)#83 | 10.9%(+12.9)#12,460 |
| 84. | Fishhook | 23.9% | 12.6%(+11.3)#84 | 10.9%(+13.0)#12,466 |
| 85. | Cordova | 24.7% | 12.6%(+12.1)#85 | 10.9%(+13.8)#12,625 |
| 86. | Kotzebue | 24.8% | 12.6%(+12.2)#86 | 10.9%(+13.9)#12,637 |
| 87. | Kasigluk | 24.9% | 12.6%(+12.3)#87 | 10.9%(+14.0)#12,663 |
| 88. | Nunam Iqua | 25.0% | 12.6%(+12.4)#88 | 10.9%(+14.1)#12,741 |
| 89. | King Salmon | 25.9% | 12.6%(+13.3)#89 | 10.9%(+15.0)#12,874 |
| 90. | Golovin | 26.0% | 12.6%(+13.4)#90 | 10.9%(+15.1)#12,896 |
| 91. | Clam Gulch | 26.3% | 12.6%(+13.7)#91 | 10.9%(+15.4)#12,957 |
| 92. | Sterling | 27.5% | 12.6%(+14.9)#92 | 10.9%(+16.6)#13,147 |
| 93. | Gustavus | 27.7% | 12.6%(+15.1)#93 | 10.9%(+16.8)#13,188 |
| 94. | Napakiak | 28.5% | 12.6%(+15.9)#94 | 10.9%(+17.6)#13,300 |
| 95. | Sleetmute | 28.5% | 12.6%(+15.9)#95 | 10.9%(+17.6)#13,327 |
| 96. | Gambell | 28.9% | 12.6%(+16.3)#96 | 10.9%(+18.0)#13,367 |
| 97. | Klawock | 29.2% | 12.6%(+16.6)#97 | 10.9%(+18.3)#13,407 |
| 98. | Metlakatla | 29.7% | 12.6%(+17.1)#98 | 10.9%(+18.8)#13,467 |
| 99. | Kotlik | 31.1% | 12.6%(+18.5)#99 | 10.9%(+20.2)#13,634 |
| 100. | Wainwright | 31.2% | 12.6%(+18.6)#100 | 10.9%(+20.3)#13,646 |
1
2Common Questions
What are the Top 10 Cities with the Lowest Unemployment Rate Amomg Youth Under the Age of 25 in Alaska?
Top 10 Cities with the Lowest Unemployment Rate Amomg Youth Under the Age of 25 in Alaska are:
#1
0.20%
#2
1.1%
#3
2.1%
#4
4.5%
#5
5.2%
#6
5.6%
#7
5.7%
#8
5.7%
#9
5.8%
#10
5.9%
What city has the Lowest Unemployment Rate Amomg Youth Under the Age of 25 in Alaska?
Unalaska has the Lowest Unemployment Rate Amomg Youth Under the Age of 25 in Alaska with 0.20%.
What is the Unemployment Rate Amomg Youth Under the Age of 25 in the State of Alaska?
Unemployment Rate Amomg Youth Under the Age of 25 in Alaska is 12.6%.
What is the Unemployment Rate Amomg Youth Under the Age of 25 in the United States?
Unemployment Rate Amomg Youth Under the Age of 25 in the United States is 10.9%.