Cities with the Lowest Unemployment Rate Amomg Youth Under the Age of 25 in Minnesota
RELATED REPORTS & OPTIONS
Lowest Unemployment | Youth < 25
Minnesota
Compare Cities
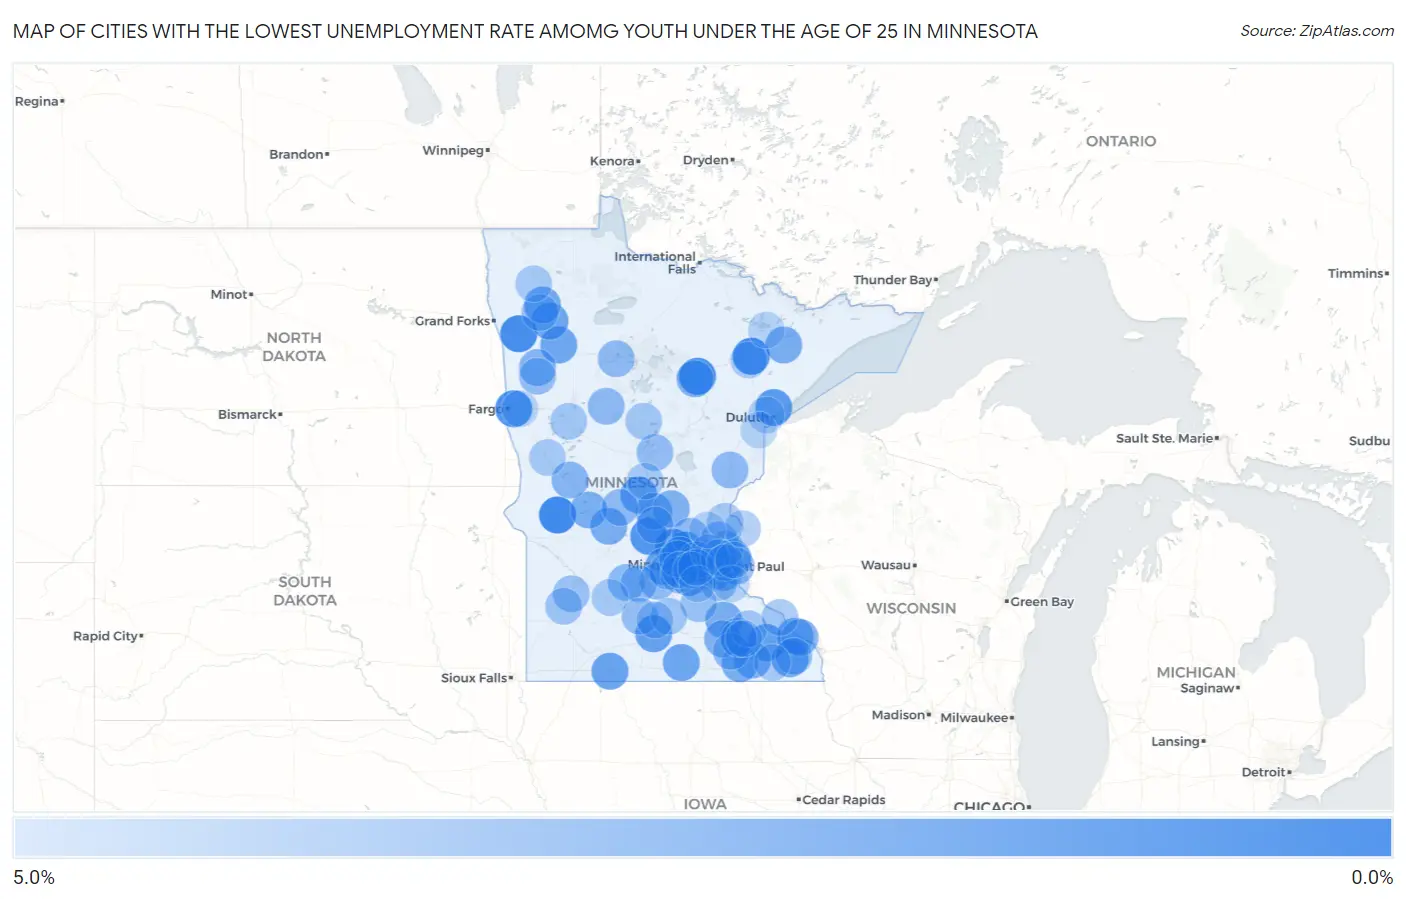
Map of Cities with the Lowest Unemployment Rate Amomg Youth Under the Age of 25 in Minnesota
5.0%
0.0%
Cities with the Lowest Unemployment Rate Amomg Youth Under the Age of 25 in Minnesota
| City | Youth Unemployment | vs State | vs National | |
| 1. | Crown College | 0.30% | 7.7%(-7.40)#1 | 10.9%(-10.6)#21 |
| 2. | Morris | 0.60% | 7.7%(-7.10)#2 | 10.9%(-10.3)#57 |
| 3. | Virginia | 0.70% | 7.7%(-7.00)#3 | 10.9%(-10.2)#67 |
| 4. | Crookston | 0.80% | 7.7%(-6.90)#4 | 10.9%(-10.1)#87 |
| 5. | Coleraine | 0.90% | 7.7%(-6.80)#5 | 10.9%(-10.00)#111 |
| 6. | Buffalo | 1.0% | 7.7%(-6.70)#6 | 10.9%(-9.90)#125 |
| 7. | Dilworth | 1.0% | 7.7%(-6.70)#7 | 10.9%(-9.90)#132 |
| 8. | Kimball | 1.2% | 7.7%(-6.50)#8 | 10.9%(-9.70)#185 |
| 9. | Rice Lake | 1.5% | 7.7%(-6.20)#9 | 10.9%(-9.40)#252 |
| 10. | Hopkins | 1.7% | 7.7%(-6.00)#10 | 10.9%(-9.20)#308 |
| 11. | Eyota | 1.7% | 7.7%(-6.00)#11 | 10.9%(-9.20)#335 |
| 12. | Lake Crystal | 1.8% | 7.7%(-5.90)#12 | 10.9%(-9.10)#381 |
| 13. | Jackson | 1.9% | 7.7%(-5.80)#13 | 10.9%(-9.00)#421 |
| 14. | Winsted | 1.9% | 7.7%(-5.80)#14 | 10.9%(-9.00)#423 |
| 15. | Chaska | 2.0% | 7.7%(-5.70)#15 | 10.9%(-8.90)#431 |
| 16. | Wells | 2.0% | 7.7%(-5.70)#16 | 10.9%(-8.90)#467 |
| 17. | Peterson | 2.0% | 7.7%(-5.70)#17 | 10.9%(-8.90)#480 |
| 18. | Elmdale | 2.0% | 7.7%(-5.70)#18 | 10.9%(-8.90)#481 |
| 19. | Hanover | 2.1% | 7.7%(-5.60)#19 | 10.9%(-8.80)#508 |
| 20. | Mcintosh | 2.1% | 7.7%(-5.60)#20 | 10.9%(-8.80)#525 |
| 21. | Plummer | 2.1% | 7.7%(-5.60)#21 | 10.9%(-8.80)#530 |
| 22. | Stillwater | 2.2% | 7.7%(-5.50)#22 | 10.9%(-8.70)#531 |
| 23. | Thief River Falls | 2.2% | 7.7%(-5.50)#23 | 10.9%(-8.70)#541 |
| 24. | Goodview | 2.4% | 7.7%(-5.30)#24 | 10.9%(-8.50)#660 |
| 25. | Kenyon | 2.4% | 7.7%(-5.30)#25 | 10.9%(-8.50)#678 |
| 26. | Babbitt | 2.4% | 7.7%(-5.30)#26 | 10.9%(-8.50)#687 |
| 27. | Belgrade | 2.4% | 7.7%(-5.30)#27 | 10.9%(-8.50)#693 |
| 28. | Racine | 2.4% | 7.7%(-5.30)#28 | 10.9%(-8.50)#696 |
| 29. | Glenwood | 2.5% | 7.7%(-5.20)#29 | 10.9%(-8.40)#732 |
| 30. | Dexter | 2.5% | 7.7%(-5.20)#30 | 10.9%(-8.40)#752 |
| 31. | Winona | 2.6% | 7.7%(-5.10)#31 | 10.9%(-8.30)#755 |
| 32. | La Prairie | 2.6% | 7.7%(-5.10)#32 | 10.9%(-8.30)#819 |
| 33. | Sartell | 2.7% | 7.7%(-5.00)#33 | 10.9%(-8.20)#825 |
| 34. | Credit River | 2.7% | 7.7%(-5.00)#34 | 10.9%(-8.20)#844 |
| 35. | Foley | 2.7% | 7.7%(-5.00)#35 | 10.9%(-8.20)#854 |
| 36. | Mantorville | 2.7% | 7.7%(-5.00)#36 | 10.9%(-8.20)#878 |
| 37. | Claremont | 2.7% | 7.7%(-5.00)#37 | 10.9%(-8.20)#888 |
| 38. | Mendota Heights | 2.8% | 7.7%(-4.90)#38 | 10.9%(-8.10)#905 |
| 39. | Gary | 2.8% | 7.7%(-4.90)#39 | 10.9%(-8.10)#953 |
| 40. | Newport | 2.9% | 7.7%(-4.80)#40 | 10.9%(-8.00)#977 |
| 41. | St Augusta | 2.9% | 7.7%(-4.80)#41 | 10.9%(-8.00)#981 |
| 42. | Evansville | 2.9% | 7.7%(-4.80)#42 | 10.9%(-8.00)#1,006 |
| 43. | Hector | 3.0% | 7.7%(-4.70)#43 | 10.9%(-7.90)#1,060 |
| 44. | Elk River | 3.1% | 7.7%(-4.60)#44 | 10.9%(-7.80)#1,074 |
| 45. | Park Rapids | 3.1% | 7.7%(-4.60)#45 | 10.9%(-7.80)#1,104 |
| 46. | Sandstone | 3.1% | 7.7%(-4.60)#46 | 10.9%(-7.80)#1,115 |
| 47. | Hayfield | 3.1% | 7.7%(-4.60)#47 | 10.9%(-7.80)#1,127 |
| 48. | Bemidji | 3.2% | 7.7%(-4.50)#48 | 10.9%(-7.70)#1,160 |
| 49. | Glencoe | 3.2% | 7.7%(-4.50)#49 | 10.9%(-7.70)#1,177 |
| 50. | Melrose | 3.2% | 7.7%(-4.50)#50 | 10.9%(-7.70)#1,186 |
| 51. | Lakeland | 3.2% | 7.7%(-4.50)#51 | 10.9%(-7.70)#1,201 |
| 52. | Brainerd | 3.3% | 7.7%(-4.40)#52 | 10.9%(-7.60)#1,233 |
| 53. | Columbus | 3.3% | 7.7%(-4.40)#53 | 10.9%(-7.60)#1,251 |
| 54. | Twin Valley | 3.3% | 7.7%(-4.40)#54 | 10.9%(-7.60)#1,275 |
| 55. | Stewart | 3.3% | 7.7%(-4.40)#55 | 10.9%(-7.60)#1,278 |
| 56. | Rosemount | 3.4% | 7.7%(-4.30)#56 | 10.9%(-7.50)#1,286 |
| 57. | New Ulm | 3.4% | 7.7%(-4.30)#57 | 10.9%(-7.50)#1,292 |
| 58. | Rockford | 3.4% | 7.7%(-4.30)#58 | 10.9%(-7.50)#1,320 |
| 59. | Rushford | 3.4% | 7.7%(-4.30)#59 | 10.9%(-7.50)#1,332 |
| 60. | St Hilaire | 3.4% | 7.7%(-4.30)#60 | 10.9%(-7.50)#1,346 |
| 61. | Lonsdale | 3.5% | 7.7%(-4.20)#61 | 10.9%(-7.40)#1,375 |
| 62. | Cottonwood | 3.5% | 7.7%(-4.20)#62 | 10.9%(-7.40)#1,397 |
| 63. | Hugo | 3.6% | 7.7%(-4.10)#63 | 10.9%(-7.30)#1,426 |
| 64. | Marshall | 3.6% | 7.7%(-4.10)#64 | 10.9%(-7.30)#1,429 |
| 65. | Wayzata | 3.6% | 7.7%(-4.10)#65 | 10.9%(-7.30)#1,445 |
| 66. | New Germany | 3.6% | 7.7%(-4.10)#66 | 10.9%(-7.30)#1,469 |
| 67. | New Brighton | 3.7% | 7.7%(-4.00)#67 | 10.9%(-7.20)#1,474 |
| 68. | St Peter | 3.7% | 7.7%(-4.00)#68 | 10.9%(-7.20)#1,481 |
| 69. | Oronoco | 3.7% | 7.7%(-4.00)#69 | 10.9%(-7.20)#1,517 |
| 70. | Nicollet | 3.7% | 7.7%(-4.00)#70 | 10.9%(-7.20)#1,526 |
| 71. | Kellogg | 3.7% | 7.7%(-4.00)#71 | 10.9%(-7.20)#1,540 |
| 72. | Plymouth | 3.8% | 7.7%(-3.90)#72 | 10.9%(-7.10)#1,544 |
| 73. | Waconia | 3.8% | 7.7%(-3.90)#73 | 10.9%(-7.10)#1,553 |
| 74. | Frazee | 3.8% | 7.7%(-3.90)#74 | 10.9%(-7.10)#1,593 |
| 75. | Pine River | 3.8% | 7.7%(-3.90)#75 | 10.9%(-7.10)#1,602 |
| 76. | Fergus Falls | 3.9% | 7.7%(-3.80)#76 | 10.9%(-7.00)#1,624 |
| 77. | Little Falls | 3.9% | 7.7%(-3.80)#77 | 10.9%(-7.00)#1,633 |
| 78. | Delano | 3.9% | 7.7%(-3.80)#78 | 10.9%(-7.00)#1,636 |
| 79. | St Bonifacius | 3.9% | 7.7%(-3.80)#79 | 10.9%(-7.00)#1,649 |
| 80. | Taylors Falls | 3.9% | 7.7%(-3.80)#80 | 10.9%(-7.00)#1,655 |
| 81. | Newfolden | 3.9% | 7.7%(-3.80)#81 | 10.9%(-7.00)#1,667 |
| 82. | Morton | 3.9% | 7.7%(-3.80)#82 | 10.9%(-7.00)#1,670 |
| 83. | North Branch | 4.0% | 7.7%(-3.70)#83 | 10.9%(-6.90)#1,689 |
| 84. | Spring Lake Park | 4.0% | 7.7%(-3.70)#84 | 10.9%(-6.90)#1,694 |
| 85. | Kasson | 4.0% | 7.7%(-3.70)#85 | 10.9%(-6.90)#1,695 |
| 86. | Eveleth | 4.0% | 7.7%(-3.70)#86 | 10.9%(-6.90)#1,708 |
| 87. | Excelsior | 4.0% | 7.7%(-3.70)#87 | 10.9%(-6.90)#1,719 |
| 88. | Fountain | 4.0% | 7.7%(-3.70)#88 | 10.9%(-6.90)#1,742 |
| 89. | Prior Lake | 4.1% | 7.7%(-3.60)#89 | 10.9%(-6.80)#1,756 |
| 90. | Byron | 4.1% | 7.7%(-3.60)#90 | 10.9%(-6.80)#1,777 |
| 91. | Vadnais Heights | 4.2% | 7.7%(-3.50)#91 | 10.9%(-6.70)#1,831 |
| 92. | Hermantown | 4.2% | 7.7%(-3.50)#92 | 10.9%(-6.70)#1,838 |
| 93. | Minnetonka | 4.3% | 7.7%(-3.40)#93 | 10.9%(-6.60)#1,881 |
| 94. | Oakdale | 4.3% | 7.7%(-3.40)#94 | 10.9%(-6.60)#1,889 |
| 95. | Hastings | 4.3% | 7.7%(-3.40)#95 | 10.9%(-6.60)#1,893 |
| 96. | Soudan | 4.3% | 7.7%(-3.40)#96 | 10.9%(-6.60)#1,945 |
| 97. | Wrenshall | 4.3% | 7.7%(-3.40)#97 | 10.9%(-6.60)#1,946 |
| 98. | Oak Park Heights | 4.4% | 7.7%(-3.30)#98 | 10.9%(-6.50)#1,985 |
| 99. | Glyndon | 4.4% | 7.7%(-3.30)#99 | 10.9%(-6.50)#2,006 |
| 100. | Bethel | 4.4% | 7.7%(-3.30)#100 | 10.9%(-6.50)#2,021 |
Common Questions
What are the Top 10 Cities with the Lowest Unemployment Rate Amomg Youth Under the Age of 25 in Minnesota?
Top 10 Cities with the Lowest Unemployment Rate Amomg Youth Under the Age of 25 in Minnesota are:
What city has the Lowest Unemployment Rate Amomg Youth Under the Age of 25 in Minnesota?
Morris has the Lowest Unemployment Rate Amomg Youth Under the Age of 25 in Minnesota with 0.60%.
What is the Unemployment Rate Amomg Youth Under the Age of 25 in the State of Minnesota?
Unemployment Rate Amomg Youth Under the Age of 25 in Minnesota is 7.7%.
What is the Unemployment Rate Amomg Youth Under the Age of 25 in the United States?
Unemployment Rate Amomg Youth Under the Age of 25 in the United States is 10.9%.