North Yelm, WA Map & Demographics
North Yelm Map
North Yelm Overview
$37,780
PER CAPITA INCOME
$77,813
AVG FAMILY INCOME
$75,489
AVG HOUSEHOLD INCOME
23.7%
WAGE / INCOME GAP [ % ]
76.3¢/ $1
WAGE / INCOME GAP [ $ ]
0.31
INEQUALITY / GINI INDEX
2,785
TOTAL POPULATION
1,575
MALE POPULATION
1,210
FEMALE POPULATION
130.17
MALES / 100 FEMALES
76.83
FEMALES / 100 MALES
36.8
MEDIAN AGE
3.0
AVG FAMILY SIZE
2.4
AVG HOUSEHOLD SIZE
1,697
LABOR FORCE [ PEOPLE ]
69.2%
PERCENT IN LABOR FORCE
2.2%
UNEMPLOYMENT RATE
Income in North Yelm
Income Overview in North Yelm
Per Capita Income in North Yelm is $37,780, while median incomes of families and households are $77,813 and $75,489 respectively.
| Characteristic | Number | Measure |
| Per Capita Income | 2,785 | $37,780 |
| Median Family Income | 634 | $77,813 |
| Mean Family Income | 634 | $97,056 |
| Median Household Income | 1,157 | $75,489 |
| Mean Household Income | 1,157 | $86,228 |
| Income Deficit | 634 | $0 |
| Wage / Income Gap (%) | 2,785 | 23.66% |
| Wage / Income Gap ($) | 2,785 | 76.34¢ per $1 |
| Gini / Inequality Index | 2,785 | 0.31 |
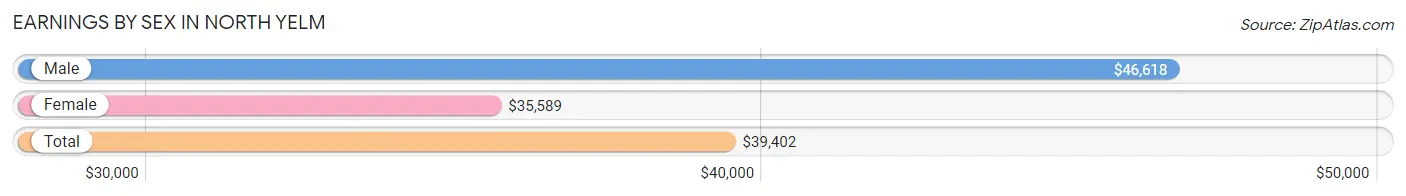
Earnings by Sex in North Yelm
Average Earnings in North Yelm are $39,402, $46,618 for men and $35,589 for women, a difference of 23.7%.
| Sex | Number | Average Earnings |
| Male | 1,110 (65.1%) | $46,618 |
| Female | 595 (34.9%) | $35,589 |
| Total | 1,705 (100.0%) | $39,402 |
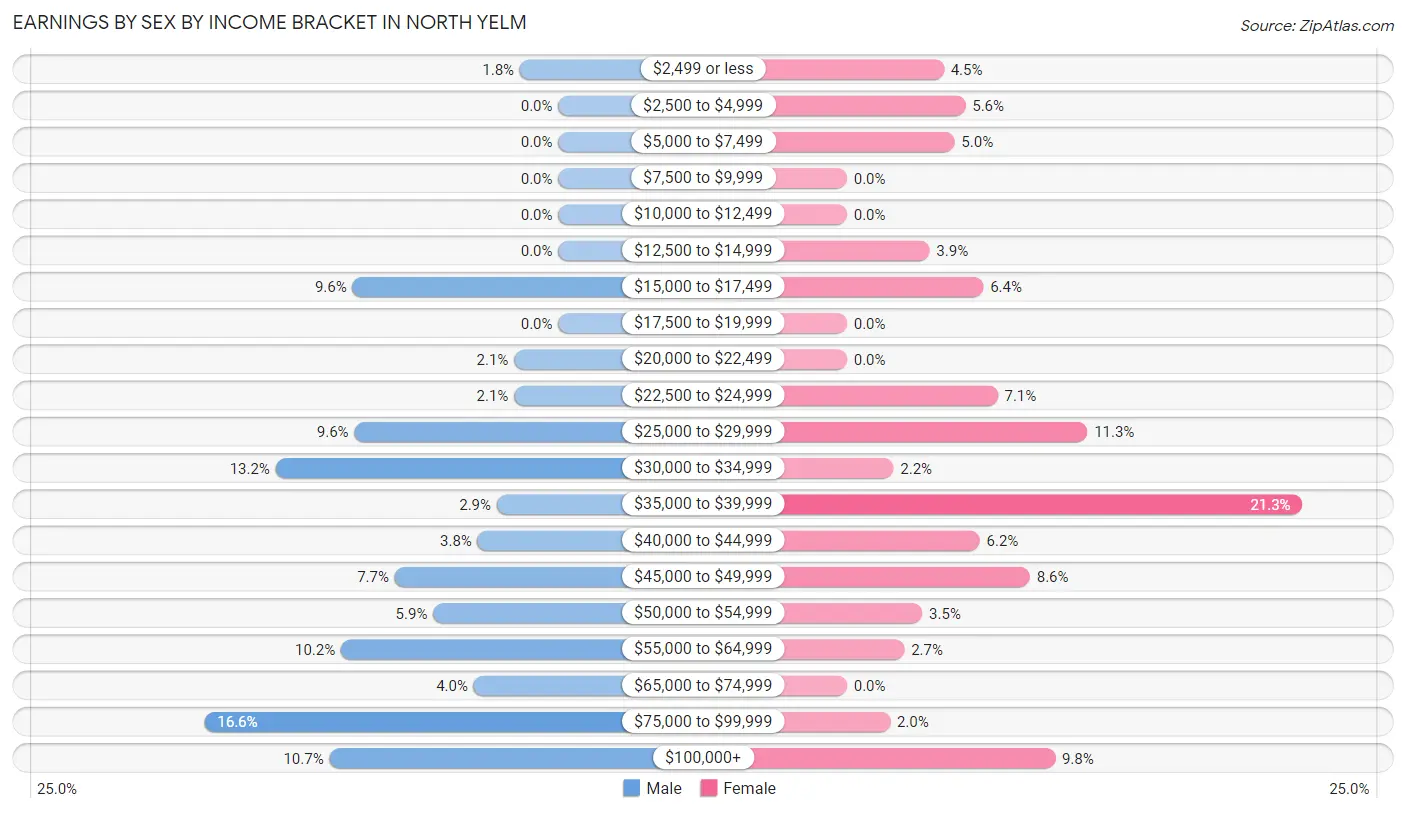
Earnings by Sex by Income Bracket in North Yelm
The most common earnings brackets in North Yelm are $75,000 to $99,999 for men (184 | 16.6%) and $35,000 to $39,999 for women (127 | 21.3%).
| Income | Male | Female |
| $2,499 or less | 20 (1.8%) | 27 (4.5%) |
| $2,500 to $4,999 | 0 (0.0%) | 33 (5.6%) |
| $5,000 to $7,499 | 0 (0.0%) | 30 (5.0%) |
| $7,500 to $9,999 | 0 (0.0%) | 0 (0.0%) |
| $10,000 to $12,499 | 0 (0.0%) | 0 (0.0%) |
| $12,500 to $14,999 | 0 (0.0%) | 23 (3.9%) |
| $15,000 to $17,499 | 107 (9.6%) | 38 (6.4%) |
| $17,500 to $19,999 | 0 (0.0%) | 0 (0.0%) |
| $20,000 to $22,499 | 23 (2.1%) | 0 (0.0%) |
| $22,500 to $24,999 | 23 (2.1%) | 42 (7.1%) |
| $25,000 to $29,999 | 106 (9.6%) | 67 (11.3%) |
| $30,000 to $34,999 | 147 (13.2%) | 13 (2.2%) |
| $35,000 to $39,999 | 32 (2.9%) | 127 (21.3%) |
| $40,000 to $44,999 | 42 (3.8%) | 37 (6.2%) |
| $45,000 to $49,999 | 85 (7.7%) | 51 (8.6%) |
| $50,000 to $54,999 | 65 (5.9%) | 21 (3.5%) |
| $55,000 to $64,999 | 113 (10.2%) | 16 (2.7%) |
| $65,000 to $74,999 | 44 (4.0%) | 0 (0.0%) |
| $75,000 to $99,999 | 184 (16.6%) | 12 (2.0%) |
| $100,000+ | 119 (10.7%) | 58 (9.8%) |
| Total | 1,110 (100.0%) | 595 (100.0%) |
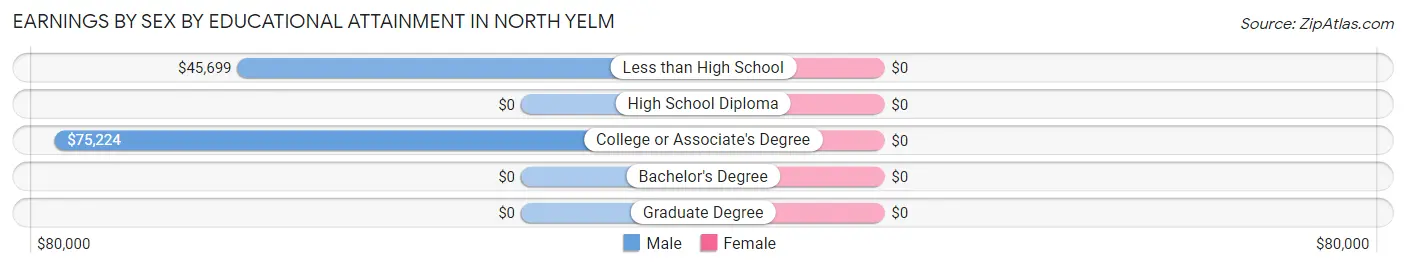
Earnings by Sex by Educational Attainment in North Yelm
| Educational Attainment | Male Income | Female Income |
| Less than High School | $45,699 | $0 |
| High School Diploma | - | - |
| College or Associate's Degree | $75,224 | $0 |
| Bachelor's Degree | - | - |
| Graduate Degree | - | - |
| Total | $50,686 | $28,972 |
Family Income in North Yelm
Family Income Brackets in North Yelm
According to the North Yelm family income data, there are 189 families falling into the $50,000 to $74,999 income range, which is the most common income bracket and makes up 29.8% of all families.
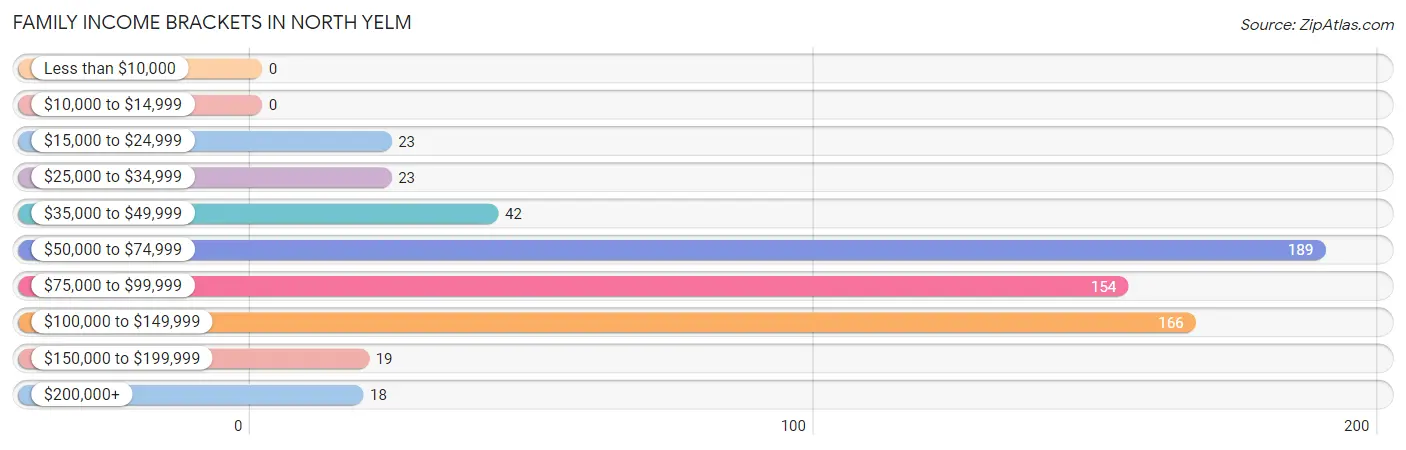
| Income Bracket | # Families | % Families |
| Less than $10,000 | 0 | 0.0% |
| $10,000 to $14,999 | 0 | 0.0% |
| $15,000 to $24,999 | 23 | 3.6% |
| $25,000 to $34,999 | 23 | 3.6% |
| $35,000 to $49,999 | 42 | 6.6% |
| $50,000 to $74,999 | 189 | 29.8% |
| $75,000 to $99,999 | 154 | 24.3% |
| $100,000 to $149,999 | 166 | 26.2% |
| $150,000 to $199,999 | 19 | 3.0% |
| $200,000+ | 18 | 2.8% |
Family Income by Famaliy Size in North Yelm
3-person families (108 | 17.0%) account for the highest median family income in North Yelm with $88,500 per family, while 2-person families (335 | 52.8%) have the highest median income of $33,649 per family member.
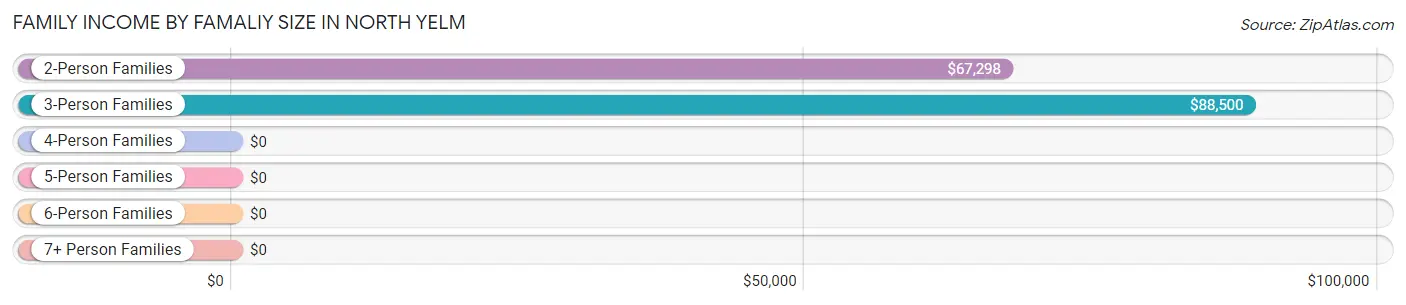
| Income Bracket | # Families | Median Income |
| 2-Person Families | 335 (52.8%) | $67,298 |
| 3-Person Families | 108 (17.0%) | $88,500 |
| 4-Person Families | 173 (27.3%) | $0 |
| 5-Person Families | 18 (2.8%) | $0 |
| 6-Person Families | 0 (0.0%) | $0 |
| 7+ Person Families | 0 (0.0%) | $0 |
| Total | 634 (100.0%) | $77,813 |
Family Income by Number of Earners in North Yelm
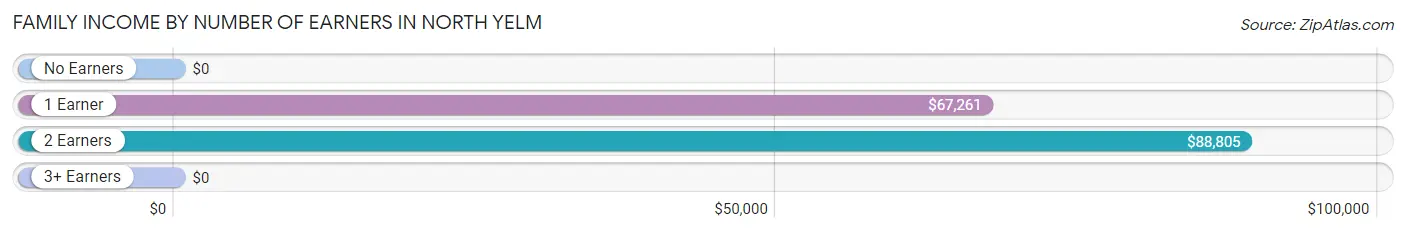
| Number of Earners | # Families | Median Income |
| No Earners | 42 (6.6%) | $0 |
| 1 Earner | 315 (49.7%) | $67,261 |
| 2 Earners | 243 (38.3%) | $88,805 |
| 3+ Earners | 34 (5.4%) | $0 |
| Total | 634 (100.0%) | $77,813 |
Household Income in North Yelm
Household Income Brackets in North Yelm
With 320 households falling in the category, the $50,000 to $74,999 income range is the most frequent in North Yelm, accounting for 27.7% of all households.
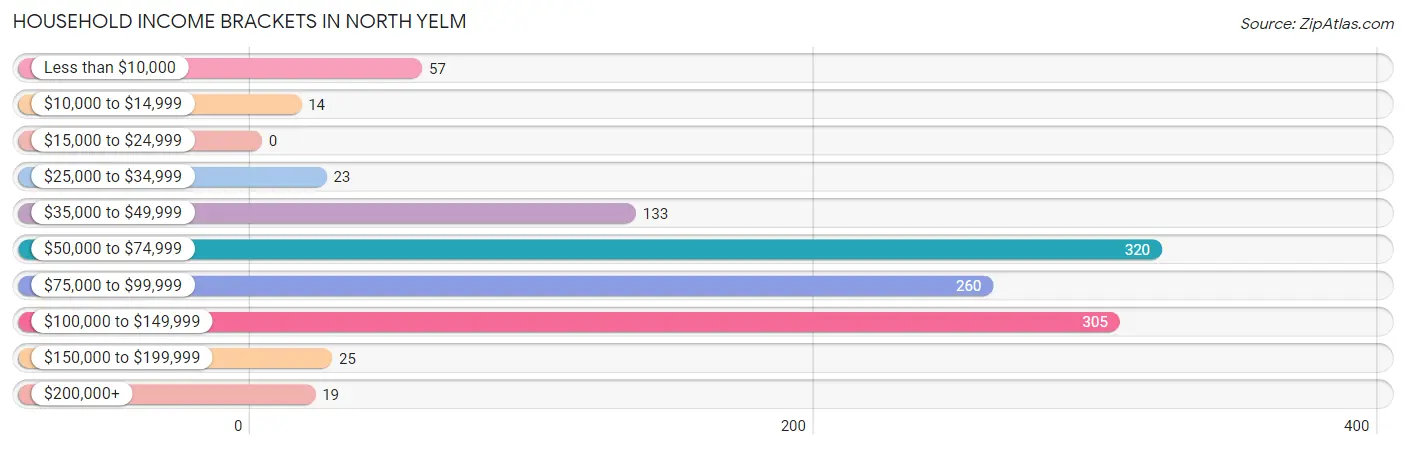
| Income Bracket | # Households | % Households |
| Less than $10,000 | 57 | 4.9% |
| $10,000 to $14,999 | 14 | 1.2% |
| $15,000 to $24,999 | 0 | 0.0% |
| $25,000 to $34,999 | 23 | 2.0% |
| $35,000 to $49,999 | 133 | 11.5% |
| $50,000 to $74,999 | 320 | 27.7% |
| $75,000 to $99,999 | 260 | 22.5% |
| $100,000 to $149,999 | 305 | 26.4% |
| $150,000 to $199,999 | 25 | 2.2% |
| $200,000+ | 19 | 1.6% |
Household Income by Householder Age in North Yelm
The median household income in North Yelm is $75,489, with the highest median household income of $87,614 found in the 25 to 44 years age bracket for the primary householder. A total of 269 households (23.3%) fall into this category. Meanwhile, the 15 to 24 years age bracket for the primary householder has the lowest median household income of $0, with 42 households (3.6%) in this group.
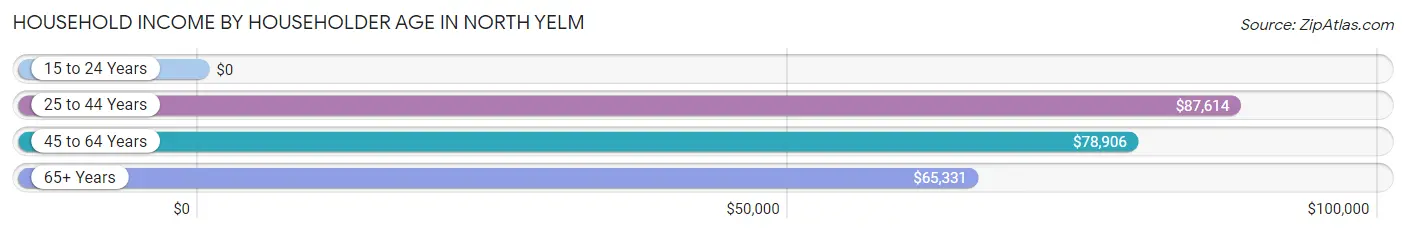
| Income Bracket | # Households | Median Income |
| 15 to 24 Years | 42 (3.6%) | $0 |
| 25 to 44 Years | 269 (23.3%) | $87,614 |
| 45 to 64 Years | 572 (49.4%) | $78,906 |
| 65+ Years | 274 (23.7%) | $65,331 |
| Total | 1,157 (100.0%) | $75,489 |
Poverty in North Yelm
Income Below Poverty by Sex and Age in North Yelm
With 5.6% poverty level for males and 1.2% for females among the residents of North Yelm, 65 to 74 year old males and 55 to 64 year old females are the most vulnerable to poverty, with 45 males (22.6%) and 14 females (7.0%) in their respective age groups living below the poverty level.
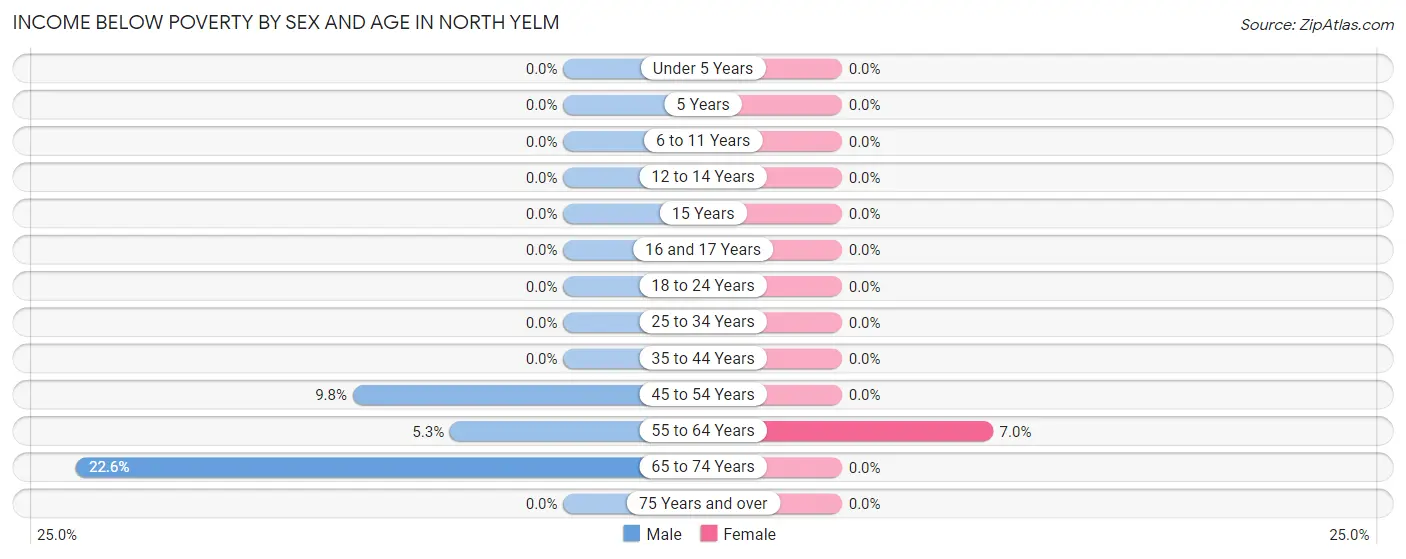
| Age Bracket | Male | Female |
| Under 5 Years | 0 (0.0%) | 0 (0.0%) |
| 5 Years | 0 (0.0%) | 0 (0.0%) |
| 6 to 11 Years | 0 (0.0%) | 0 (0.0%) |
| 12 to 14 Years | 0 (0.0%) | 0 (0.0%) |
| 15 Years | 0 (0.0%) | 0 (0.0%) |
| 16 and 17 Years | 0 (0.0%) | 0 (0.0%) |
| 18 to 24 Years | 0 (0.0%) | 0 (0.0%) |
| 25 to 34 Years | 0 (0.0%) | 0 (0.0%) |
| 35 to 44 Years | 0 (0.0%) | 0 (0.0%) |
| 45 to 54 Years | 30 (9.8%) | 0 (0.0%) |
| 55 to 64 Years | 12 (5.3%) | 14 (7.0%) |
| 65 to 74 Years | 45 (22.6%) | 0 (0.0%) |
| 75 Years and over | 0 (0.0%) | 0 (0.0%) |
| Total | 87 (5.6%) | 14 (1.2%) |
Income Above Poverty by Sex and Age in North Yelm
According to the poverty statistics in North Yelm, males aged under 5 years and females aged under 5 years are the age groups that are most secure financially, with 100.0% of males and 100.0% of females in these age groups living above the poverty line.
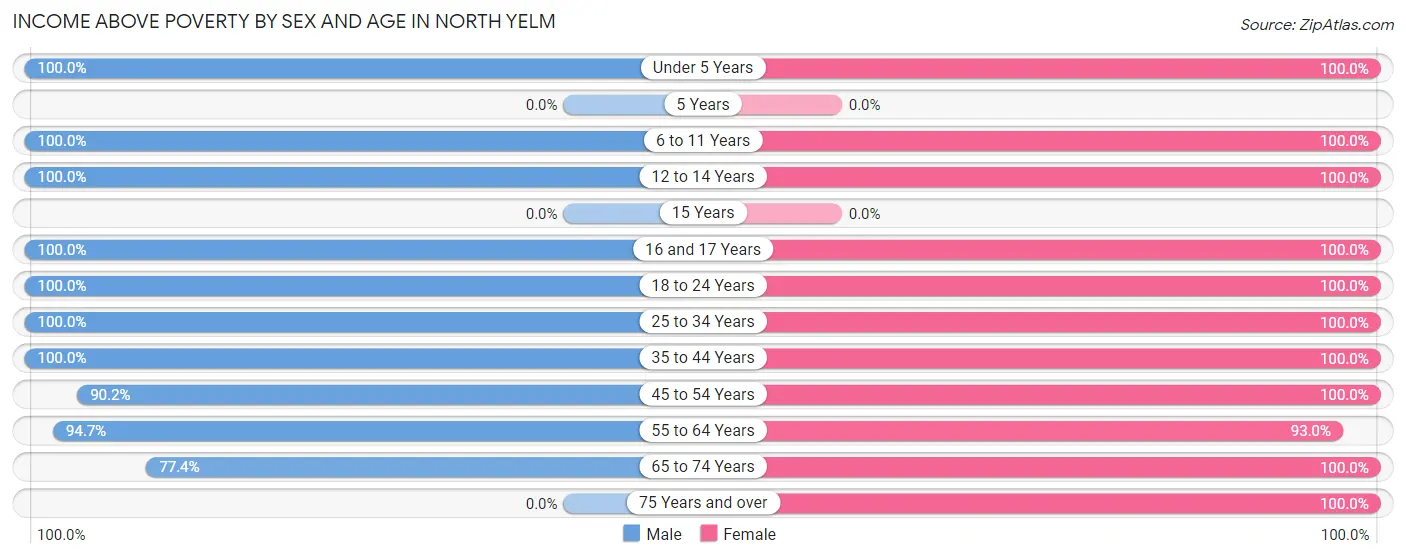
| Age Bracket | Male | Female |
| Under 5 Years | 36 (100.0%) | 23 (100.0%) |
| 5 Years | 0 (0.0%) | 0 (0.0%) |
| 6 to 11 Years | 105 (100.0%) | 38 (100.0%) |
| 12 to 14 Years | 44 (100.0%) | 48 (100.0%) |
| 15 Years | 0 (0.0%) | 0 (0.0%) |
| 16 and 17 Years | 14 (100.0%) | 45 (100.0%) |
| 18 to 24 Years | 102 (100.0%) | 200 (100.0%) |
| 25 to 34 Years | 453 (100.0%) | 159 (100.0%) |
| 35 to 44 Years | 69 (100.0%) | 76 (100.0%) |
| 45 to 54 Years | 277 (90.2%) | 218 (100.0%) |
| 55 to 64 Years | 216 (94.7%) | 186 (93.0%) |
| 65 to 74 Years | 154 (77.4%) | 160 (100.0%) |
| 75 Years and over | 0 (0.0%) | 23 (100.0%) |
| Total | 1,470 (94.4%) | 1,176 (98.8%) |
Income Below Poverty Among Married-Couple Families in North Yelm
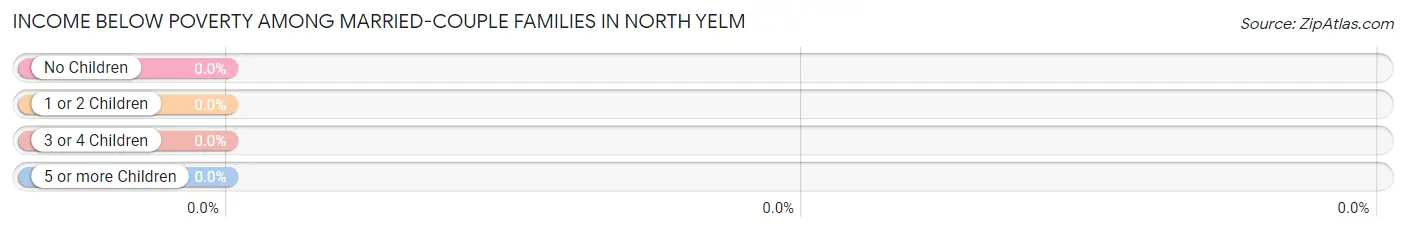
| Children | Above Poverty | Below Poverty |
| No Children | 261 (100.0%) | 0 (0.0%) |
| 1 or 2 Children | 175 (100.0%) | 0 (0.0%) |
| 3 or 4 Children | 0 (0.0%) | 0 (0.0%) |
| 5 or more Children | 0 (0.0%) | 0 (0.0%) |
| Total | 436 (100.0%) | 0 (0.0%) |
Income Below Poverty Among Single-Parent Households in North Yelm
| Children | Single Father | Single Mother |
| No Children | 0 (0.0%) | 0 (0.0%) |
| 1 or 2 Children | 0 (0.0%) | 0 (0.0%) |
| 3 or 4 Children | 0 (0.0%) | 0 (0.0%) |
| 5 or more Children | 0 (0.0%) | 0 (0.0%) |
| Total | 0 (0.0%) | 0 (0.0%) |
Income Below Poverty Among Married-Couple vs Single-Parent Households in North Yelm
| Children | Married-Couple Families | Single-Parent Households |
| No Children | 0 (0.0%) | 0 (0.0%) |
| 1 or 2 Children | 0 (0.0%) | 0 (0.0%) |
| 3 or 4 Children | 0 (0.0%) | 0 (0.0%) |
| 5 or more Children | 0 (0.0%) | 0 (0.0%) |
| Total | 0 (0.0%) | 0 (0.0%) |
Race in North Yelm
The most populous races in North Yelm are White / Caucasian (2,424 | 87.0%), Two or more Races (280 | 10.1%), and Native / Alaskan (40 | 1.4%).
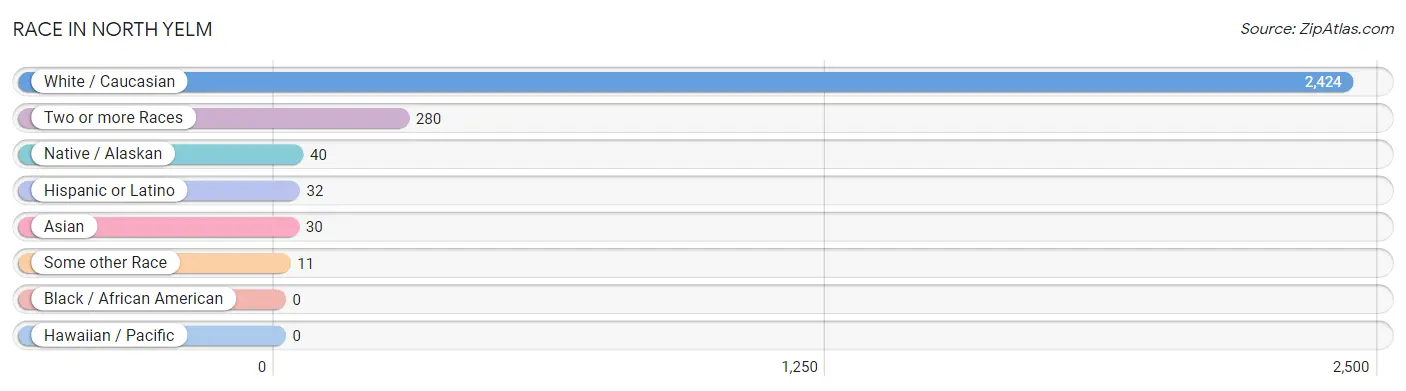
| Race | # Population | % Population |
| Asian | 30 | 1.1% |
| Black / African American | 0 | 0.0% |
| Hawaiian / Pacific | 0 | 0.0% |
| Hispanic or Latino | 32 | 1.1% |
| Native / Alaskan | 40 | 1.4% |
| White / Caucasian | 2,424 | 87.0% |
| Two or more Races | 280 | 10.1% |
| Some other Race | 11 | 0.4% |
| Total | 2,785 | 100.0% |
Ancestry in North Yelm
The most populous ancestries reported in North Yelm are Irish (443 | 15.9%), German (423 | 15.2%), Italian (192 | 6.9%), Norwegian (183 | 6.6%), and American (144 | 5.2%), together accounting for 49.7% of all North Yelm residents.
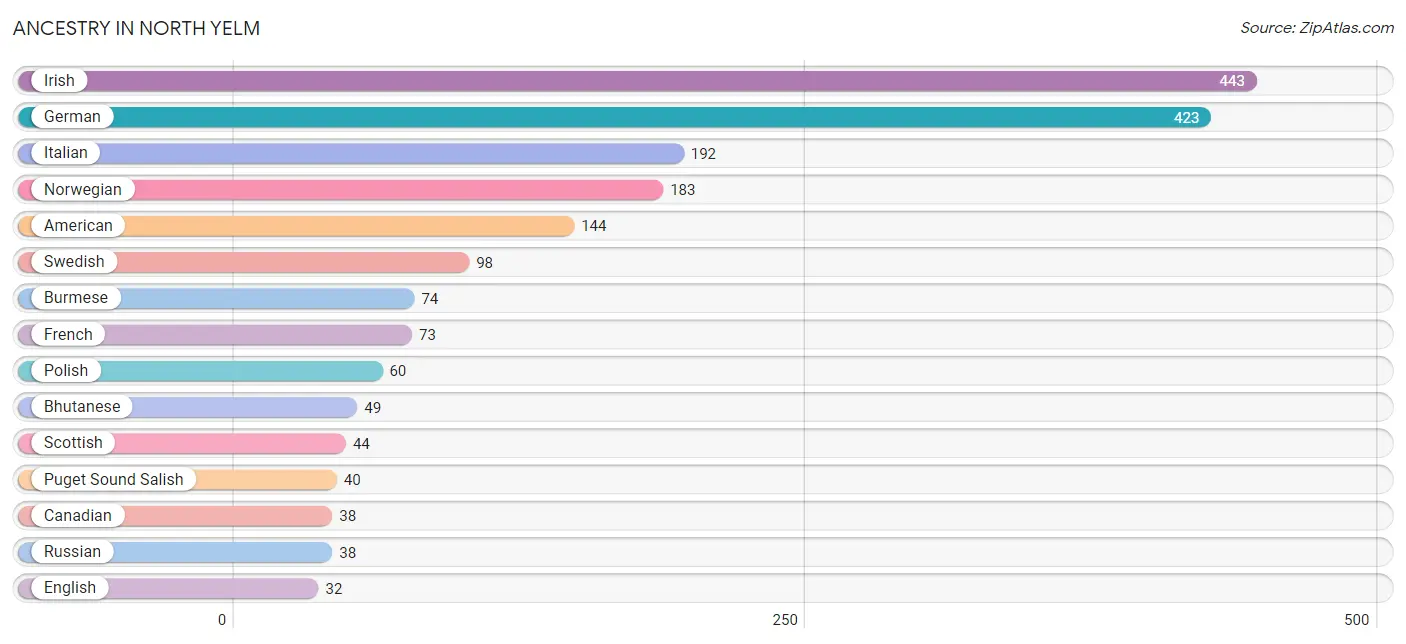
| Ancestry | # Population | % Population |
| American | 144 | 5.2% |
| Bhutanese | 49 | 1.8% |
| Burmese | 74 | 2.7% |
| Canadian | 38 | 1.4% |
| Chippewa | 19 | 0.7% |
| Danish | 21 | 0.7% |
| English | 32 | 1.1% |
| European | 14 | 0.5% |
| French | 73 | 2.6% |
| French Canadian | 32 | 1.1% |
| German | 423 | 15.2% |
| Greek | 10 | 0.4% |
| Irish | 443 | 15.9% |
| Italian | 192 | 6.9% |
| Mexican | 32 | 1.1% |
| Northern European | 15 | 0.5% |
| Norwegian | 183 | 6.6% |
| Pennsylvania German | 13 | 0.5% |
| Polish | 60 | 2.1% |
| Puget Sound Salish | 40 | 1.4% |
| Russian | 38 | 1.4% |
| Scandinavian | 11 | 0.4% |
| Scottish | 44 | 1.6% |
| Swedish | 98 | 3.5% | View All 24 Rows |
Immigrants in North Yelm
The most numerous immigrant groups reported in North Yelm came from Eastern Europe (38 | 1.4%), Europe (38 | 1.4%), Russia (38 | 1.4%), Asia (30 | 1.1%), and Eastern Asia (30 | 1.1%), together accounting for 6.2% of all North Yelm residents.
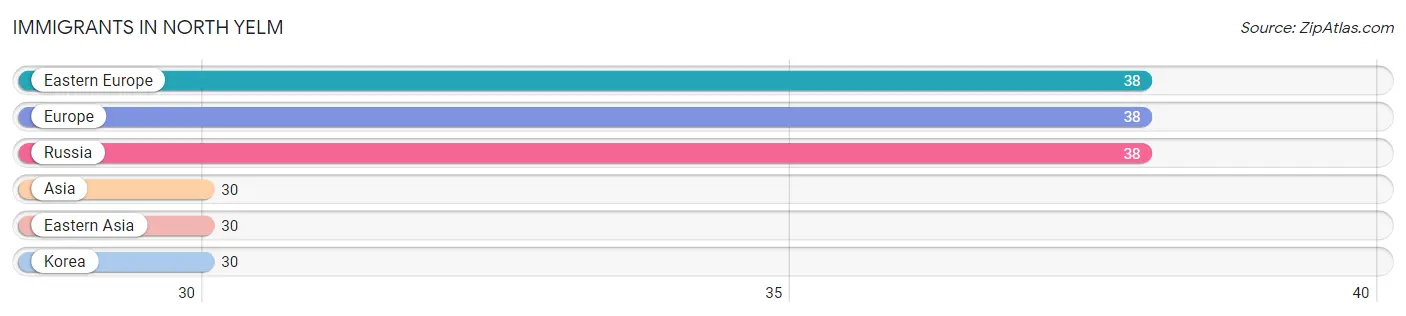
| Immigration Origin | # Population | % Population |
| Asia | 30 | 1.1% |
| Eastern Asia | 30 | 1.1% |
| Eastern Europe | 38 | 1.4% |
| Europe | 38 | 1.4% |
| Korea | 30 | 1.1% |
| Russia | 38 | 1.4% | View All 6 Rows |
Sex and Age in North Yelm
Sex and Age in North Yelm
The most populous age groups in North Yelm are 30 to 34 Years (335 | 21.3%) for men and 20 to 24 Years (183 | 15.1%) for women.
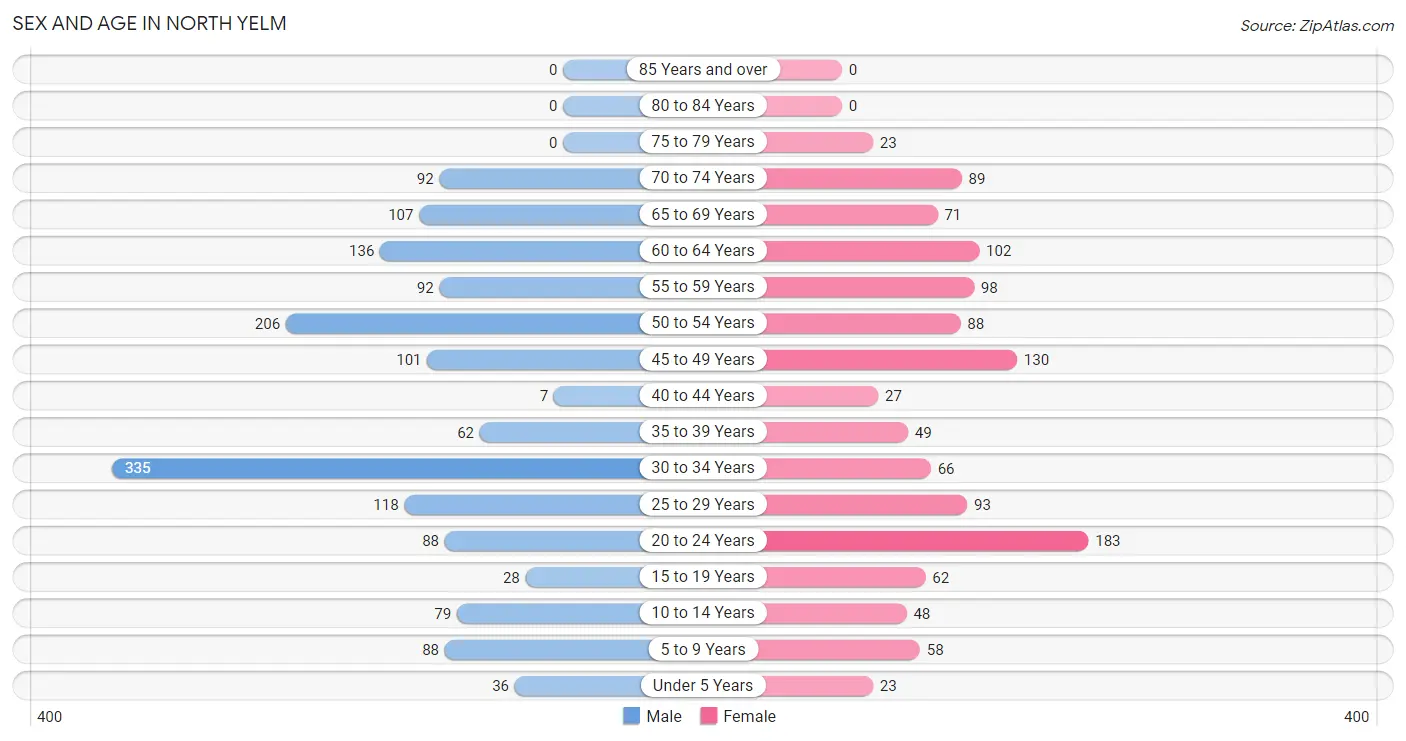
| Age Bracket | Male | Female |
| Under 5 Years | 36 (2.3%) | 23 (1.9%) |
| 5 to 9 Years | 88 (5.6%) | 58 (4.8%) |
| 10 to 14 Years | 79 (5.0%) | 48 (4.0%) |
| 15 to 19 Years | 28 (1.8%) | 62 (5.1%) |
| 20 to 24 Years | 88 (5.6%) | 183 (15.1%) |
| 25 to 29 Years | 118 (7.5%) | 93 (7.7%) |
| 30 to 34 Years | 335 (21.3%) | 66 (5.4%) |
| 35 to 39 Years | 62 (3.9%) | 49 (4.1%) |
| 40 to 44 Years | 7 (0.4%) | 27 (2.2%) |
| 45 to 49 Years | 101 (6.4%) | 130 (10.7%) |
| 50 to 54 Years | 206 (13.1%) | 88 (7.3%) |
| 55 to 59 Years | 92 (5.8%) | 98 (8.1%) |
| 60 to 64 Years | 136 (8.6%) | 102 (8.4%) |
| 65 to 69 Years | 107 (6.8%) | 71 (5.9%) |
| 70 to 74 Years | 92 (5.8%) | 89 (7.4%) |
| 75 to 79 Years | 0 (0.0%) | 23 (1.9%) |
| 80 to 84 Years | 0 (0.0%) | 0 (0.0%) |
| 85 Years and over | 0 (0.0%) | 0 (0.0%) |
| Total | 1,575 (100.0%) | 1,210 (100.0%) |
Families and Households in North Yelm
Median Family Size in North Yelm
The median family size in North Yelm is 3.04 persons per family, with married-couple families (436 | 68.8%) accounting for the largest median family size of 3.29 persons per family. On the other hand, single male/father families (79 | 12.5%) represent the smallest median family size with 2.19 persons per family.
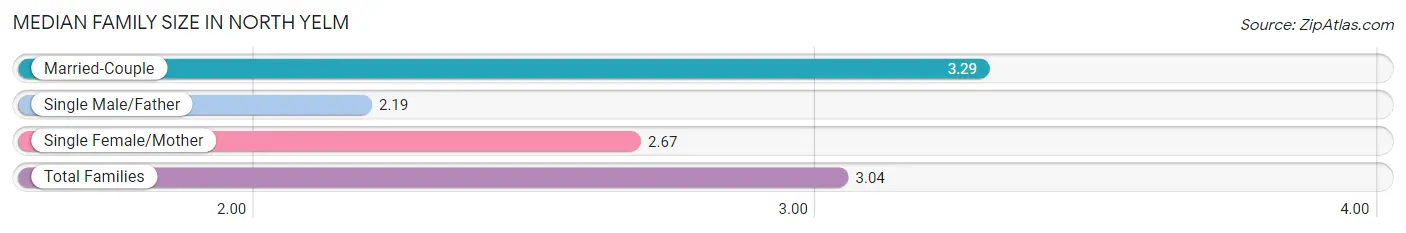
| Family Type | # Families | Family Size |
| Married-Couple | 436 (68.8%) | 3.29 |
| Single Male/Father | 79 (12.5%) | 2.19 |
| Single Female/Mother | 119 (18.8%) | 2.67 |
| Total Families | 634 (100.0%) | 3.04 |
Median Household Size in North Yelm
The median household size in North Yelm is 2.41 persons per household, with married-couple households (436 | 37.7%) accounting for the largest median household size of 3.42 persons per household. non-family households (523 | 45.2%) represent the smallest median household size with 1.44 persons per household.
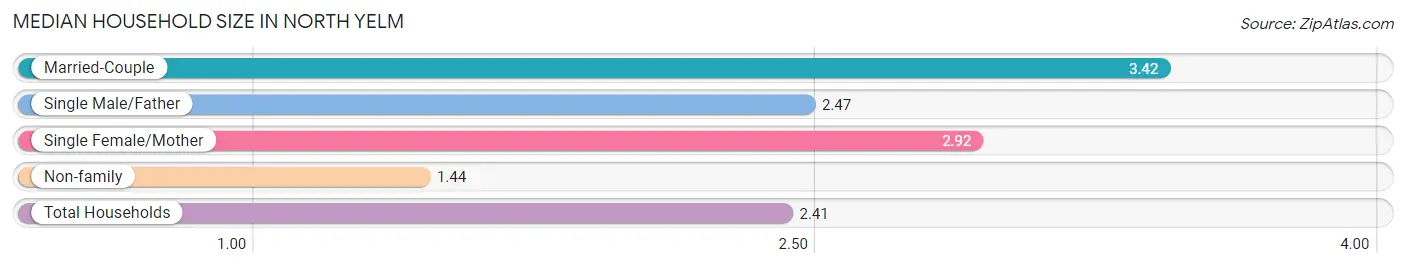
| Household Type | # Households | Household Size |
| Married-Couple | 436 (37.7%) | 3.42 |
| Single Male/Father | 79 (6.8%) | 2.47 |
| Single Female/Mother | 119 (10.3%) | 2.92 |
| Non-family | 523 (45.2%) | 1.44 |
| Total Households | 1,157 (100.0%) | 2.41 |
Household Size by Marriage Status in North Yelm
Out of a total of 1,157 households in North Yelm, 634 (54.8%) are family households, while 523 (45.2%) are nonfamily households. The most numerous type of family households are 2-person households, comprising 272, and the most common type of nonfamily households are 1-person households, comprising 369.
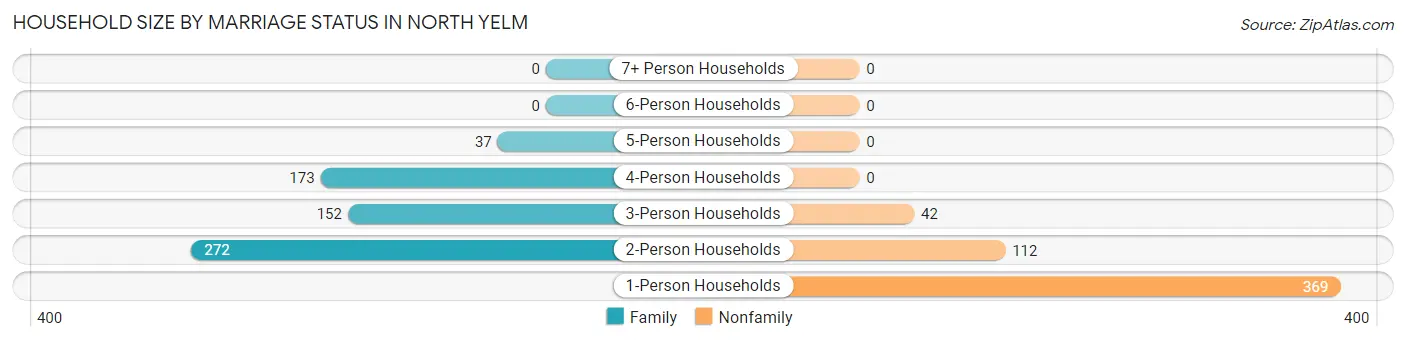
| Household Size | Family Households | Nonfamily Households |
| 1-Person Households | - | 369 (31.9%) |
| 2-Person Households | 272 (23.5%) | 112 (9.7%) |
| 3-Person Households | 152 (13.1%) | 42 (3.6%) |
| 4-Person Households | 173 (14.9%) | 0 (0.0%) |
| 5-Person Households | 37 (3.2%) | 0 (0.0%) |
| 6-Person Households | 0 (0.0%) | 0 (0.0%) |
| 7+ Person Households | 0 (0.0%) | 0 (0.0%) |
| Total | 634 (54.8%) | 523 (45.2%) |
Female Fertility in North Yelm
Fertility by Age in North Yelm
| Age Bracket | Women with Births | Births / 1,000 Women |
| 15 to 19 years | 0 (0.0%) | 0.0 |
| 20 to 34 years | 0 (0.0%) | 0.0 |
| 35 to 50 years | 0 (0.0%) | 0.0 |
| Total | 0 (0.0%) | 0.0 |
Fertility by Age by Marriage Status in North Yelm
| Age Bracket | Married | Unmarried |
| 15 to 19 years | 0 (0.0%) | 0 (0.0%) |
| 20 to 34 years | 0 (0.0%) | 0 (0.0%) |
| 35 to 50 years | 0 (0.0%) | 0 (0.0%) |
| Total | 0 (0.0%) | 0 (0.0%) |
Fertility by Education in North Yelm
| Educational Attainment | Women with Births | Births / 1,000 Women |
| Less than High School | 0 (0.0%) | 0.0 |
| High School Diploma | 0 (0.0%) | 0.0 |
| College or Associate's Degree | 0 (0.0%) | 0.0 |
| Bachelor's Degree | 0 (0.0%) | 0.0 |
| Graduate Degree | 0 (0.0%) | 0.0 |
| Total | 0 (0.0%) | 0.0 |
Fertility by Education by Marriage Status in North Yelm
| Educational Attainment | Married | Unmarried |
| Less than High School | 0 (0.0%) | 0 (0.0%) |
| High School Diploma | 0 (0.0%) | 0 (0.0%) |
| College or Associate's Degree | 0 (0.0%) | 0 (0.0%) |
| Bachelor's Degree | 0 (0.0%) | 0 (0.0%) |
| Graduate Degree | 0 (0.0%) | 0 (0.0%) |
| Total | 0 (0.0%) | 0 (0.0%) |
Employment Characteristics in North Yelm
Employment by Class of Employer in North Yelm
Among the 1,644 employed individuals in North Yelm, private company employees (1,117 | 67.9%), federal government employees (134 | 8.2%), and not-for-profit organizations (109 | 6.6%) make up the most common classes of employment.
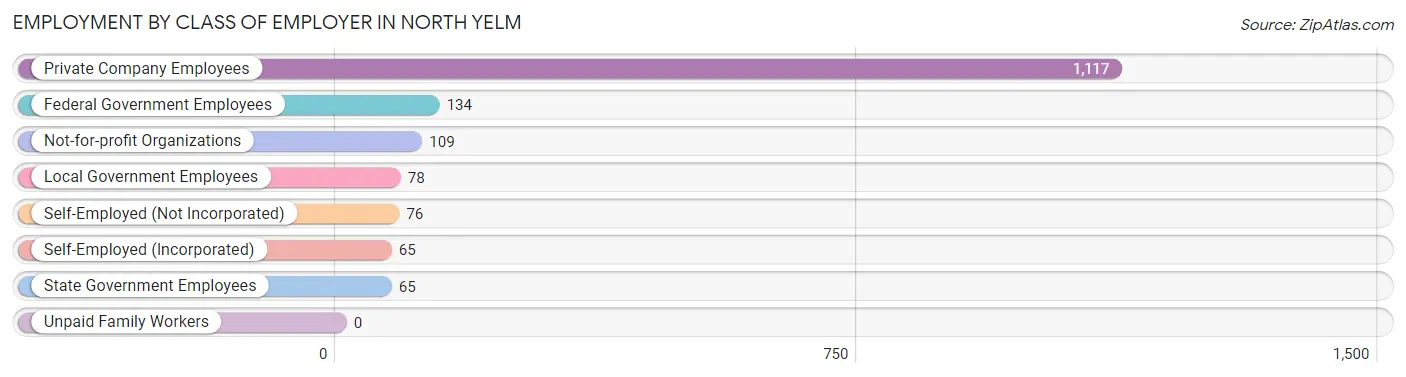
| Employer Class | # Employees | % Employees |
| Private Company Employees | 1,117 | 67.9% |
| Self-Employed (Incorporated) | 65 | 4.0% |
| Self-Employed (Not Incorporated) | 76 | 4.6% |
| Not-for-profit Organizations | 109 | 6.6% |
| Local Government Employees | 78 | 4.7% |
| State Government Employees | 65 | 4.0% |
| Federal Government Employees | 134 | 8.2% |
| Unpaid Family Workers | 0 | 0.0% |
| Total | 1,644 | 100.0% |
Employment Status by Age in North Yelm
According to the labor force statistics for North Yelm, out of the total population over 16 years of age (2,453), 69.2% or 1,697 individuals are in the labor force, with 2.2% or 37 of them unemployed. The age group with the highest labor force participation rate is 20 to 24 years, with 100.0% or 271 individuals in the labor force. Within the labor force, the 16 to 19 years age range has the highest percentage of unemployed individuals, with 100.0% or 17 of them being unemployed.
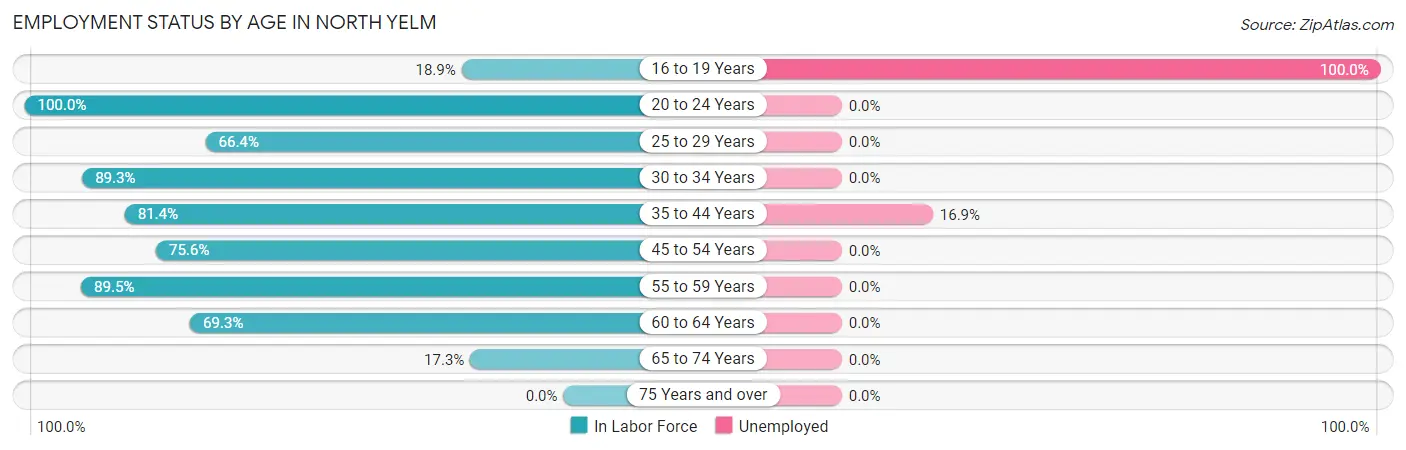
| Age Bracket | In Labor Force | Unemployed |
| 16 to 19 Years | 17 (18.9%) | 17 (100.0%) |
| 20 to 24 Years | 271 (100.0%) | 0 (0.0%) |
| 25 to 29 Years | 140 (66.4%) | 0 (0.0%) |
| 30 to 34 Years | 358 (89.3%) | 0 (0.0%) |
| 35 to 44 Years | 118 (81.4%) | 20 (16.9%) |
| 45 to 54 Years | 397 (75.6%) | 0 (0.0%) |
| 55 to 59 Years | 170 (89.5%) | 0 (0.0%) |
| 60 to 64 Years | 165 (69.3%) | 0 (0.0%) |
| 65 to 74 Years | 62 (17.3%) | 0 (0.0%) |
| 75 Years and over | 0 (0.0%) | 0 (0.0%) |
| Total | 1,697 (69.2%) | 37 (2.2%) |
Employment Status by Educational Attainment in North Yelm
According to labor force statistics for North Yelm, 78.8% of individuals (1,347) out of the total population between 25 and 64 years of age (1,710) are in the labor force, with 1.5% or 20 of them being unemployed. The group with the highest labor force participation rate are those with the educational attainment of less than high school, with 93.1% or 161 individuals in the labor force. Within the labor force, individuals with less than high school education have the highest percentage of unemployment, with 12.4% or 20 of them being unemployed.
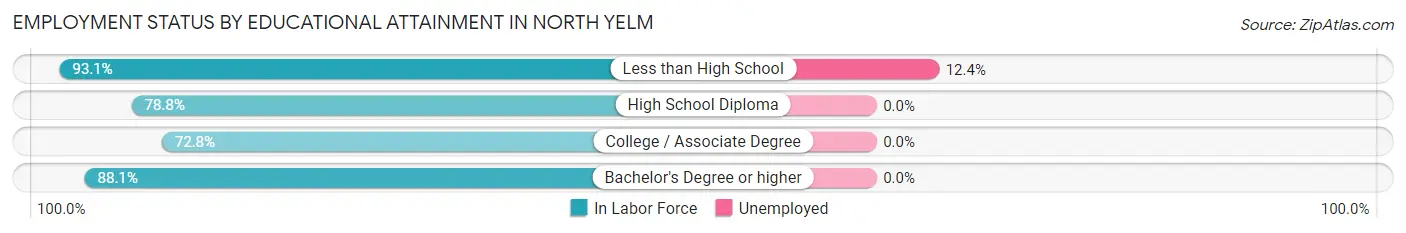
| Educational Attainment | In Labor Force | Unemployed |
| Less than High School | 161 (93.1%) | 21 (12.4%) |
| High School Diploma | 628 (78.8%) | 0 (0.0%) |
| College / Associate Degree | 441 (72.8%) | 0 (0.0%) |
| Bachelor's Degree or higher | 118 (88.1%) | 0 (0.0%) |
| Total | 1,347 (78.8%) | 26 (1.5%) |
Employment Occupations by Sex in North Yelm
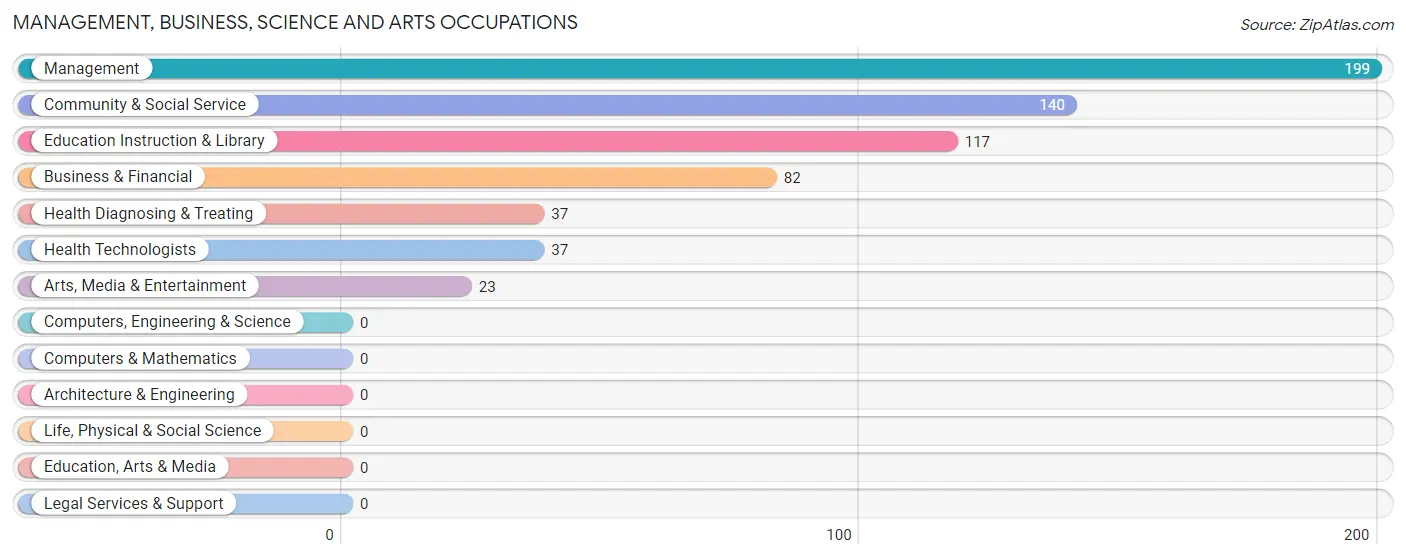
Management, Business, Science and Arts Occupations
The most common Management, Business, Science and Arts occupations in North Yelm are Management (199 | 12.0%), Community & Social Service (140 | 8.4%), Education Instruction & Library (117 | 7.0%), Business & Financial (82 | 4.9%), and Health Diagnosing & Treating (37 | 2.2%).
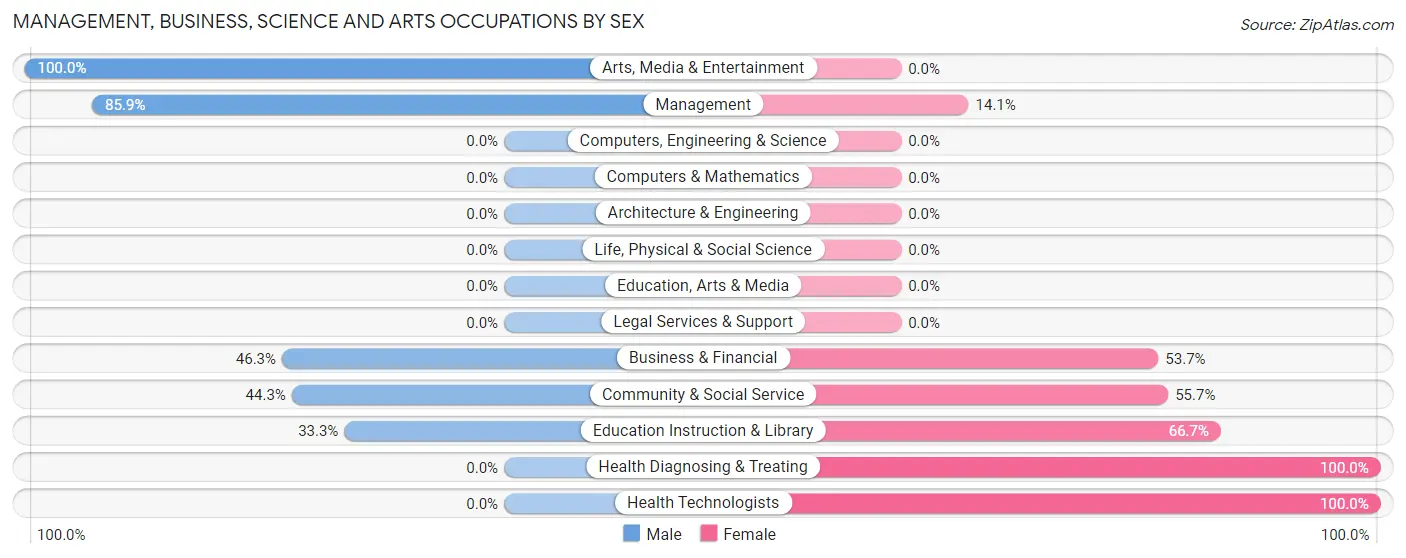
Management, Business, Science and Arts Occupations by Sex
Within the Management, Business, Science and Arts occupations in North Yelm, the most male-oriented occupations are Arts, Media & Entertainment (100.0%), Management (85.9%), and Business & Financial (46.3%), while the most female-oriented occupations are Health Diagnosing & Treating (100.0%), Health Technologists (100.0%), and Education Instruction & Library (66.7%).
| Occupation | Male | Female |
| Management | 171 (85.9%) | 28 (14.1%) |
| Business & Financial | 38 (46.3%) | 44 (53.7%) |
| Computers, Engineering & Science | 0 (0.0%) | 0 (0.0%) |
| Computers & Mathematics | 0 (0.0%) | 0 (0.0%) |
| Architecture & Engineering | 0 (0.0%) | 0 (0.0%) |
| Life, Physical & Social Science | 0 (0.0%) | 0 (0.0%) |
| Community & Social Service | 62 (44.3%) | 78 (55.7%) |
| Education, Arts & Media | 0 (0.0%) | 0 (0.0%) |
| Legal Services & Support | 0 (0.0%) | 0 (0.0%) |
| Education Instruction & Library | 39 (33.3%) | 78 (66.7%) |
| Arts, Media & Entertainment | 23 (100.0%) | 0 (0.0%) |
| Health Diagnosing & Treating | 0 (0.0%) | 37 (100.0%) |
| Health Technologists | 0 (0.0%) | 37 (100.0%) |
| Total (Category) | 271 (59.2%) | 187 (40.8%) |
| Total (Overall) | 1,110 (66.8%) | 551 (33.2%) |
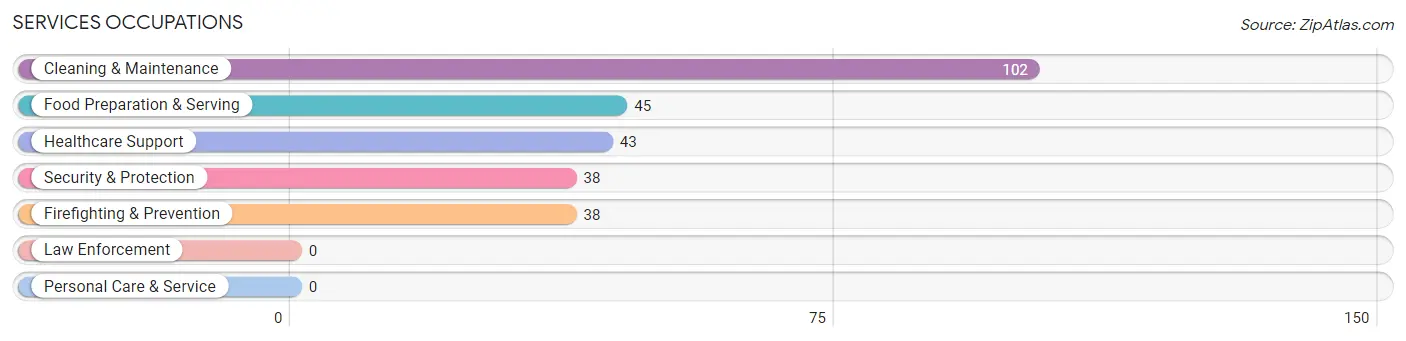
Services Occupations
The most common Services occupations in North Yelm are Cleaning & Maintenance (102 | 6.1%), Food Preparation & Serving (45 | 2.7%), Healthcare Support (43 | 2.6%), Security & Protection (38 | 2.3%), and Firefighting & Prevention (38 | 2.3%).
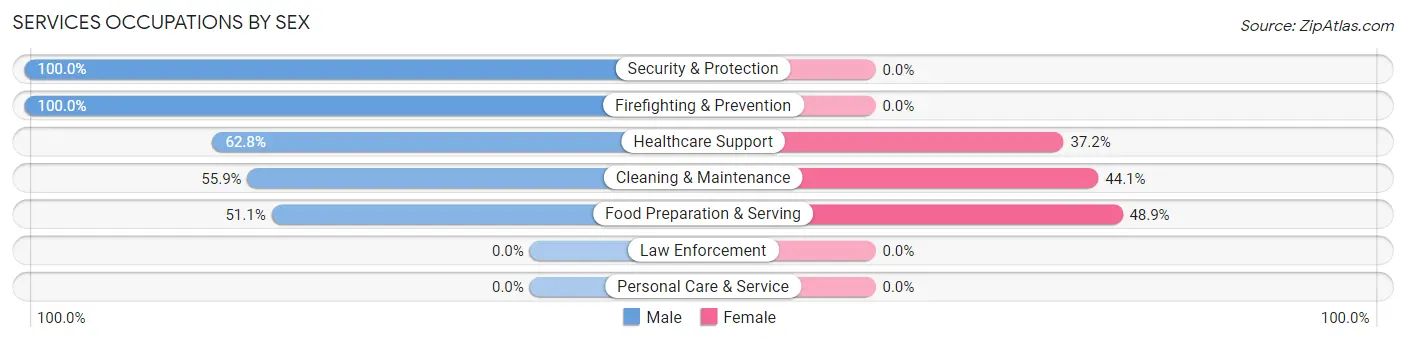
Services Occupations by Sex
Within the Services occupations in North Yelm, the most male-oriented occupations are Security & Protection (100.0%), Firefighting & Prevention (100.0%), and Healthcare Support (62.8%), while the most female-oriented occupations are Food Preparation & Serving (48.9%), Cleaning & Maintenance (44.1%), and Healthcare Support (37.2%).
| Occupation | Male | Female |
| Healthcare Support | 27 (62.8%) | 16 (37.2%) |
| Security & Protection | 38 (100.0%) | 0 (0.0%) |
| Firefighting & Prevention | 38 (100.0%) | 0 (0.0%) |
| Law Enforcement | 0 (0.0%) | 0 (0.0%) |
| Food Preparation & Serving | 23 (51.1%) | 22 (48.9%) |
| Cleaning & Maintenance | 57 (55.9%) | 45 (44.1%) |
| Personal Care & Service | 0 (0.0%) | 0 (0.0%) |
| Total (Category) | 145 (63.6%) | 83 (36.4%) |
| Total (Overall) | 1,110 (66.8%) | 551 (33.2%) |
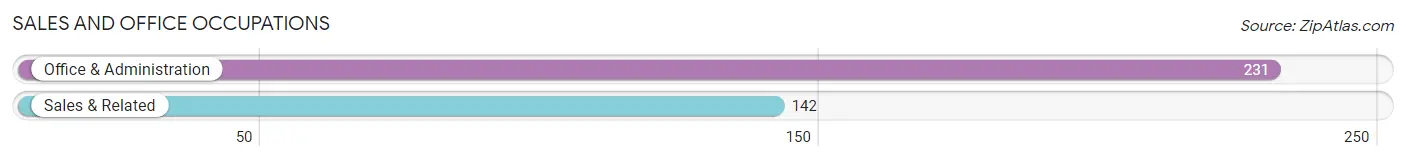
Sales and Office Occupations
The most common Sales and Office occupations in North Yelm are Office & Administration (231 | 13.9%), and Sales & Related (142 | 8.6%).
Sales and Office Occupations by Sex
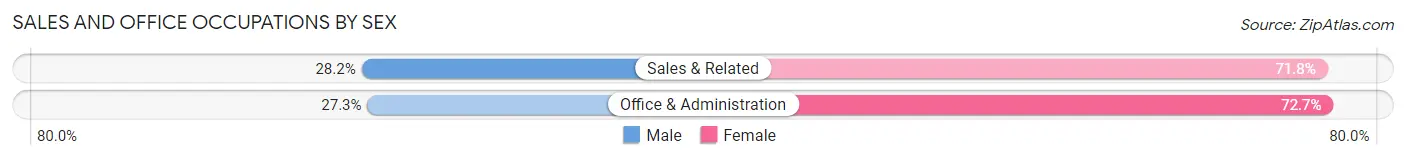
| Occupation | Male | Female |
| Sales & Related | 40 (28.2%) | 102 (71.8%) |
| Office & Administration | 63 (27.3%) | 168 (72.7%) |
| Total (Category) | 103 (27.6%) | 270 (72.4%) |
| Total (Overall) | 1,110 (66.8%) | 551 (33.2%) |
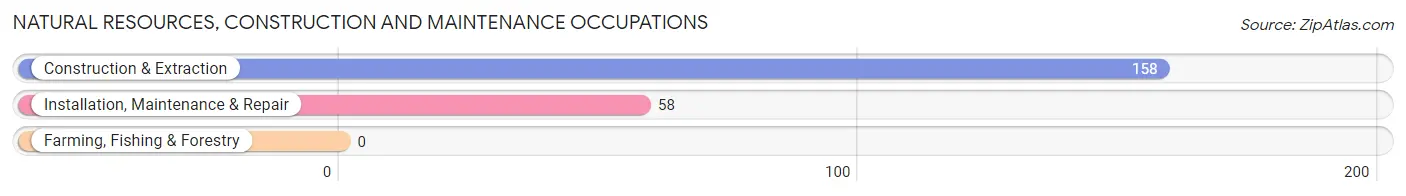
Natural Resources, Construction and Maintenance Occupations
The most common Natural Resources, Construction and Maintenance occupations in North Yelm are Construction & Extraction (158 | 9.5%), and Installation, Maintenance & Repair (58 | 3.5%).
Natural Resources, Construction and Maintenance Occupations by Sex
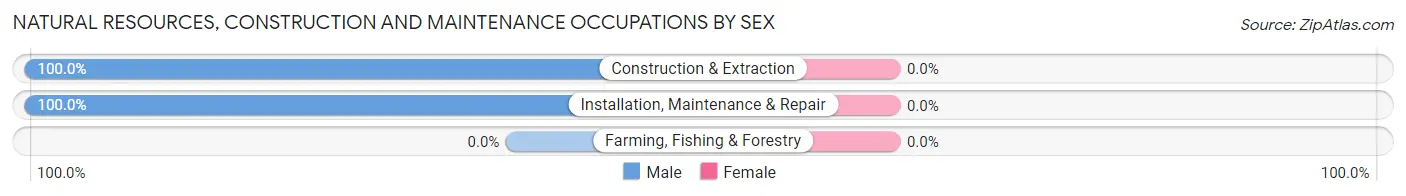
| Occupation | Male | Female |
| Farming, Fishing & Forestry | 0 (0.0%) | 0 (0.0%) |
| Construction & Extraction | 158 (100.0%) | 0 (0.0%) |
| Installation, Maintenance & Repair | 58 (100.0%) | 0 (0.0%) |
| Total (Category) | 216 (100.0%) | 0 (0.0%) |
| Total (Overall) | 1,110 (66.8%) | 551 (33.2%) |
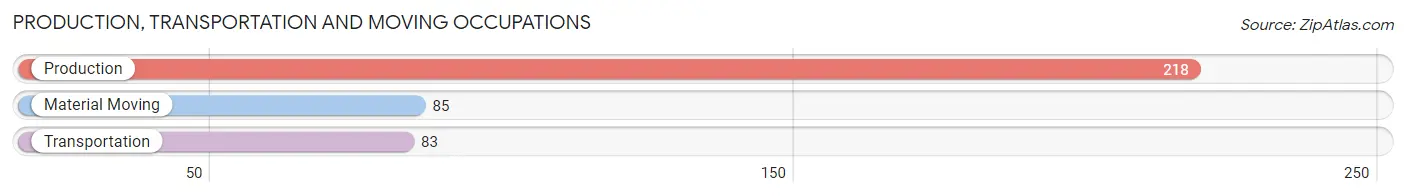
Production, Transportation and Moving Occupations
The most common Production, Transportation and Moving occupations in North Yelm are Production (218 | 13.1%), Material Moving (85 | 5.1%), and Transportation (83 | 5.0%).
Production, Transportation and Moving Occupations by Sex
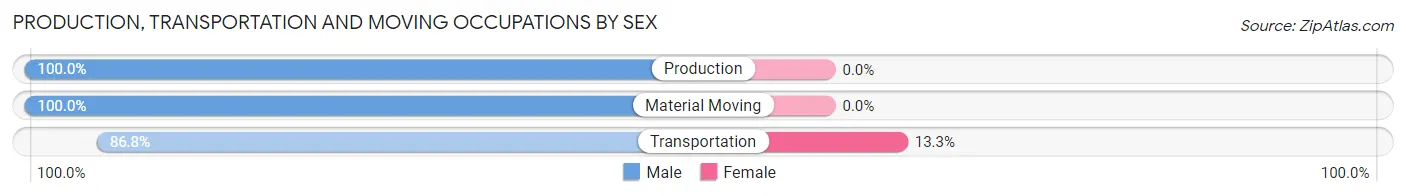
| Occupation | Male | Female |
| Production | 218 (100.0%) | 0 (0.0%) |
| Transportation | 72 (86.8%) | 11 (13.3%) |
| Material Moving | 85 (100.0%) | 0 (0.0%) |
| Total (Category) | 375 (97.2%) | 11 (2.9%) |
| Total (Overall) | 1,110 (66.8%) | 551 (33.2%) |
Employment Industries by Sex in North Yelm
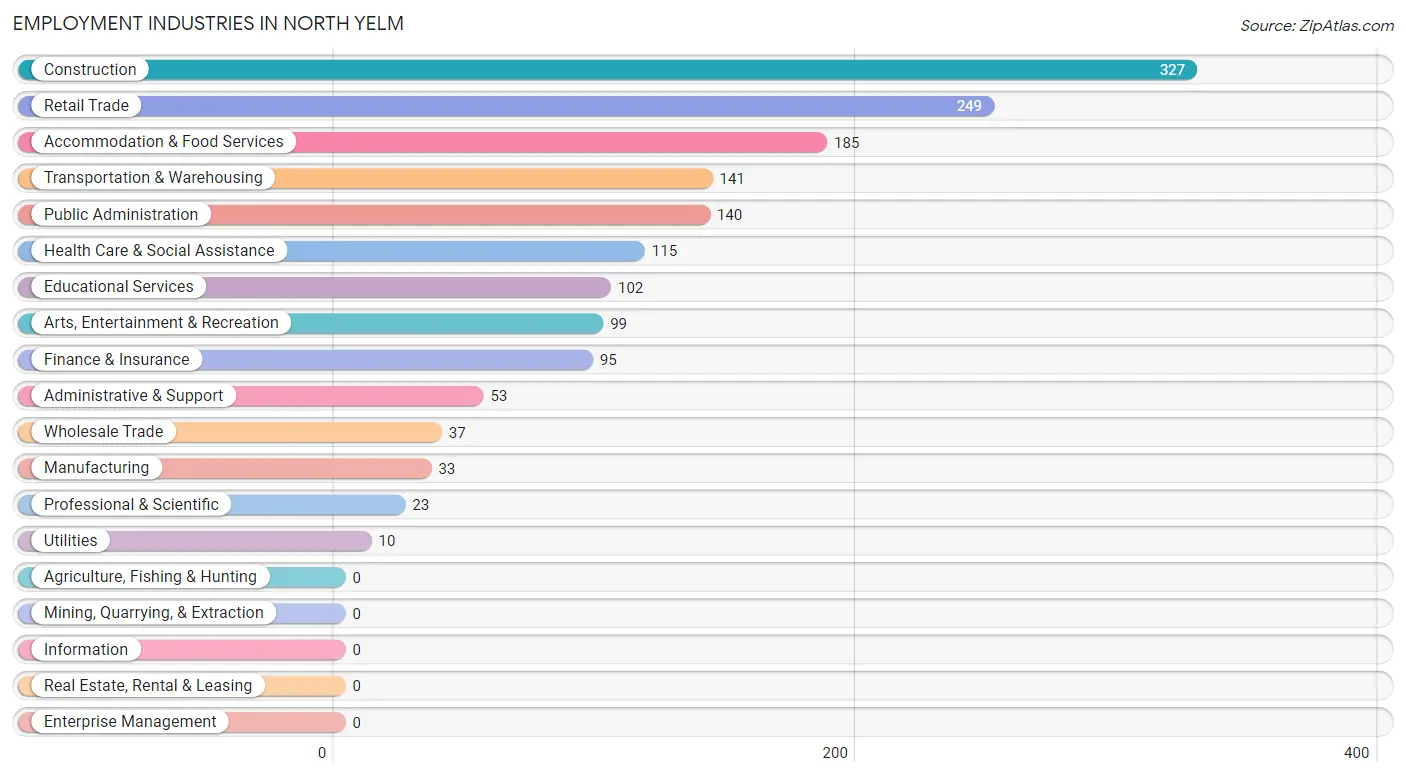
Employment Industries in North Yelm
The major employment industries in North Yelm include Construction (327 | 19.7%), Retail Trade (249 | 15.0%), Accommodation & Food Services (185 | 11.1%), Transportation & Warehousing (141 | 8.5%), and Public Administration (140 | 8.4%).
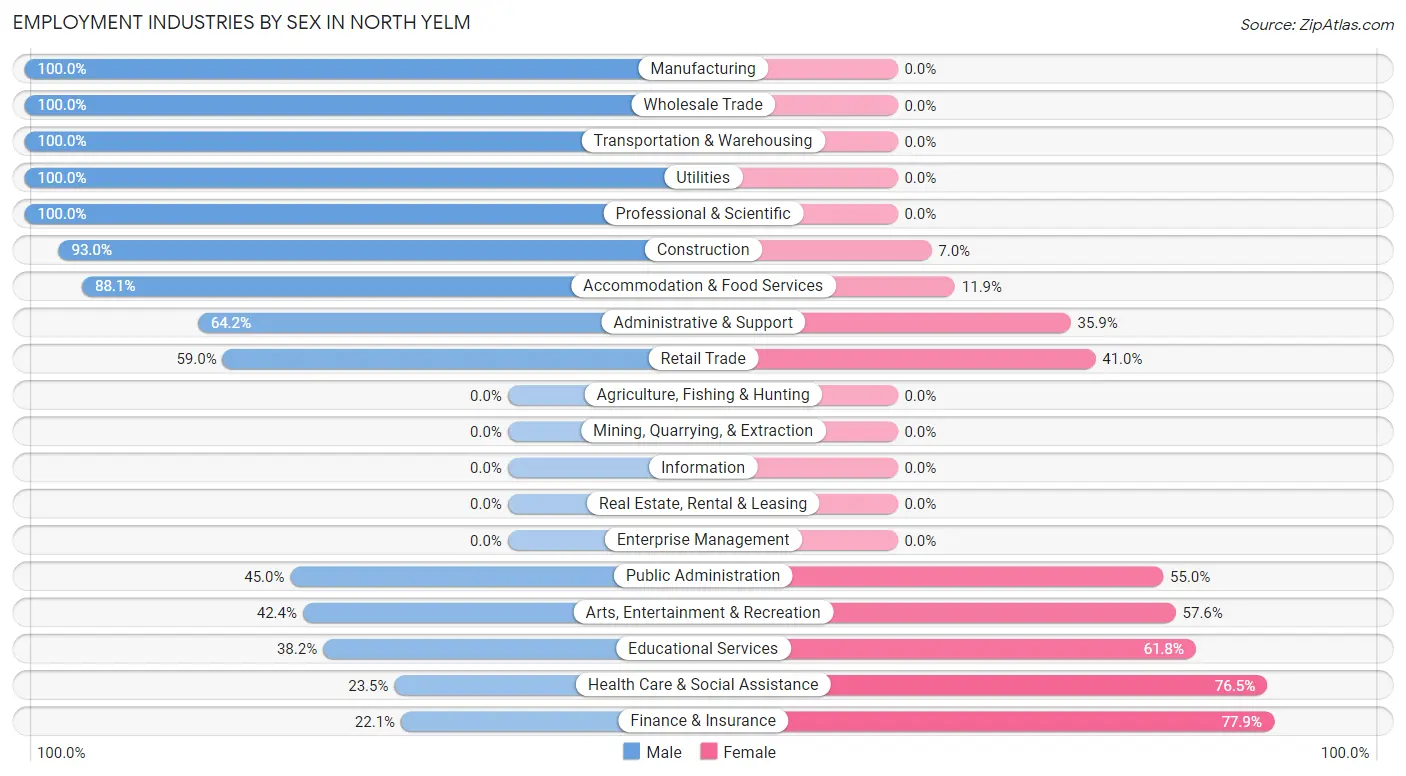
Employment Industries by Sex in North Yelm
The North Yelm industries that see more men than women are Manufacturing (100.0%), Wholesale Trade (100.0%), and Transportation & Warehousing (100.0%), whereas the industries that tend to have a higher number of women are Finance & Insurance (77.9%), Health Care & Social Assistance (76.5%), and Educational Services (61.8%).
| Industry | Male | Female |
| Agriculture, Fishing & Hunting | 0 (0.0%) | 0 (0.0%) |
| Mining, Quarrying, & Extraction | 0 (0.0%) | 0 (0.0%) |
| Construction | 304 (93.0%) | 23 (7.0%) |
| Manufacturing | 33 (100.0%) | 0 (0.0%) |
| Wholesale Trade | 37 (100.0%) | 0 (0.0%) |
| Retail Trade | 147 (59.0%) | 102 (41.0%) |
| Transportation & Warehousing | 141 (100.0%) | 0 (0.0%) |
| Utilities | 10 (100.0%) | 0 (0.0%) |
| Information | 0 (0.0%) | 0 (0.0%) |
| Finance & Insurance | 21 (22.1%) | 74 (77.9%) |
| Real Estate, Rental & Leasing | 0 (0.0%) | 0 (0.0%) |
| Professional & Scientific | 23 (100.0%) | 0 (0.0%) |
| Enterprise Management | 0 (0.0%) | 0 (0.0%) |
| Administrative & Support | 34 (64.1%) | 19 (35.8%) |
| Educational Services | 39 (38.2%) | 63 (61.8%) |
| Health Care & Social Assistance | 27 (23.5%) | 88 (76.5%) |
| Arts, Entertainment & Recreation | 42 (42.4%) | 57 (57.6%) |
| Accommodation & Food Services | 163 (88.1%) | 22 (11.9%) |
| Public Administration | 63 (45.0%) | 77 (55.0%) |
| Total | 1,110 (66.8%) | 551 (33.2%) |
Education in North Yelm
School Enrollment in North Yelm
The most common levels of schooling among the 547 students in North Yelm are college / undergraduate (173 | 31.6%), elementary school (146 | 26.7%), and middle school (127 | 23.2%).
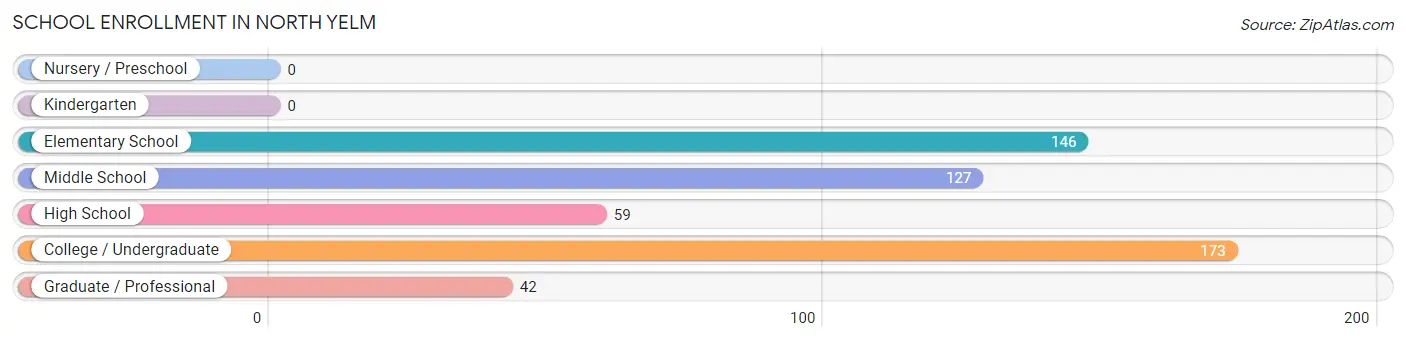
| School Level | # Students | % Students |
| Nursery / Preschool | 0 | 0.0% |
| Kindergarten | 0 | 0.0% |
| Elementary School | 146 | 26.7% |
| Middle School | 127 | 23.2% |
| High School | 59 | 10.8% |
| College / Undergraduate | 173 | 31.6% |
| Graduate / Professional | 42 | 7.7% |
| Total | 547 | 100.0% |
School Enrollment by Age by Funding Source in North Yelm
Out of a total of 547 students who are enrolled in schools in North Yelm, 25 (4.6%) attend a private institution, while the remaining 522 (95.4%) are enrolled in public schools. The age group of 18 to 19 year olds has the highest likelihood of being enrolled in private schools, with 14 (45.2% in the age bracket) enrolled. Conversely, the age group of 5 to 9 year old has the lowest likelihood of being enrolled in a private school, with 146 (100.0% in the age bracket) attending a public institution.
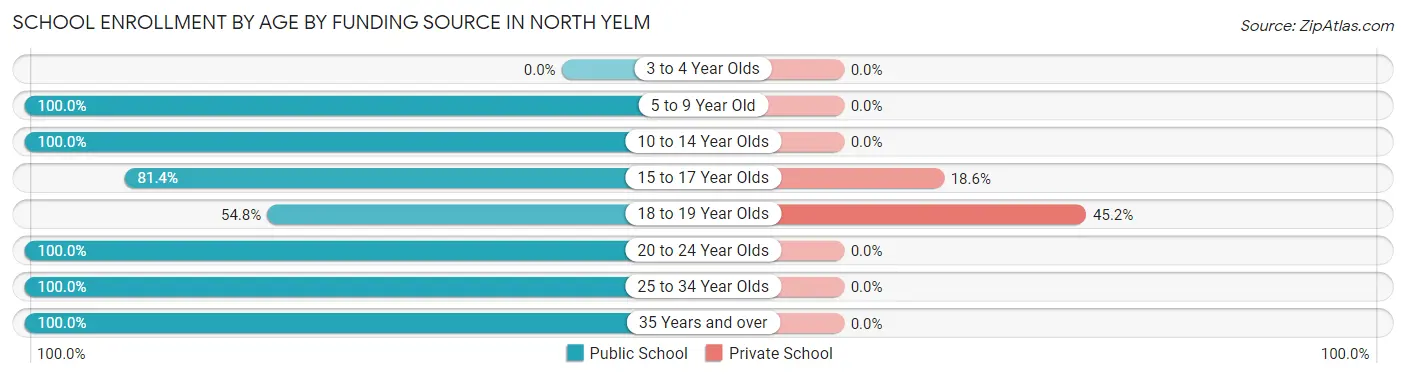
| Age Bracket | Public School | Private School |
| 3 to 4 Year Olds | 0 (0.0%) | 0 (0.0%) |
| 5 to 9 Year Old | 146 (100.0%) | 0 (0.0%) |
| 10 to 14 Year Olds | 127 (100.0%) | 0 (0.0%) |
| 15 to 17 Year Olds | 48 (81.4%) | 11 (18.6%) |
| 18 to 19 Year Olds | 17 (54.8%) | 14 (45.2%) |
| 20 to 24 Year Olds | 53 (100.0%) | 0 (0.0%) |
| 25 to 34 Year Olds | 38 (100.0%) | 0 (0.0%) |
| 35 Years and over | 93 (100.0%) | 0 (0.0%) |
| Total | 522 (95.4%) | 25 (4.6%) |
Educational Attainment by Field of Study in North Yelm
Social sciences (39 | 22.5%), multidisciplinary studies (39 | 22.5%), business (32 | 18.5%), arts & humanities (28 | 16.2%), and education (19 | 11.0%) are the most common fields of study among 173 individuals in North Yelm who have obtained a bachelor's degree or higher.
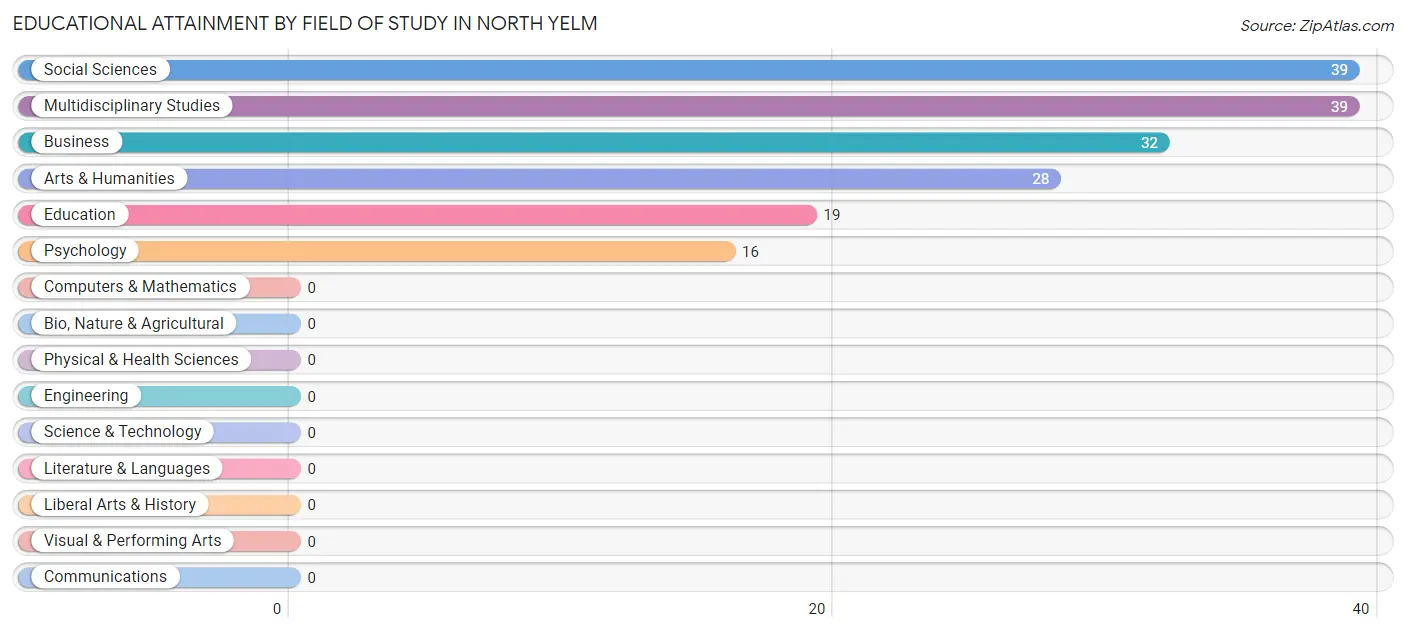
| Field of Study | # Graduates | % Graduates |
| Computers & Mathematics | 0 | 0.0% |
| Bio, Nature & Agricultural | 0 | 0.0% |
| Physical & Health Sciences | 0 | 0.0% |
| Psychology | 16 | 9.2% |
| Social Sciences | 39 | 22.5% |
| Engineering | 0 | 0.0% |
| Multidisciplinary Studies | 39 | 22.5% |
| Science & Technology | 0 | 0.0% |
| Business | 32 | 18.5% |
| Education | 19 | 11.0% |
| Literature & Languages | 0 | 0.0% |
| Liberal Arts & History | 0 | 0.0% |
| Visual & Performing Arts | 0 | 0.0% |
| Communications | 0 | 0.0% |
| Arts & Humanities | 28 | 16.2% |
| Total | 173 | 100.0% |
Transportation & Commute in North Yelm
Vehicle Availability by Sex in North Yelm
The most prevalent vehicle ownership categories in North Yelm are males with 2 vehicles (354, accounting for 32.4%) and females with 2 vehicles (166, making up 64.2%).
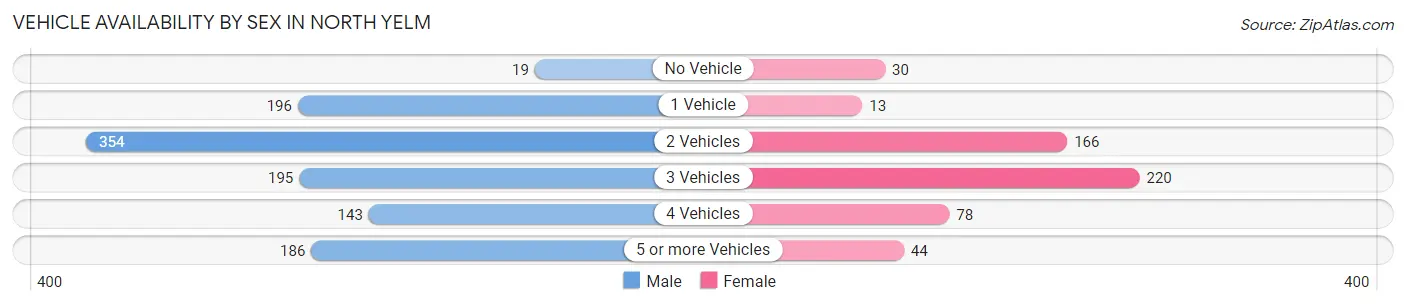
| Vehicles Available | Male | Female |
| No Vehicle | 19 (1.7%) | 30 (5.4%) |
| 1 Vehicle | 196 (17.9%) | 13 (2.4%) |
| 2 Vehicles | 354 (32.4%) | 166 (30.1%) |
| 3 Vehicles | 195 (17.8%) | 220 (39.9%) |
| 4 Vehicles | 143 (13.1%) | 78 (14.2%) |
| 5 or more Vehicles | 186 (17.0%) | 44 (8.0%) |
| Total | 1,093 (100.0%) | 551 (100.0%) |
Commute Time in North Yelm
The most frequently occuring commute durations in North Yelm are 60 to 89 minutes (280 commuters, 18.1%), 5 to 9 minutes (256 commuters, 16.6%), and 45 to 59 minutes (248 commuters, 16.0%).
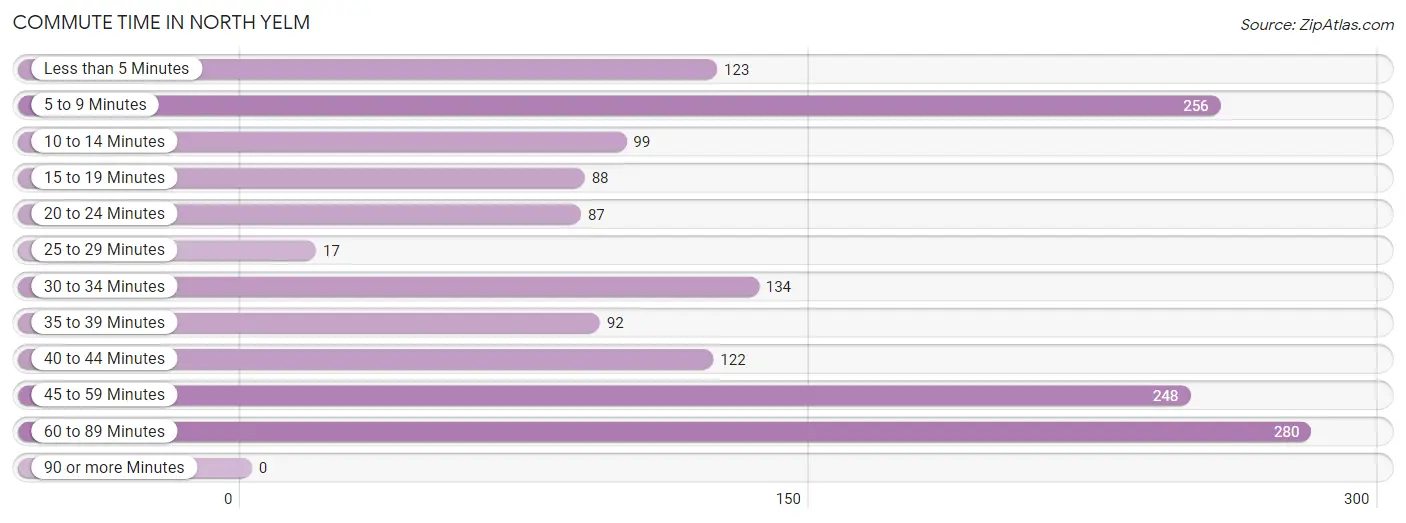
| Commute Time | # Commuters | % Commuters |
| Less than 5 Minutes | 123 | 8.0% |
| 5 to 9 Minutes | 256 | 16.6% |
| 10 to 14 Minutes | 99 | 6.4% |
| 15 to 19 Minutes | 88 | 5.7% |
| 20 to 24 Minutes | 87 | 5.6% |
| 25 to 29 Minutes | 17 | 1.1% |
| 30 to 34 Minutes | 134 | 8.7% |
| 35 to 39 Minutes | 92 | 5.9% |
| 40 to 44 Minutes | 122 | 7.9% |
| 45 to 59 Minutes | 248 | 16.0% |
| 60 to 89 Minutes | 280 | 18.1% |
| 90 or more Minutes | 0 | 0.0% |
Commute Time by Sex in North Yelm
The most common commute times in North Yelm are 60 to 89 minutes (280 commuters, 27.6%) for males and 5 to 9 minutes (154 commuters, 28.9%) for females.
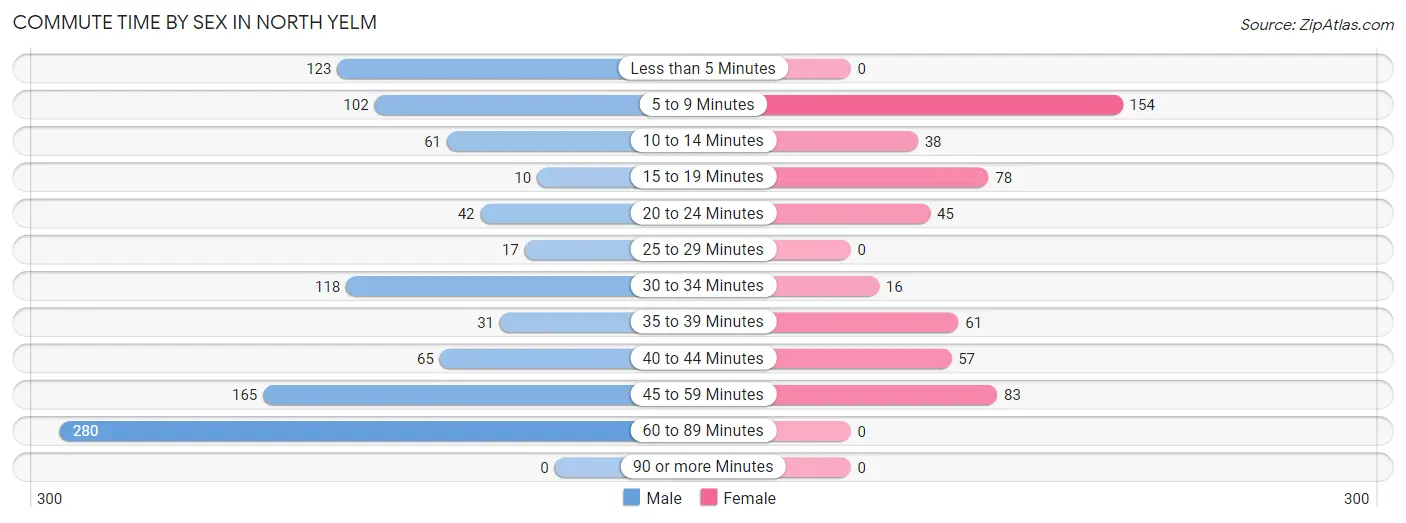
| Commute Time | Male | Female |
| Less than 5 Minutes | 123 (12.1%) | 0 (0.0%) |
| 5 to 9 Minutes | 102 (10.1%) | 154 (28.9%) |
| 10 to 14 Minutes | 61 (6.0%) | 38 (7.1%) |
| 15 to 19 Minutes | 10 (1.0%) | 78 (14.7%) |
| 20 to 24 Minutes | 42 (4.1%) | 45 (8.5%) |
| 25 to 29 Minutes | 17 (1.7%) | 0 (0.0%) |
| 30 to 34 Minutes | 118 (11.6%) | 16 (3.0%) |
| 35 to 39 Minutes | 31 (3.1%) | 61 (11.5%) |
| 40 to 44 Minutes | 65 (6.4%) | 57 (10.7%) |
| 45 to 59 Minutes | 165 (16.3%) | 83 (15.6%) |
| 60 to 89 Minutes | 280 (27.6%) | 0 (0.0%) |
| 90 or more Minutes | 0 (0.0%) | 0 (0.0%) |
Time of Departure to Work by Sex in North Yelm
The most frequent times of departure to work in North Yelm are 5:00 AM to 5:29 AM (241, 23.8%) for males and 5:00 AM to 5:29 AM (86, 16.2%) for females.
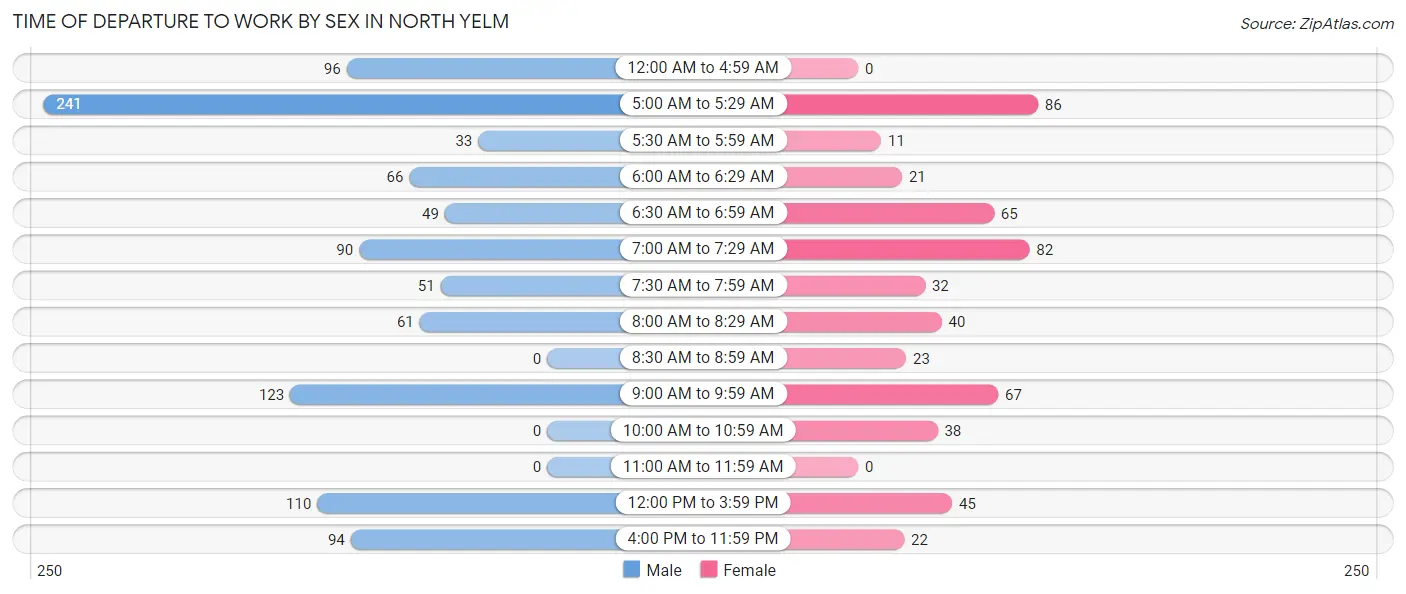
| Time of Departure | Male | Female |
| 12:00 AM to 4:59 AM | 96 (9.5%) | 0 (0.0%) |
| 5:00 AM to 5:29 AM | 241 (23.8%) | 86 (16.2%) |
| 5:30 AM to 5:59 AM | 33 (3.3%) | 11 (2.1%) |
| 6:00 AM to 6:29 AM | 66 (6.5%) | 21 (4.0%) |
| 6:30 AM to 6:59 AM | 49 (4.8%) | 65 (12.2%) |
| 7:00 AM to 7:29 AM | 90 (8.9%) | 82 (15.4%) |
| 7:30 AM to 7:59 AM | 51 (5.0%) | 32 (6.0%) |
| 8:00 AM to 8:29 AM | 61 (6.0%) | 40 (7.5%) |
| 8:30 AM to 8:59 AM | 0 (0.0%) | 23 (4.3%) |
| 9:00 AM to 9:59 AM | 123 (12.1%) | 67 (12.6%) |
| 10:00 AM to 10:59 AM | 0 (0.0%) | 38 (7.1%) |
| 11:00 AM to 11:59 AM | 0 (0.0%) | 0 (0.0%) |
| 12:00 PM to 3:59 PM | 110 (10.8%) | 45 (8.5%) |
| 4:00 PM to 11:59 PM | 94 (9.3%) | 22 (4.1%) |
| Total | 1,014 (100.0%) | 532 (100.0%) |
Housing Occupancy in North Yelm
Occupancy by Ownership in North Yelm
Of the total 1,157 dwellings in North Yelm, owner-occupied units account for 912 (78.8%), while renter-occupied units make up 245 (21.2%).
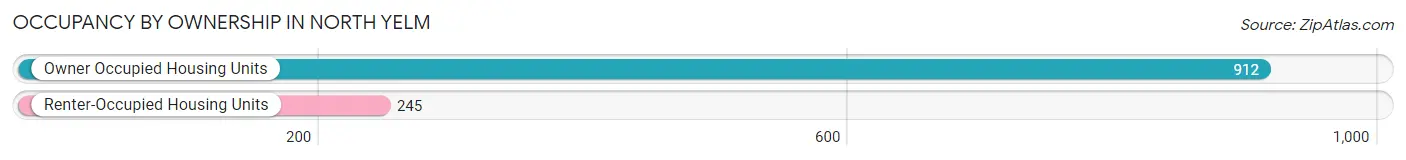
| Occupancy | # Housing Units | % Housing Units |
| Owner Occupied Housing Units | 912 | 78.8% |
| Renter-Occupied Housing Units | 245 | 21.2% |
| Total Occupied Housing Units | 1,157 | 100.0% |
Occupancy by Household Size in North Yelm
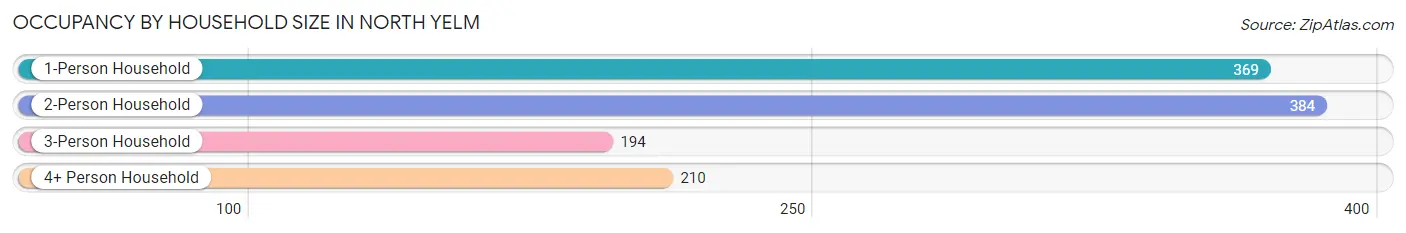
| Household Size | # Housing Units | % Housing Units |
| 1-Person Household | 369 | 31.9% |
| 2-Person Household | 384 | 33.2% |
| 3-Person Household | 194 | 16.8% |
| 4+ Person Household | 210 | 18.1% |
| Total Housing Units | 1,157 | 100.0% |
Occupancy by Ownership by Household Size in North Yelm
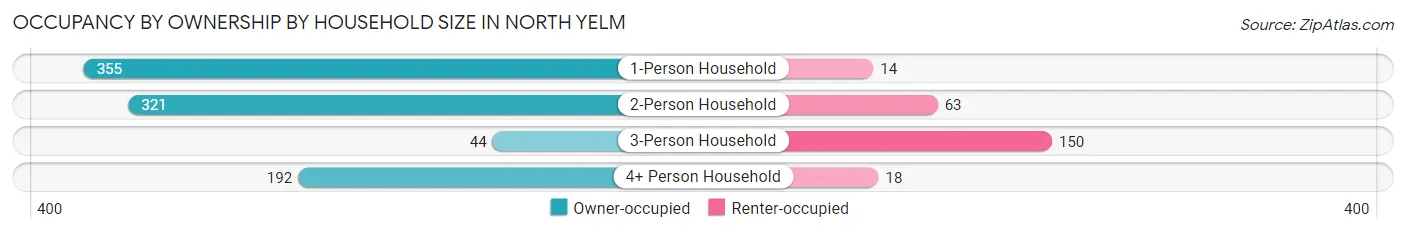
| Household Size | Owner-occupied | Renter-occupied |
| 1-Person Household | 355 (96.2%) | 14 (3.8%) |
| 2-Person Household | 321 (83.6%) | 63 (16.4%) |
| 3-Person Household | 44 (22.7%) | 150 (77.3%) |
| 4+ Person Household | 192 (91.4%) | 18 (8.6%) |
| Total Housing Units | 912 (78.8%) | 245 (21.2%) |
Occupancy by Educational Attainment in North Yelm
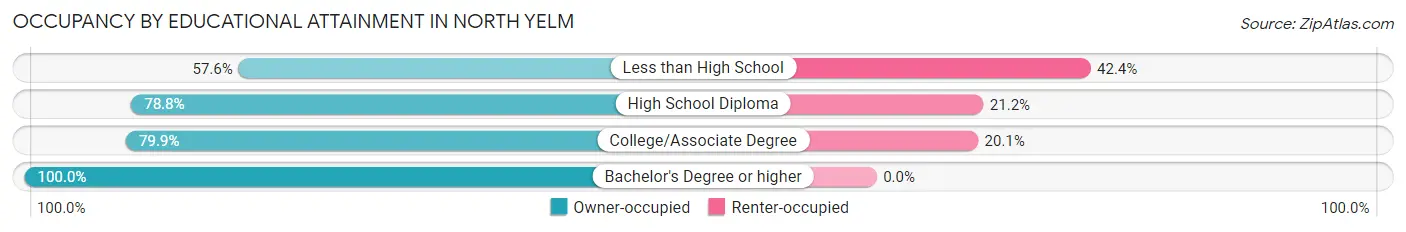
| Household Size | Owner-occupied | Renter-occupied |
| Less than High School | 57 (57.6%) | 42 (42.4%) |
| High School Diploma | 477 (78.8%) | 128 (21.2%) |
| College/Associate Degree | 298 (79.9%) | 75 (20.1%) |
| Bachelor's Degree or higher | 80 (100.0%) | 0 (0.0%) |
Occupancy by Age of Householder in North Yelm
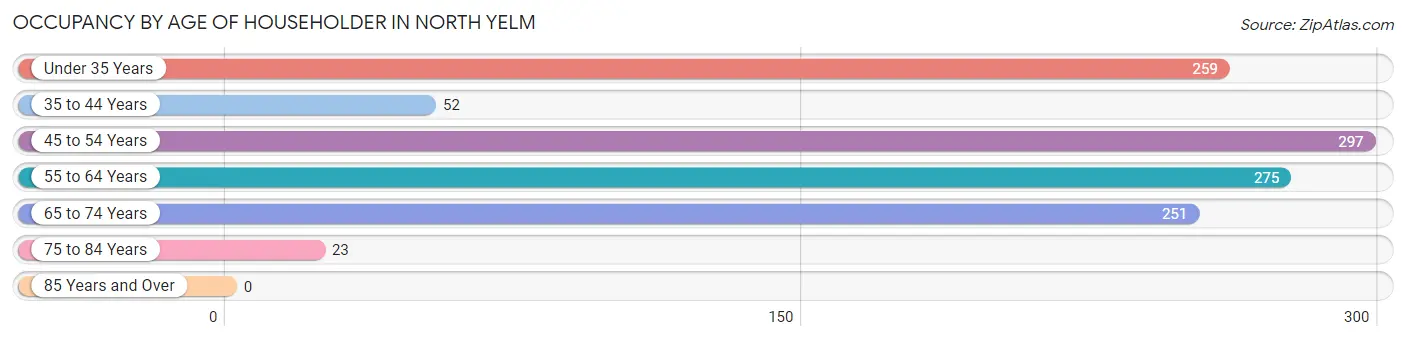
| Age Bracket | # Households | % Households |
| Under 35 Years | 259 | 22.4% |
| 35 to 44 Years | 52 | 4.5% |
| 45 to 54 Years | 297 | 25.7% |
| 55 to 64 Years | 275 | 23.8% |
| 65 to 74 Years | 251 | 21.7% |
| 75 to 84 Years | 23 | 2.0% |
| 85 Years and Over | 0 | 0.0% |
| Total | 1,157 | 100.0% |
Housing Finances in North Yelm
Median Income by Occupancy in North Yelm
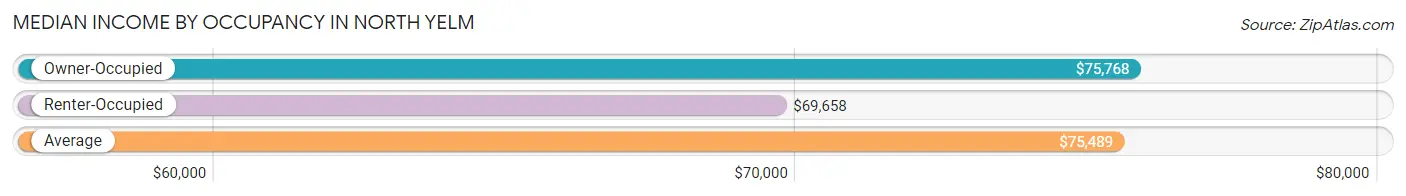
| Occupancy Type | # Households | Median Income |
| Owner-Occupied | 912 (78.8%) | $75,768 |
| Renter-Occupied | 245 (21.2%) | $69,658 |
| Average | 1,157 (100.0%) | $75,489 |
Occupancy by Householder Income Bracket in North Yelm
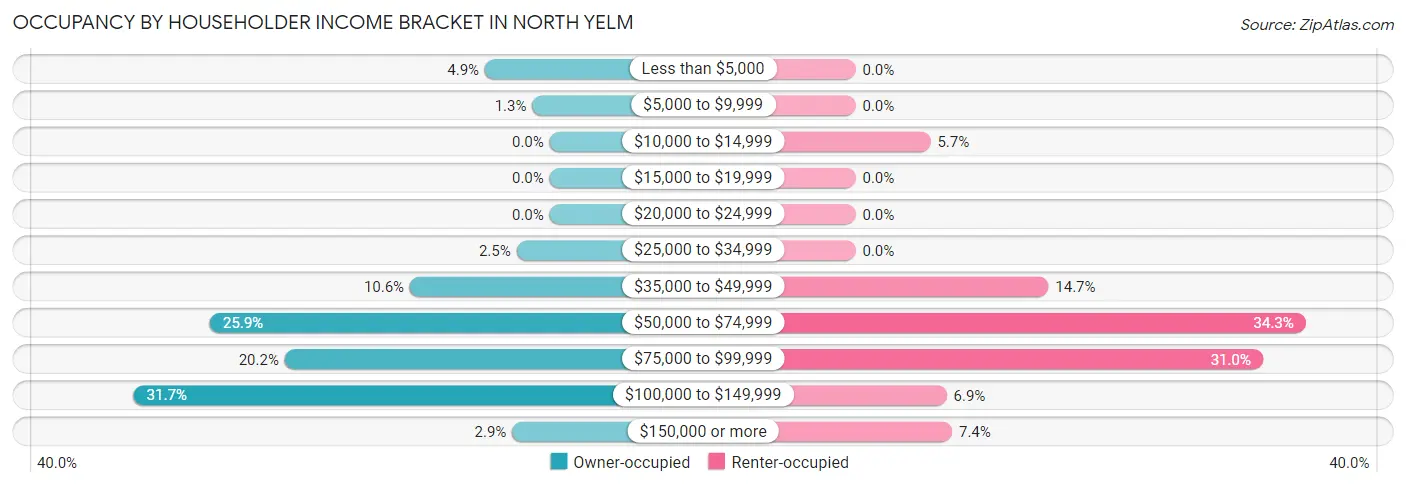
| Income Bracket | Owner-occupied | Renter-occupied |
| Less than $5,000 | 45 (4.9%) | 0 (0.0%) |
| $5,000 to $9,999 | 12 (1.3%) | 0 (0.0%) |
| $10,000 to $14,999 | 0 (0.0%) | 14 (5.7%) |
| $15,000 to $19,999 | 0 (0.0%) | 0 (0.0%) |
| $20,000 to $24,999 | 0 (0.0%) | 0 (0.0%) |
| $25,000 to $34,999 | 23 (2.5%) | 0 (0.0%) |
| $35,000 to $49,999 | 97 (10.6%) | 36 (14.7%) |
| $50,000 to $74,999 | 236 (25.9%) | 84 (34.3%) |
| $75,000 to $99,999 | 184 (20.2%) | 76 (31.0%) |
| $100,000 to $149,999 | 289 (31.7%) | 17 (6.9%) |
| $150,000 or more | 26 (2.9%) | 18 (7.3%) |
| Total | 912 (100.0%) | 245 (100.0%) |
Monthly Housing Cost Tiers in North Yelm
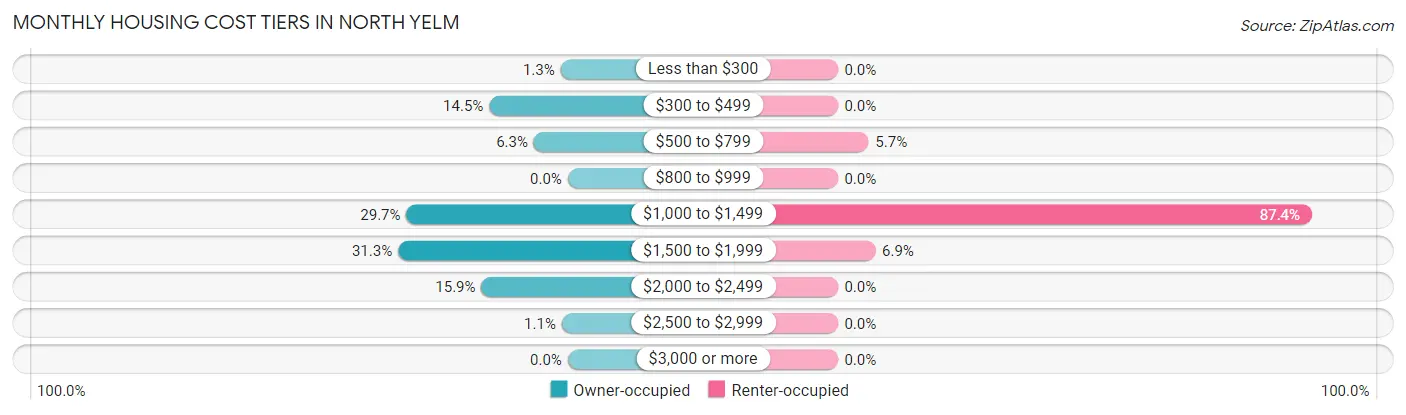
| Monthly Cost | Owner-occupied | Renter-occupied |
| Less than $300 | 12 (1.3%) | 0 (0.0%) |
| $300 to $499 | 132 (14.5%) | 0 (0.0%) |
| $500 to $799 | 57 (6.2%) | 14 (5.7%) |
| $800 to $999 | 0 (0.0%) | 0 (0.0%) |
| $1,000 to $1,499 | 271 (29.7%) | 214 (87.4%) |
| $1,500 to $1,999 | 285 (31.2%) | 17 (6.9%) |
| $2,000 to $2,499 | 145 (15.9%) | 0 (0.0%) |
| $2,500 to $2,999 | 10 (1.1%) | 0 (0.0%) |
| $3,000 or more | 0 (0.0%) | 0 (0.0%) |
| Total | 912 (100.0%) | 245 (100.0%) |
Physical Housing Characteristics in North Yelm
Housing Structures in North Yelm
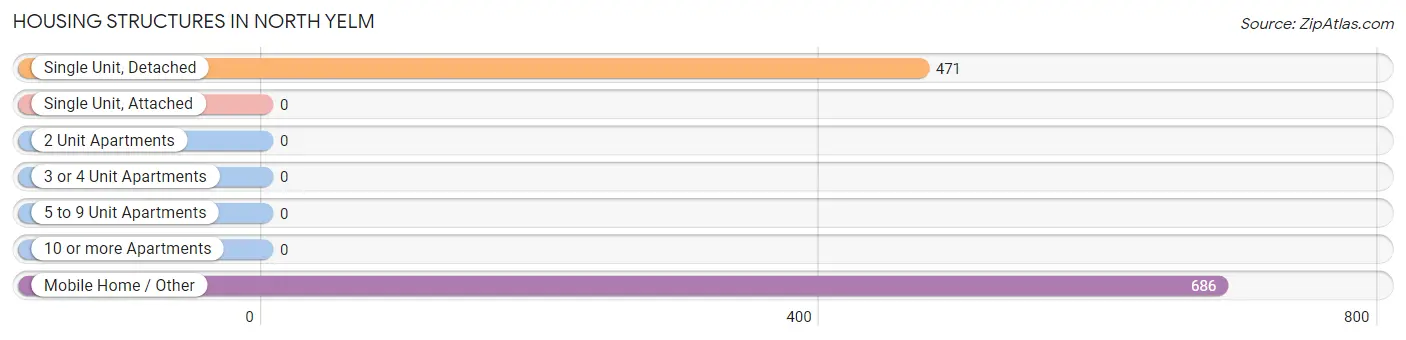
| Structure Type | # Housing Units | % Housing Units |
| Single Unit, Detached | 471 | 40.7% |
| Single Unit, Attached | 0 | 0.0% |
| 2 Unit Apartments | 0 | 0.0% |
| 3 or 4 Unit Apartments | 0 | 0.0% |
| 5 to 9 Unit Apartments | 0 | 0.0% |
| 10 or more Apartments | 0 | 0.0% |
| Mobile Home / Other | 686 | 59.3% |
| Total | 1,157 | 100.0% |
Housing Structures by Occupancy in North Yelm
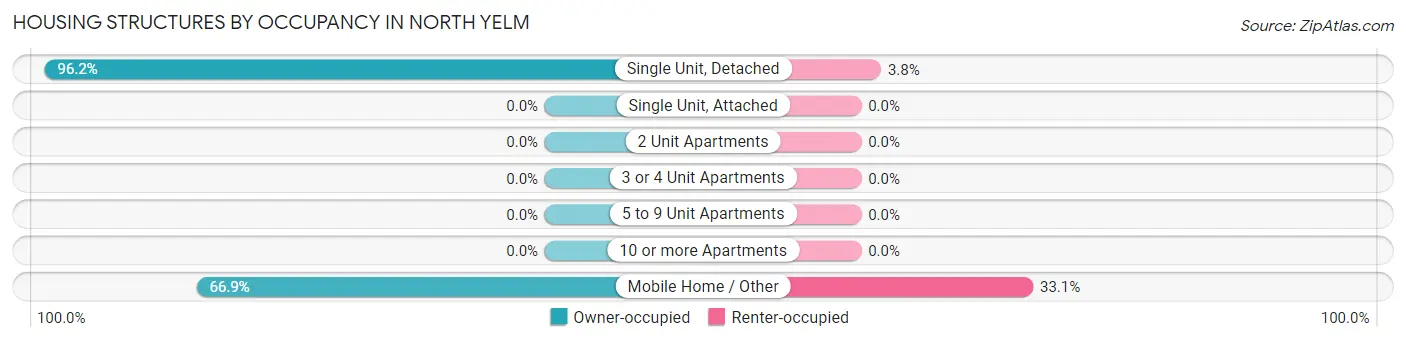
| Structure Type | Owner-occupied | Renter-occupied |
| Single Unit, Detached | 453 (96.2%) | 18 (3.8%) |
| Single Unit, Attached | 0 (0.0%) | 0 (0.0%) |
| 2 Unit Apartments | 0 (0.0%) | 0 (0.0%) |
| 3 or 4 Unit Apartments | 0 (0.0%) | 0 (0.0%) |
| 5 to 9 Unit Apartments | 0 (0.0%) | 0 (0.0%) |
| 10 or more Apartments | 0 (0.0%) | 0 (0.0%) |
| Mobile Home / Other | 459 (66.9%) | 227 (33.1%) |
| Total | 912 (78.8%) | 245 (21.2%) |
Housing Structures by Number of Rooms in North Yelm
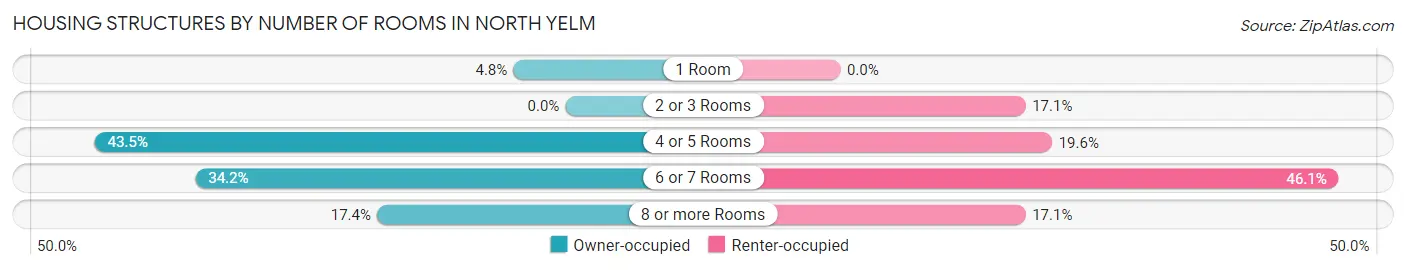
| Number of Rooms | Owner-occupied | Renter-occupied |
| 1 Room | 44 (4.8%) | 0 (0.0%) |
| 2 or 3 Rooms | 0 (0.0%) | 42 (17.1%) |
| 4 or 5 Rooms | 397 (43.5%) | 48 (19.6%) |
| 6 or 7 Rooms | 312 (34.2%) | 113 (46.1%) |
| 8 or more Rooms | 159 (17.4%) | 42 (17.1%) |
| Total | 912 (100.0%) | 245 (100.0%) |
Housing Structure by Heating Type in North Yelm
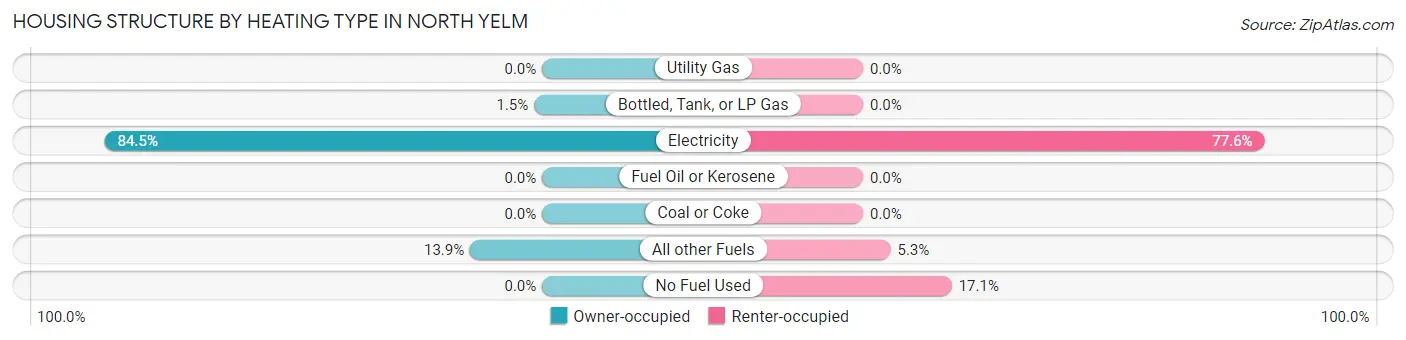
| Heating Type | Owner-occupied | Renter-occupied |
| Utility Gas | 0 (0.0%) | 0 (0.0%) |
| Bottled, Tank, or LP Gas | 14 (1.5%) | 0 (0.0%) |
| Electricity | 771 (84.5%) | 190 (77.5%) |
| Fuel Oil or Kerosene | 0 (0.0%) | 0 (0.0%) |
| Coal or Coke | 0 (0.0%) | 0 (0.0%) |
| All other Fuels | 127 (13.9%) | 13 (5.3%) |
| No Fuel Used | 0 (0.0%) | 42 (17.1%) |
| Total | 912 (100.0%) | 245 (100.0%) |
Household Vehicle Usage in North Yelm
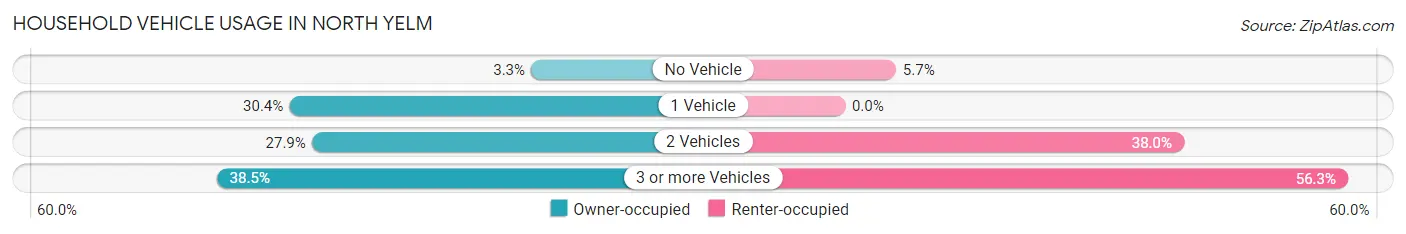
| Vehicles per Household | Owner-occupied | Renter-occupied |
| No Vehicle | 30 (3.3%) | 14 (5.7%) |
| 1 Vehicle | 277 (30.4%) | 0 (0.0%) |
| 2 Vehicles | 254 (27.9%) | 93 (38.0%) |
| 3 or more Vehicles | 351 (38.5%) | 138 (56.3%) |
| Total | 912 (100.0%) | 245 (100.0%) |
Real Estate & Mortgages in North Yelm
Real Estate and Mortgage Overview in North Yelm
| Characteristic | Without Mortgage | With Mortgage |
| Housing Units | 144 | 768 |
| Median Property Value | - | - |
| Median Household Income | - | - |
| Monthly Housing Costs | $439 | $0 |
| Real Estate Taxes | - | - |
Property Value by Mortgage Status in North Yelm
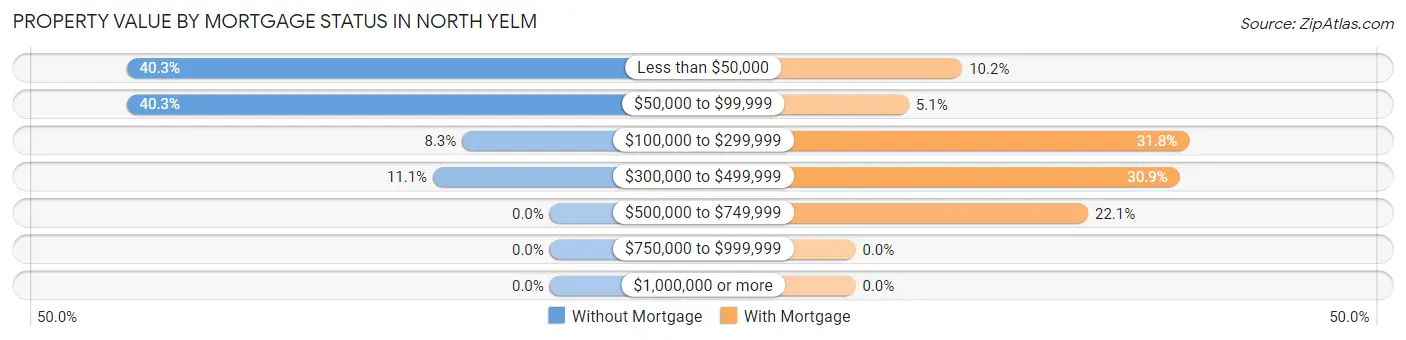
| Property Value | Without Mortgage | With Mortgage |
| Less than $50,000 | 58 (40.3%) | 78 (10.2%) |
| $50,000 to $99,999 | 58 (40.3%) | 39 (5.1%) |
| $100,000 to $299,999 | 12 (8.3%) | 244 (31.8%) |
| $300,000 to $499,999 | 16 (11.1%) | 237 (30.9%) |
| $500,000 to $749,999 | 0 (0.0%) | 170 (22.1%) |
| $750,000 to $999,999 | 0 (0.0%) | 0 (0.0%) |
| $1,000,000 or more | 0 (0.0%) | 0 (0.0%) |
| Total | 144 (100.0%) | 768 (100.0%) |
Household Income by Mortgage Status in North Yelm
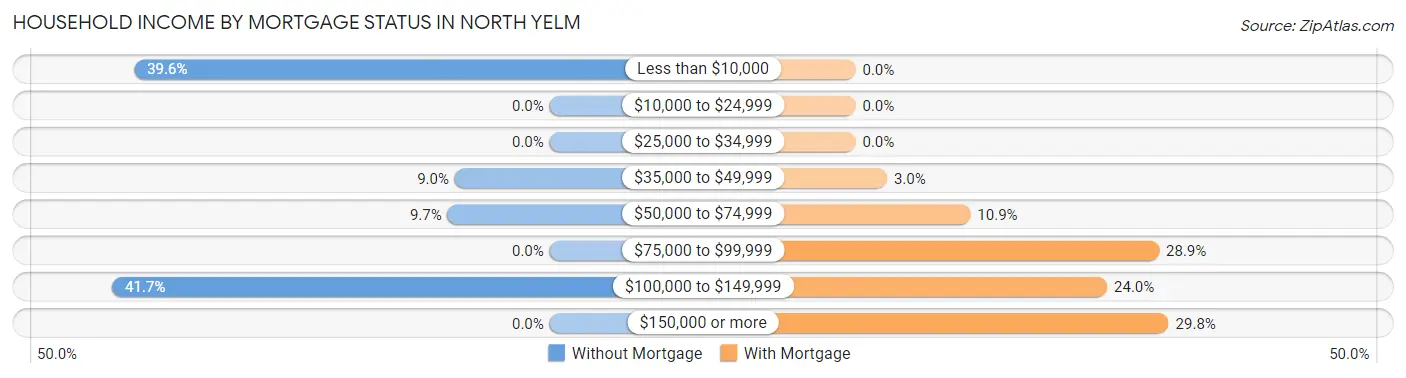
| Household Income | Without Mortgage | With Mortgage |
| Less than $10,000 | 57 (39.6%) | 0 (0.0%) |
| $10,000 to $24,999 | 0 (0.0%) | 0 (0.0%) |
| $25,000 to $34,999 | 0 (0.0%) | 0 (0.0%) |
| $35,000 to $49,999 | 13 (9.0%) | 23 (3.0%) |
| $50,000 to $74,999 | 14 (9.7%) | 84 (10.9%) |
| $75,000 to $99,999 | 0 (0.0%) | 222 (28.9%) |
| $100,000 to $149,999 | 60 (41.7%) | 184 (24.0%) |
| $150,000 or more | 0 (0.0%) | 229 (29.8%) |
| Total | 144 (100.0%) | 768 (100.0%) |
Property Value to Household Income Ratio in North Yelm
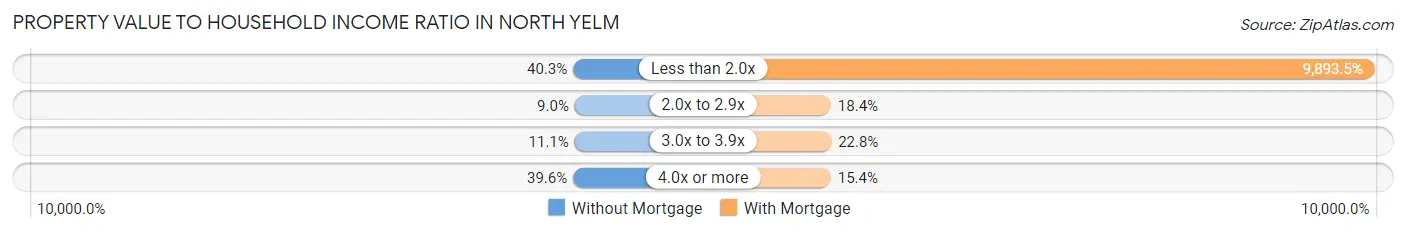
| Value-to-Income Ratio | Without Mortgage | With Mortgage |
| Less than 2.0x | 58 (40.3%) | 75,982 (9,893.5%) |
| 2.0x to 2.9x | 13 (9.0%) | 141 (18.4%) |
| 3.0x to 3.9x | 16 (11.1%) | 175 (22.8%) |
| 4.0x or more | 57 (39.6%) | 118 (15.4%) |
| Total | 144 (100.0%) | 768 (100.0%) |
Real Estate Taxes by Mortgage Status in North Yelm
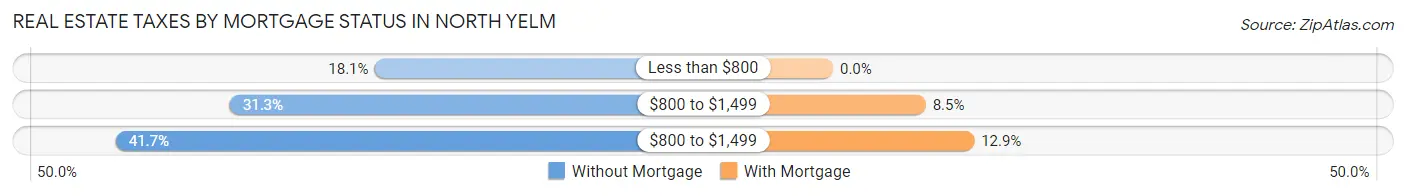
| Property Taxes | Without Mortgage | With Mortgage |
| Less than $800 | 26 (18.1%) | 0 (0.0%) |
| $800 to $1,499 | 45 (31.2%) | 65 (8.5%) |
| $800 to $1,499 | 60 (41.7%) | 99 (12.9%) |
| Total | 144 (100.0%) | 768 (100.0%) |
Health & Disability in North Yelm
Health Insurance Coverage by Age in North Yelm
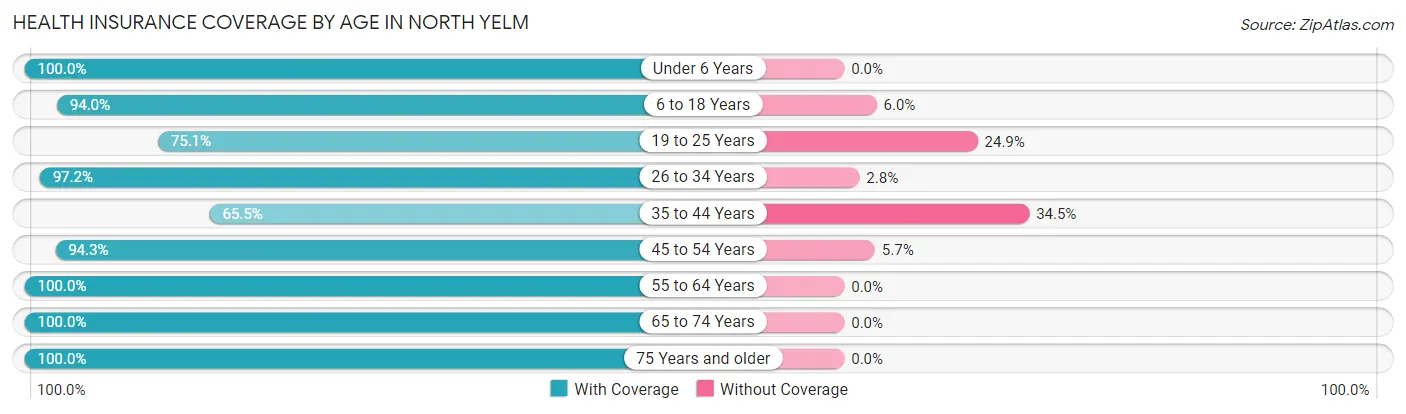
| Age Bracket | With Coverage | Without Coverage |
| Under 6 Years | 59 (100.0%) | 0 (0.0%) |
| 6 to 18 Years | 312 (94.0%) | 20 (6.0%) |
| 19 to 25 Years | 260 (75.1%) | 86 (24.9%) |
| 26 to 34 Years | 552 (97.2%) | 16 (2.8%) |
| 35 to 44 Years | 95 (65.5%) | 50 (34.5%) |
| 45 to 54 Years | 495 (94.3%) | 30 (5.7%) |
| 55 to 64 Years | 428 (100.0%) | 0 (0.0%) |
| 65 to 74 Years | 359 (100.0%) | 0 (0.0%) |
| 75 Years and older | 23 (100.0%) | 0 (0.0%) |
| Total | 2,583 (92.7%) | 202 (7.2%) |
Health Insurance Coverage by Citizenship Status in North Yelm
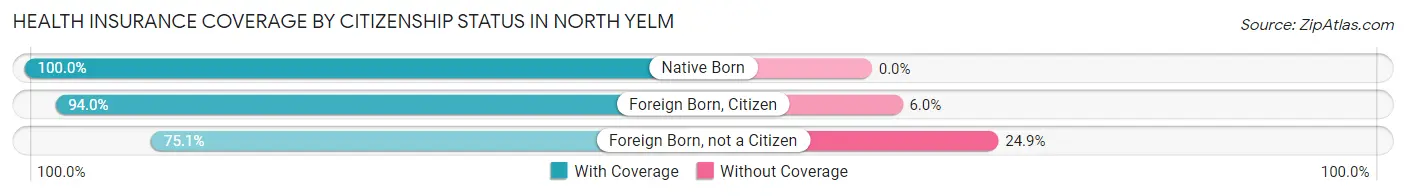
| Citizenship Status | With Coverage | Without Coverage |
| Native Born | 59 (100.0%) | 0 (0.0%) |
| Foreign Born, Citizen | 312 (94.0%) | 20 (6.0%) |
| Foreign Born, not a Citizen | 260 (75.1%) | 86 (24.9%) |
Health Insurance Coverage by Household Income in North Yelm
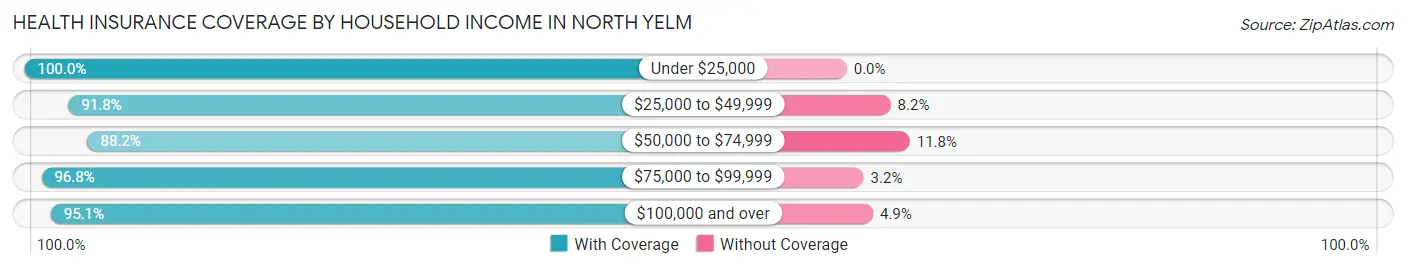
| Household Income | With Coverage | Without Coverage |
| Under $25,000 | 71 (100.0%) | 0 (0.0%) |
| $25,000 to $49,999 | 335 (91.8%) | 30 (8.2%) |
| $50,000 to $74,999 | 836 (88.2%) | 112 (11.8%) |
| $75,000 to $99,999 | 491 (96.8%) | 16 (3.2%) |
| $100,000 and over | 850 (95.1%) | 44 (4.9%) |
Public vs Private Health Insurance Coverage by Age in North Yelm
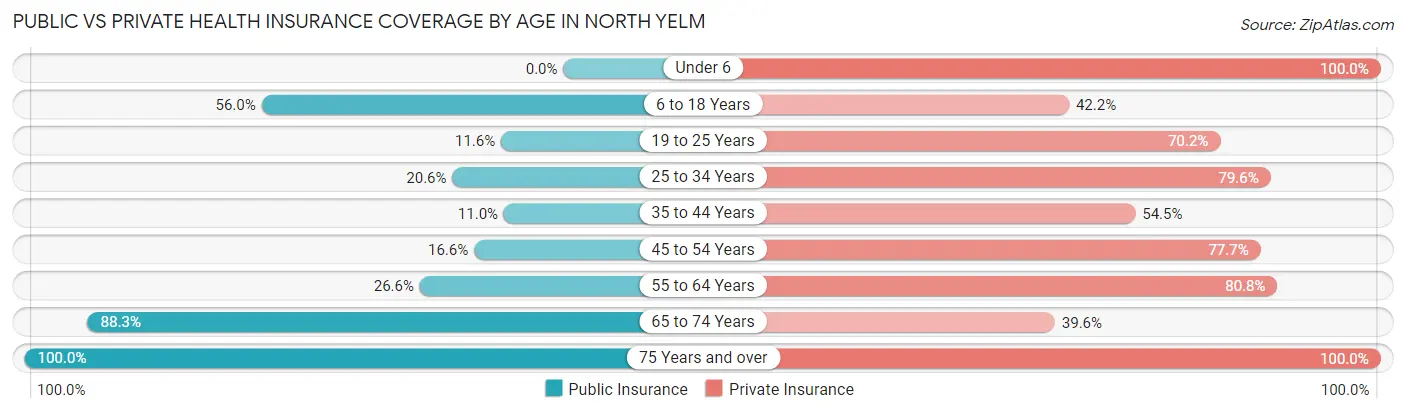
| Age Bracket | Public Insurance | Private Insurance |
| Under 6 | 0 (0.0%) | 59 (100.0%) |
| 6 to 18 Years | 186 (56.0%) | 140 (42.2%) |
| 19 to 25 Years | 40 (11.6%) | 243 (70.2%) |
| 25 to 34 Years | 117 (20.6%) | 452 (79.6%) |
| 35 to 44 Years | 16 (11.0%) | 79 (54.5%) |
| 45 to 54 Years | 87 (16.6%) | 408 (77.7%) |
| 55 to 64 Years | 114 (26.6%) | 346 (80.8%) |
| 65 to 74 Years | 317 (88.3%) | 142 (39.6%) |
| 75 Years and over | 23 (100.0%) | 23 (100.0%) |
| Total | 900 (32.3%) | 1,892 (67.9%) |
Disability Status by Sex by Age in North Yelm
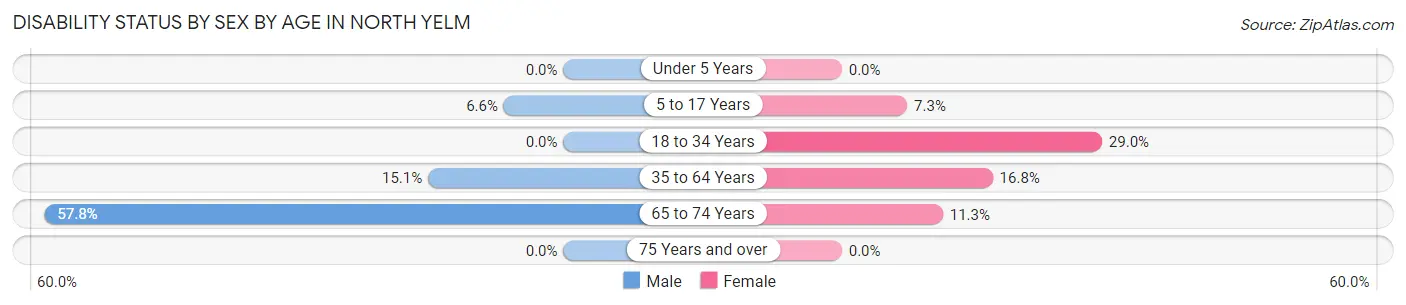
| Age Bracket | Male | Female |
| Under 5 Years | 0 (0.0%) | 0 (0.0%) |
| 5 to 17 Years | 12 (6.6%) | 11 (7.3%) |
| 18 to 34 Years | 0 (0.0%) | 104 (29.0%) |
| 35 to 64 Years | 91 (15.1%) | 83 (16.8%) |
| 65 to 74 Years | 115 (57.8%) | 18 (11.3%) |
| 75 Years and over | 0 (0.0%) | 0 (0.0%) |
Disability Class by Sex by Age in North Yelm
Disability Class: Hearing Difficulty
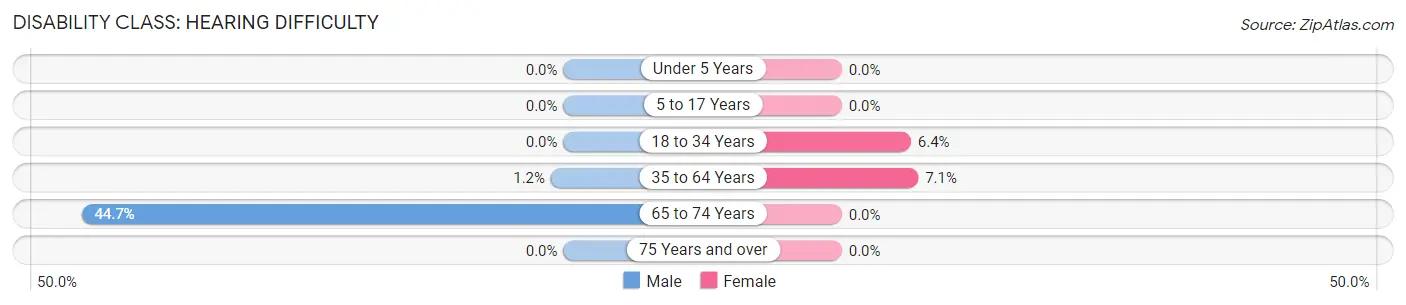
| Age Bracket | Male | Female |
| Under 5 Years | 0 (0.0%) | 0 (0.0%) |
| 5 to 17 Years | 0 (0.0%) | 0 (0.0%) |
| 18 to 34 Years | 0 (0.0%) | 23 (6.4%) |
| 35 to 64 Years | 7 (1.2%) | 35 (7.1%) |
| 65 to 74 Years | 89 (44.7%) | 0 (0.0%) |
| 75 Years and over | 0 (0.0%) | 0 (0.0%) |
Disability Class: Vision Difficulty
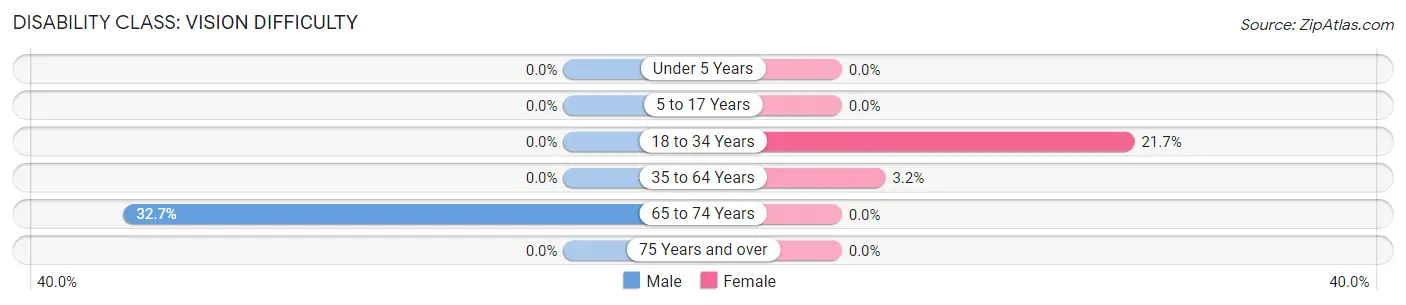
| Age Bracket | Male | Female |
| Under 5 Years | 0 (0.0%) | 0 (0.0%) |
| 5 to 17 Years | 0 (0.0%) | 0 (0.0%) |
| 18 to 34 Years | 0 (0.0%) | 78 (21.7%) |
| 35 to 64 Years | 0 (0.0%) | 16 (3.2%) |
| 65 to 74 Years | 65 (32.7%) | 0 (0.0%) |
| 75 Years and over | 0 (0.0%) | 0 (0.0%) |
Disability Class: Cognitive Difficulty
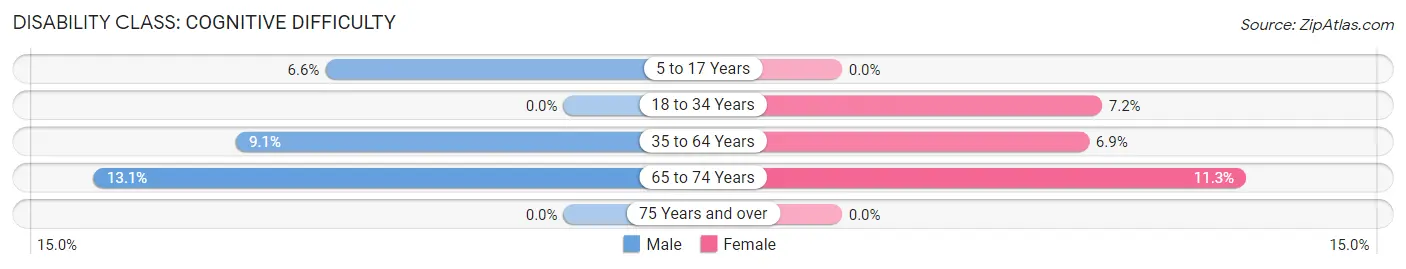
| Age Bracket | Male | Female |
| 5 to 17 Years | 12 (6.6%) | 0 (0.0%) |
| 18 to 34 Years | 0 (0.0%) | 26 (7.2%) |
| 35 to 64 Years | 55 (9.1%) | 34 (6.9%) |
| 65 to 74 Years | 26 (13.1%) | 18 (11.3%) |
| 75 Years and over | 0 (0.0%) | 0 (0.0%) |
Disability Class: Ambulatory Difficulty
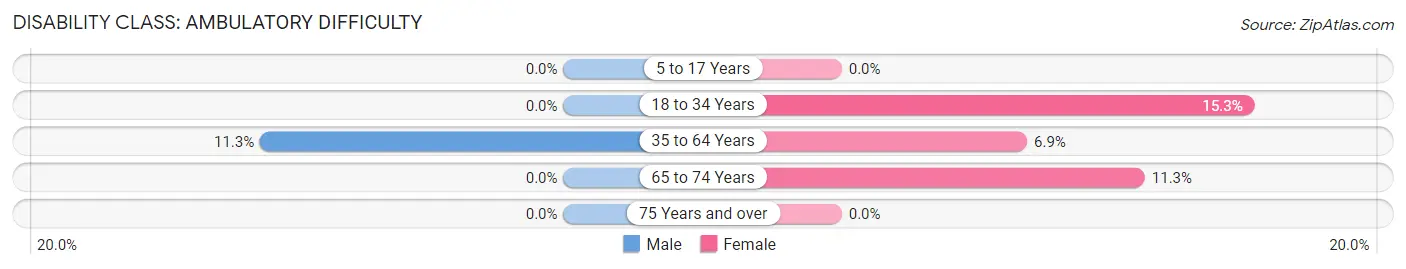
| Age Bracket | Male | Female |
| 5 to 17 Years | 0 (0.0%) | 0 (0.0%) |
| 18 to 34 Years | 0 (0.0%) | 55 (15.3%) |
| 35 to 64 Years | 68 (11.3%) | 34 (6.9%) |
| 65 to 74 Years | 0 (0.0%) | 18 (11.3%) |
| 75 Years and over | 0 (0.0%) | 0 (0.0%) |
Disability Class: Self-Care Difficulty
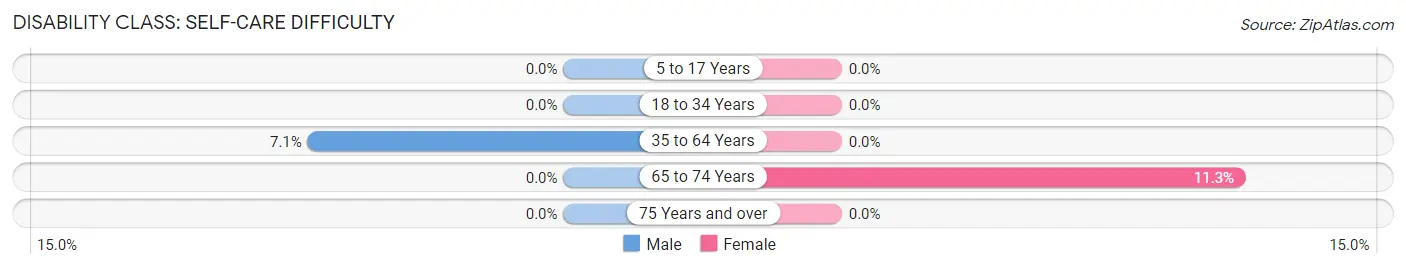
| Age Bracket | Male | Female |
| 5 to 17 Years | 0 (0.0%) | 0 (0.0%) |
| 18 to 34 Years | 0 (0.0%) | 0 (0.0%) |
| 35 to 64 Years | 43 (7.1%) | 0 (0.0%) |
| 65 to 74 Years | 0 (0.0%) | 18 (11.3%) |
| 75 Years and over | 0 (0.0%) | 0 (0.0%) |
Technology Access in North Yelm
Computing Device Access in North Yelm
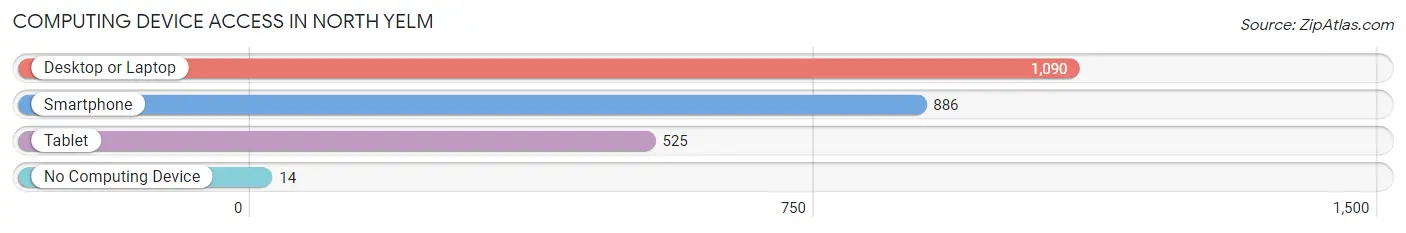
| Device Type | # Households | % Households |
| Desktop or Laptop | 1,090 | 94.2% |
| Smartphone | 886 | 76.6% |
| Tablet | 525 | 45.4% |
| No Computing Device | 14 | 1.2% |
| Total | 1,157 | 100.0% |
Internet Access in North Yelm
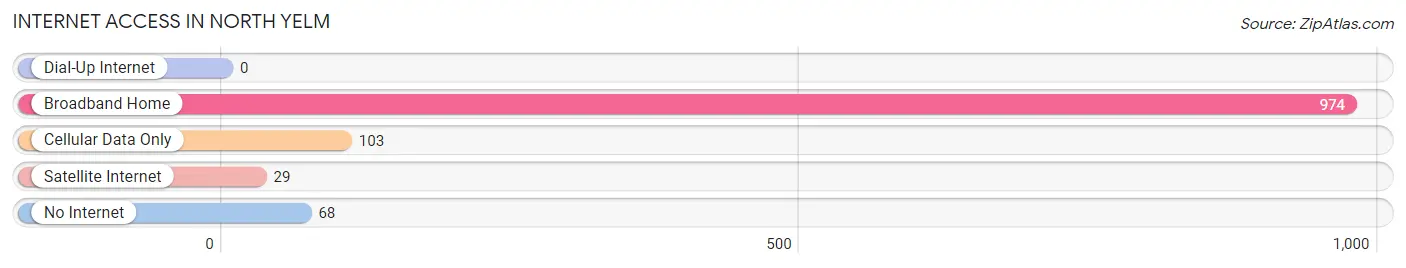
| Internet Type | # Households | % Households |
| Dial-Up Internet | 0 | 0.0% |
| Broadband Home | 974 | 84.2% |
| Cellular Data Only | 103 | 8.9% |
| Satellite Internet | 29 | 2.5% |
| No Internet | 68 | 5.9% |
| Total | 1,157 | 100.0% |
North Yelm Summary
Yelm is a small city located in Thurston County, Washington, United States. It is located approximately 25 miles southeast of Olympia, the state capital. The population was 6,848 at the 2010 census.
History
The area that is now Yelm was first inhabited by the Nisqually and Squaxin Island tribes. The first non-native settlers arrived in the area in the late 1850s. The town was originally known as "Yelm Prairie" and was officially incorporated in 1924.
The name "Yelm" is derived from the Nisqually word "yilm", which means "heat of the sun". The town was named after the nearby Yelm Prairie, which was named by early settlers who noticed the area was warmer than other nearby areas.
Geography
Yelm is located at 46°59'25"N 122°41'45"W (46.990278, -122.695833). According to the United States Census Bureau, the city has a total area of 4.3 square miles, all of it land.
Economy
Yelm is a small city with a diverse economy. The city is home to a variety of businesses, including retail stores, restaurants, and professional services. The city is also home to several industrial and manufacturing businesses, including a lumber mill and a concrete plant.
The city is also home to several agricultural businesses, including a dairy farm, a winery, and a Christmas tree farm. The city is also home to several recreational businesses, including a golf course, a bowling alley, and a movie theater.
Demographics
As of the 2010 census, there were 6,848 people, 2,717 households, and 1,845 families residing in the city. The population density was 1,588.3 people per square mile. The racial makeup of the city was 81.2% White, 0.7% African American, 1.3% Native American, 1.2% Asian, 0.2% Pacific Islander, 11.3% from other races, and 4.2% from two or more races. Hispanic or Latino of any race were 19.2% of the population.
There were 2,717 households, out of which 33.2% had children under the age of 18 living with them, 48.2% were married couples living together, 13.7% had a female householder with no husband present, and 32.2% were non-families. 25.7% of all households were made up of individuals, and 8.3% had someone living alone who was 65 years of age or older. The average household size was 2.51 and the average family size was 3.02.
In the city, the population was spread out, with 25.9% under the age of 18, 8.7% from 18 to 24, 28.2% from 25 to 44, 25.2% from 45 to 64, and 12.0% who were 65 years of age or older. The median age was 36 years. For every 100 females, there were 97.2 males. For every 100 females age 18 and over, there were 94.2 males.
The median income for a household in the city was $41,944, and the median income for a family was $50,944. Males had a median income of $41,944 versus $30,944 for females. The per capita income for the city was $20,944. About 10.2% of families and 13.2% of the population were below the poverty line, including 17.2% of those under age 18 and 8.2% of those age 65 or over.
Common Questions
What is Per Capita Income in North Yelm?
Per Capita income in North Yelm is $37,780.
What is the Median Family Income in North Yelm?
Median Family Income in North Yelm is $77,813.
What is the Median Household income in North Yelm?
Median Household Income in North Yelm is $75,489.
What is Income or Wage Gap in North Yelm?
Income or Wage Gap in North Yelm is 23.7%.
Women in North Yelm earn 76.3 cents for every dollar earned by a man.
What is Inequality or Gini Index in North Yelm?
Inequality or Gini Index in North Yelm is 0.31.
What is the Total Population of North Yelm?
Total Population of North Yelm is 2,785.
What is the Total Male Population of North Yelm?
Total Male Population of North Yelm is 1,575.
What is the Total Female Population of North Yelm?
Total Female Population of North Yelm is 1,210.
What is the Ratio of Males per 100 Females in North Yelm?
There are 130.17 Males per 100 Females in North Yelm.
What is the Ratio of Females per 100 Males in North Yelm?
There are 76.83 Females per 100 Males in North Yelm.
What is the Median Population Age in North Yelm?
Median Population Age in North Yelm is 36.8 Years.
What is the Average Family Size in North Yelm
Average Family Size in North Yelm is 3.0 People.
What is the Average Household Size in North Yelm
Average Household Size in North Yelm is 2.4 People.
How Large is the Labor Force in North Yelm?
There are 1,697 People in the Labor Forcein in North Yelm.
What is the Percentage of People in the Labor Force in North Yelm?
69.2% of People are in the Labor Force in North Yelm.
What is the Unemployment Rate in North Yelm?
Unemployment Rate in North Yelm is 2.2%.