Cities with the Lowest Unemployment Rate Amomg Youth Under the Age of 25 in Illinois
RELATED REPORTS & OPTIONS
Lowest Unemployment | Youth < 25
Illinois
Compare Cities
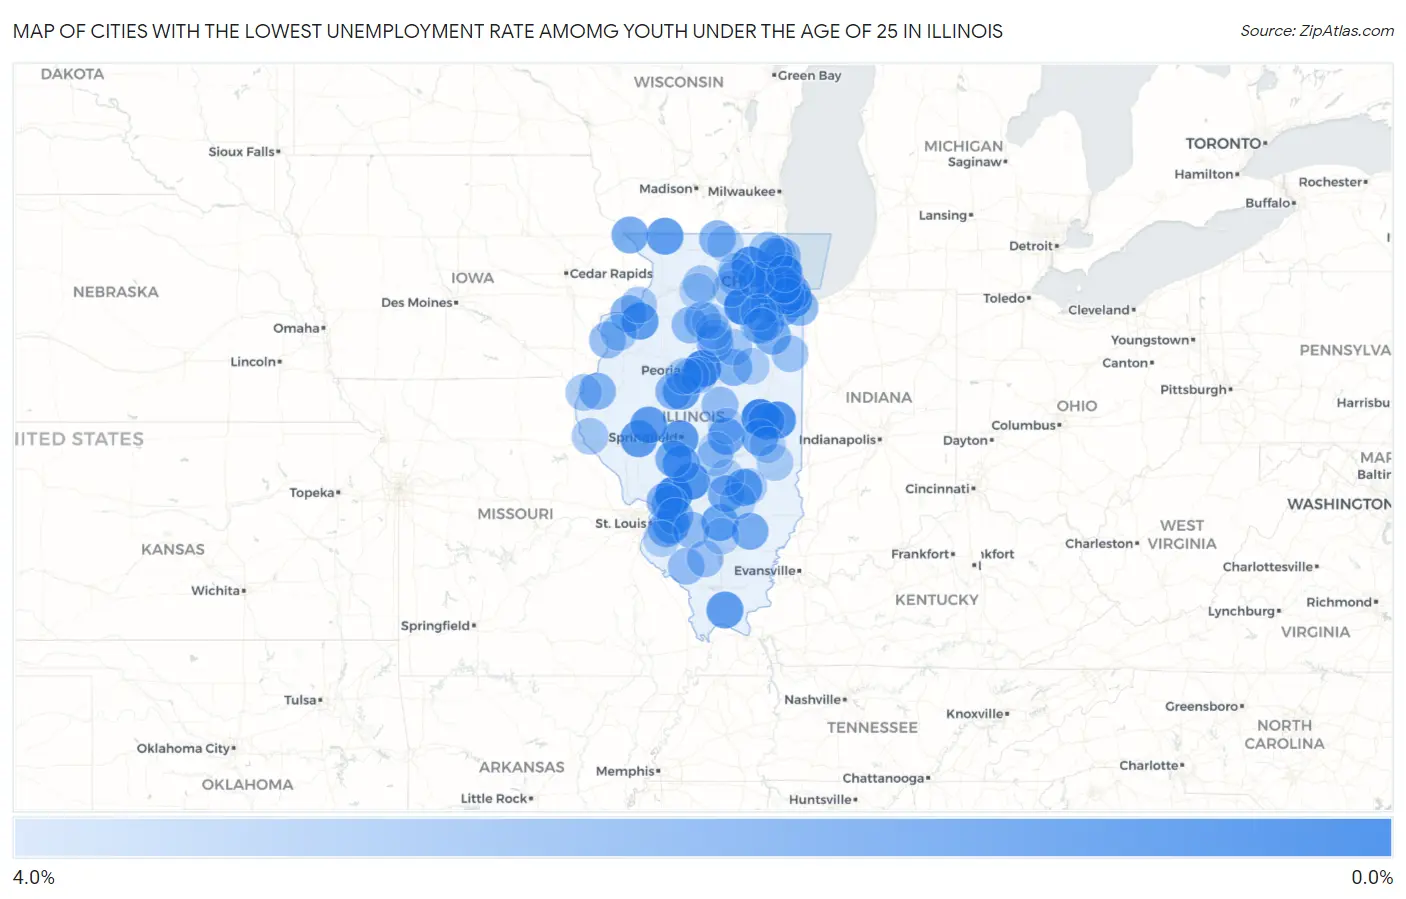
Map of Cities with the Lowest Unemployment Rate Amomg Youth Under the Age of 25 in Illinois
4.0%
0.0%
Cities with the Lowest Unemployment Rate Amomg Youth Under the Age of 25 in Illinois
| City | Youth Unemployment | vs State | vs National | |
| 1. | Darien | 0.60% | 12.2%(-11.6)#1 | 10.9%(-10.3)#50 |
| 2. | Savoy | 0.70% | 12.2%(-11.5)#2 | 10.9%(-10.2)#66 |
| 3. | Newark | 0.70% | 12.2%(-11.5)#3 | 10.9%(-10.2)#77 |
| 4. | Eureka | 0.80% | 12.2%(-11.4)#4 | 10.9%(-10.1)#90 |
| 5. | Staunton | 0.80% | 12.2%(-11.4)#5 | 10.9%(-10.1)#92 |
| 6. | Pingree Grove | 1.0% | 12.2%(-11.2)#6 | 10.9%(-9.90)#127 |
| 7. | Hillsboro | 1.2% | 12.2%(-11.0)#7 | 10.9%(-9.70)#174 |
| 8. | Rosemont | 1.2% | 12.2%(-11.0)#8 | 10.9%(-9.70)#177 |
| 9. | Homer | 1.2% | 12.2%(-11.0)#9 | 10.9%(-9.70)#183 |
| 10. | Dixmoor | 1.3% | 12.2%(-10.9)#10 | 10.9%(-9.60)#203 |
| 11. | Jerome | 1.5% | 12.2%(-10.7)#11 | 10.9%(-9.40)#263 |
| 12. | Orion | 1.6% | 12.2%(-10.6)#12 | 10.9%(-9.30)#290 |
| 13. | Green Valley | 1.6% | 12.2%(-10.6)#13 | 10.9%(-9.30)#298 |
| 14. | Chapin | 1.6% | 12.2%(-10.6)#14 | 10.9%(-9.30)#300 |
| 15. | Vienna | 1.7% | 12.2%(-10.5)#15 | 10.9%(-9.20)#334 |
| 16. | Virginia | 1.7% | 12.2%(-10.5)#16 | 10.9%(-9.20)#341 |
| 17. | Philo | 1.7% | 12.2%(-10.5)#17 | 10.9%(-9.20)#342 |
| 18. | Nora | 1.7% | 12.2%(-10.5)#18 | 10.9%(-9.20)#350 |
| 19. | Bloomingdale | 1.8% | 12.2%(-10.4)#19 | 10.9%(-9.10)#354 |
| 20. | Effingham | 1.8% | 12.2%(-10.4)#20 | 10.9%(-9.10)#359 |
| 21. | Farmersville | 1.8% | 12.2%(-10.4)#21 | 10.9%(-9.10)#398 |
| 22. | Lebanon | 1.9% | 12.2%(-10.3)#22 | 10.9%(-9.00)#417 |
| 23. | Salem | 2.0% | 12.2%(-10.2)#23 | 10.9%(-8.90)#450 |
| 24. | Stone Park | 2.0% | 12.2%(-10.2)#24 | 10.9%(-8.90)#457 |
| 25. | Long Creek | 2.0% | 12.2%(-10.2)#25 | 10.9%(-8.90)#475 |
| 26. | Lyons | 2.2% | 12.2%(-10.00)#26 | 10.9%(-8.70)#537 |
| 27. | Tuscola | 2.2% | 12.2%(-10.00)#27 | 10.9%(-8.70)#552 |
| 28. | Menominee | 2.2% | 12.2%(-10.00)#28 | 10.9%(-8.70)#577 |
| 29. | Mokena | 2.3% | 12.2%(-9.90)#29 | 10.9%(-8.60)#580 |
| 30. | Alsip | 2.3% | 12.2%(-9.90)#30 | 10.9%(-8.60)#581 |
| 31. | St Elmo | 2.3% | 12.2%(-9.90)#31 | 10.9%(-8.60)#622 |
| 32. | Cisne | 2.3% | 12.2%(-9.90)#32 | 10.9%(-8.60)#632 |
| 33. | Virden | 2.4% | 12.2%(-9.80)#33 | 10.9%(-8.50)#665 |
| 34. | Bonfield | 2.4% | 12.2%(-9.80)#34 | 10.9%(-8.50)#695 |
| 35. | Warrenville | 2.5% | 12.2%(-9.70)#35 | 10.9%(-8.40)#703 |
| 36. | Hamel | 2.5% | 12.2%(-9.70)#36 | 10.9%(-8.40)#747 |
| 37. | Shiloh | 2.6% | 12.2%(-9.60)#37 | 10.9%(-8.30)#765 |
| 38. | Milan | 2.6% | 12.2%(-9.60)#38 | 10.9%(-8.30)#783 |
| 39. | Roscoe | 2.7% | 12.2%(-9.50)#39 | 10.9%(-8.20)#832 |
| 40. | Holiday Shores | 2.7% | 12.2%(-9.50)#40 | 10.9%(-8.20)#848 |
| 41. | Carthage | 2.7% | 12.2%(-9.50)#41 | 10.9%(-8.20)#855 |
| 42. | Manito | 2.7% | 12.2%(-9.50)#42 | 10.9%(-8.20)#865 |
| 43. | Chenoa | 2.7% | 12.2%(-9.50)#43 | 10.9%(-8.20)#869 |
| 44. | Seatonville | 2.7% | 12.2%(-9.50)#44 | 10.9%(-8.20)#892 |
| 45. | Lynwood | 2.8% | 12.2%(-9.40)#45 | 10.9%(-8.10)#911 |
| 46. | St Jacob | 2.8% | 12.2%(-9.40)#46 | 10.9%(-8.10)#938 |
| 47. | Bannockburn | 2.8% | 12.2%(-9.40)#47 | 10.9%(-8.10)#945 |
| 48. | Cortland | 2.9% | 12.2%(-9.30)#48 | 10.9%(-8.00)#974 |
| 49. | Wenona | 2.9% | 12.2%(-9.30)#49 | 10.9%(-8.00)#1,003 |
| 50. | Vernon Hills | 3.0% | 12.2%(-9.20)#50 | 10.9%(-7.90)#1,013 |
| 51. | Stickney | 3.0% | 12.2%(-9.20)#51 | 10.9%(-7.90)#1,030 |
| 52. | Coal City | 3.0% | 12.2%(-9.20)#52 | 10.9%(-7.90)#1,033 |
| 53. | Tiskilwa | 3.0% | 12.2%(-9.20)#53 | 10.9%(-7.90)#1,063 |
| 54. | Keithsburg | 3.0% | 12.2%(-9.20)#54 | 10.9%(-7.90)#1,065 |
| 55. | Crest Hill | 3.1% | 12.2%(-9.10)#55 | 10.9%(-7.80)#1,076 |
| 56. | Bartelso | 3.1% | 12.2%(-9.10)#56 | 10.9%(-7.80)#1,133 |
| 57. | Wapella | 3.1% | 12.2%(-9.10)#57 | 10.9%(-7.80)#1,141 |
| 58. | Cutler | 3.1% | 12.2%(-9.10)#58 | 10.9%(-7.80)#1,145 |
| 59. | Park Ridge | 3.2% | 12.2%(-9.00)#59 | 10.9%(-7.70)#1,151 |
| 60. | Evergreen Park | 3.2% | 12.2%(-9.00)#60 | 10.9%(-7.70)#1,158 |
| 61. | La Grange | 3.2% | 12.2%(-9.00)#61 | 10.9%(-7.70)#1,159 |
| 62. | Winfield | 3.2% | 12.2%(-9.00)#62 | 10.9%(-7.70)#1,168 |
| 63. | Long Grove | 3.2% | 12.2%(-9.00)#63 | 10.9%(-7.70)#1,170 |
| 64. | Wilmington | 3.2% | 12.2%(-9.00)#64 | 10.9%(-7.70)#1,178 |
| 65. | Tamaroa | 3.2% | 12.2%(-9.00)#65 | 10.9%(-7.70)#1,217 |
| 66. | Deer Creek | 3.2% | 12.2%(-9.00)#66 | 10.9%(-7.70)#1,218 |
| 67. | Palos Heights | 3.3% | 12.2%(-8.90)#67 | 10.9%(-7.60)#1,236 |
| 68. | Martinton | 3.3% | 12.2%(-8.90)#68 | 10.9%(-7.60)#1,282 |
| 69. | Brookfield | 3.4% | 12.2%(-8.80)#69 | 10.9%(-7.50)#1,287 |
| 70. | Morton | 3.4% | 12.2%(-8.80)#70 | 10.9%(-7.50)#1,290 |
| 71. | Waterman | 3.4% | 12.2%(-8.80)#71 | 10.9%(-7.50)#1,335 |
| 72. | Franklin Grove | 3.4% | 12.2%(-8.80)#72 | 10.9%(-7.50)#1,339 |
| 73. | Geneva | 3.5% | 12.2%(-8.70)#73 | 10.9%(-7.40)#1,351 |
| 74. | Sycamore | 3.5% | 12.2%(-8.70)#74 | 10.9%(-7.40)#1,352 |
| 75. | Wauconda | 3.5% | 12.2%(-8.70)#75 | 10.9%(-7.40)#1,354 |
| 76. | Aledo | 3.5% | 12.2%(-8.70)#76 | 10.9%(-7.40)#1,379 |
| 77. | Hamilton | 3.5% | 12.2%(-8.70)#77 | 10.9%(-7.40)#1,380 |
| 78. | Hampton | 3.5% | 12.2%(-8.70)#78 | 10.9%(-7.40)#1,385 |
| 79. | Payson | 3.5% | 12.2%(-8.70)#79 | 10.9%(-7.40)#1,394 |
| 80. | Cornell | 3.5% | 12.2%(-8.70)#80 | 10.9%(-7.40)#1,410 |
| 81. | Lostant | 3.5% | 12.2%(-8.70)#81 | 10.9%(-7.40)#1,412 |
| 82. | Assumption | 3.6% | 12.2%(-8.60)#82 | 10.9%(-7.30)#1,464 |
| 83. | Westfield | 3.6% | 12.2%(-8.60)#83 | 10.9%(-7.30)#1,470 |
| 84. | Minooka | 3.7% | 12.2%(-8.50)#84 | 10.9%(-7.20)#1,478 |
| 85. | Diamond | 3.7% | 12.2%(-8.50)#85 | 10.9%(-7.20)#1,508 |
| 86. | Marquette Heights | 3.7% | 12.2%(-8.50)#86 | 10.9%(-7.20)#1,509 |
| 87. | Teutopolis | 3.7% | 12.2%(-8.50)#87 | 10.9%(-7.20)#1,513 |
| 88. | Forrest | 3.7% | 12.2%(-8.50)#88 | 10.9%(-7.20)#1,524 |
| 89. | Dix | 3.7% | 12.2%(-8.50)#89 | 10.9%(-7.20)#1,534 |
| 90. | Edgewood | 3.7% | 12.2%(-8.50)#90 | 10.9%(-7.20)#1,541 |
| 91. | Smithton | 3.8% | 12.2%(-8.40)#91 | 10.9%(-7.10)#1,580 |
| 92. | Tonica | 3.8% | 12.2%(-8.40)#92 | 10.9%(-7.10)#1,605 |
| 93. | Cowden | 3.8% | 12.2%(-8.40)#93 | 10.9%(-7.10)#1,607 |
| 94. | Hindsboro | 3.8% | 12.2%(-8.40)#94 | 10.9%(-7.10)#1,609 |
| 95. | Norridge | 3.9% | 12.2%(-8.30)#95 | 10.9%(-7.00)#1,623 |
| 96. | Peru | 3.9% | 12.2%(-8.30)#96 | 10.9%(-7.00)#1,631 |
| 97. | Candlewick Lake | 3.9% | 12.2%(-8.30)#97 | 10.9%(-7.00)#1,639 |
| 98. | Amboy | 3.9% | 12.2%(-8.30)#98 | 10.9%(-7.00)#1,647 |
| 99. | Oreana | 3.9% | 12.2%(-8.30)#99 | 10.9%(-7.00)#1,660 |
| 100. | Moweaqua | 4.0% | 12.2%(-8.20)#100 | 10.9%(-6.90)#1,721 |
Common Questions
What are the Top 10 Cities with the Lowest Unemployment Rate Amomg Youth Under the Age of 25 in Illinois?
Top 10 Cities with the Lowest Unemployment Rate Amomg Youth Under the Age of 25 in Illinois are:
What city has the Lowest Unemployment Rate Amomg Youth Under the Age of 25 in Illinois?
Darien has the Lowest Unemployment Rate Amomg Youth Under the Age of 25 in Illinois with 0.60%.
What is the Unemployment Rate Amomg Youth Under the Age of 25 in the State of Illinois?
Unemployment Rate Amomg Youth Under the Age of 25 in Illinois is 12.2%.
What is the Unemployment Rate Amomg Youth Under the Age of 25 in the United States?
Unemployment Rate Amomg Youth Under the Age of 25 in the United States is 10.9%.