Cities with the Lowest Unemployment Rate Amomg Youth Under the Age of 25 in Utah
RELATED REPORTS & OPTIONS
Lowest Unemployment | Youth < 25
Utah
Compare Cities
Map of Cities with the Lowest Unemployment Rate Amomg Youth Under the Age of 25 in Utah
10.0%
0.0%
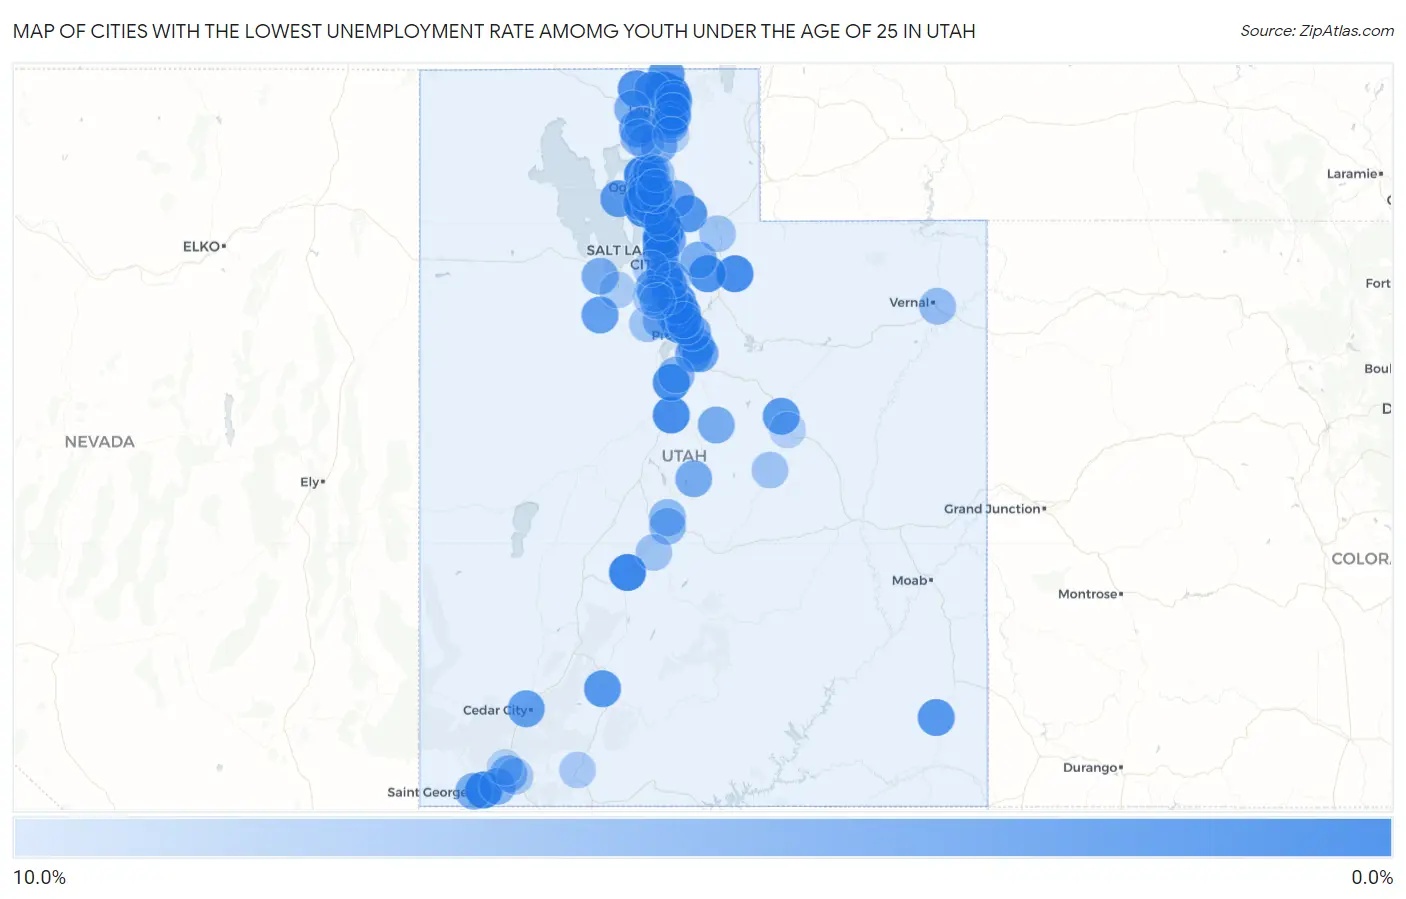
Cities with the Lowest Unemployment Rate Amomg Youth Under the Age of 25 in Utah
| City | Youth Unemployment | vs State | vs National | |
| 1. | Plain City | 0.80% | 6.7%(-5.90)#1 | 10.9%(-10.1)#86 |
| 2. | Millville | 1.0% | 6.7%(-5.70)#2 | 10.9%(-9.90)#137 |
| 3. | Smithfield | 1.1% | 6.7%(-5.60)#3 | 10.9%(-9.80)#143 |
| 4. | Joseph | 1.1% | 6.7%(-5.60)#4 | 10.9%(-9.80)#162 |
| 5. | Washington | 1.2% | 6.7%(-5.50)#5 | 10.9%(-9.70)#164 |
| 6. | Centerville | 1.2% | 6.7%(-5.50)#6 | 10.9%(-9.70)#167 |
| 7. | North Salt Lake | 1.5% | 6.7%(-5.20)#7 | 10.9%(-9.40)#237 |
| 8. | Syracuse | 1.8% | 6.7%(-4.90)#8 | 10.9%(-9.10)#351 |
| 9. | Nephi | 1.8% | 6.7%(-4.90)#9 | 10.9%(-9.10)#369 |
| 10. | Kamas | 1.8% | 6.7%(-4.90)#10 | 10.9%(-9.10)#383 |
| 11. | Amalga | 1.8% | 6.7%(-4.90)#11 | 10.9%(-9.10)#399 |
| 12. | Vineyard | 2.0% | 6.7%(-4.70)#12 | 10.9%(-8.90)#444 |
| 13. | Woods Cross | 2.0% | 6.7%(-4.70)#13 | 10.9%(-8.90)#445 |
| 14. | Rocky Ridge | 2.2% | 6.7%(-4.50)#14 | 10.9%(-8.70)#570 |
| 15. | Alpine | 2.3% | 6.7%(-4.40)#15 | 10.9%(-8.60)#594 |
| 16. | Clinton | 2.4% | 6.7%(-4.30)#16 | 10.9%(-8.50)#637 |
| 17. | Park City | 2.5% | 6.7%(-4.20)#17 | 10.9%(-8.40)#709 |
| 18. | Plymouth | 2.5% | 6.7%(-4.20)#18 | 10.9%(-8.40)#751 |
| 19. | Pleasant Grove | 2.6% | 6.7%(-4.10)#19 | 10.9%(-8.30)#753 |
| 20. | Sunset | 2.8% | 6.7%(-3.90)#20 | 10.9%(-8.10)#921 |
| 21. | Morgan | 2.8% | 6.7%(-3.90)#21 | 10.9%(-8.10)#927 |
| 22. | Logan | 3.0% | 6.7%(-3.70)#22 | 10.9%(-7.90)#1,011 |
| 23. | Blanding | 3.0% | 6.7%(-3.70)#23 | 10.9%(-7.90)#1,037 |
| 24. | Panguitch | 3.0% | 6.7%(-3.70)#24 | 10.9%(-7.90)#1,052 |
| 25. | Farr West | 3.1% | 6.7%(-3.60)#25 | 10.9%(-7.80)#1,090 |
| 26. | Lewiston | 3.1% | 6.7%(-3.60)#26 | 10.9%(-7.80)#1,118 |
| 27. | Marriott Slaterville | 3.1% | 6.7%(-3.60)#27 | 10.9%(-7.80)#1,119 |
| 28. | Helper | 3.2% | 6.7%(-3.50)#28 | 10.9%(-7.70)#1,193 |
| 29. | Hooper | 3.4% | 6.7%(-3.30)#29 | 10.9%(-7.50)#1,300 |
| 30. | West Haven | 3.6% | 6.7%(-3.10)#30 | 10.9%(-7.30)#1,422 |
| 31. | Bear River City | 3.7% | 6.7%(-3.00)#31 | 10.9%(-7.20)#1,528 |
| 32. | Cedar City | 3.8% | 6.7%(-2.90)#32 | 10.9%(-7.10)#1,545 |
| 33. | Rush Valley | 3.8% | 6.7%(-2.90)#33 | 10.9%(-7.10)#1,608 |
| 34. | Layton | 4.1% | 6.7%(-2.60)#34 | 10.9%(-6.80)#1,751 |
| 35. | West Point | 4.2% | 6.7%(-2.50)#35 | 10.9%(-6.70)#1,834 |
| 36. | Murray | 4.3% | 6.7%(-2.40)#36 | 10.9%(-6.60)#1,882 |
| 37. | Sandy | 4.4% | 6.7%(-2.30)#37 | 10.9%(-6.50)#1,951 |
| 38. | Spanish Fork | 4.4% | 6.7%(-2.30)#38 | 10.9%(-6.50)#1,957 |
| 39. | Newton | 4.5% | 6.7%(-2.20)#39 | 10.9%(-6.40)#2,085 |
| 40. | Springville | 4.6% | 6.7%(-2.10)#40 | 10.9%(-6.30)#2,112 |
| 41. | Bountiful | 4.7% | 6.7%(-2.00)#41 | 10.9%(-6.20)#2,175 |
| 42. | Midvale | 4.7% | 6.7%(-2.00)#42 | 10.9%(-6.20)#2,180 |
| 43. | Mapleton | 4.7% | 6.7%(-2.00)#43 | 10.9%(-6.20)#2,198 |
| 44. | Mountain Green | 4.9% | 6.7%(-1.80)#44 | 10.9%(-6.00)#2,363 |
| 45. | West Bountiful | 5.0% | 6.7%(-1.70)#45 | 10.9%(-5.90)#2,432 |
| 46. | North Logan | 5.1% | 6.7%(-1.60)#46 | 10.9%(-5.80)#2,485 |
| 47. | Provo | 5.2% | 6.7%(-1.50)#47 | 10.9%(-5.70)#2,528 |
| 48. | South Jordan | 5.2% | 6.7%(-1.50)#48 | 10.9%(-5.70)#2,530 |
| 49. | Mantua | 5.2% | 6.7%(-1.50)#49 | 10.9%(-5.70)#2,592 |
| 50. | South Ogden | 5.3% | 6.7%(-1.40)#50 | 10.9%(-5.60)#2,627 |
| 51. | Nibley | 5.3% | 6.7%(-1.40)#51 | 10.9%(-5.60)#2,648 |
| 52. | Manti | 5.3% | 6.7%(-1.40)#52 | 10.9%(-5.60)#2,663 |
| 53. | American Fork | 5.5% | 6.7%(-1.20)#53 | 10.9%(-5.40)#2,774 |
| 54. | Grantsville | 5.5% | 6.7%(-1.20)#54 | 10.9%(-5.40)#2,786 |
| 55. | Cedar Hills | 5.5% | 6.7%(-1.20)#55 | 10.9%(-5.40)#2,793 |
| 56. | Fairview | 5.5% | 6.7%(-1.20)#56 | 10.9%(-5.40)#2,827 |
| 57. | Summit Park | 5.7% | 6.7%(-1.00)#57 | 10.9%(-5.20)#2,945 |
| 58. | St George | 5.8% | 6.7%(-0.900)#58 | 10.9%(-5.10)#3,004 |
| 59. | Garland | 5.8% | 6.7%(-0.900)#59 | 10.9%(-5.10)#3,049 |
| 60. | Salt Lake City | 5.9% | 6.7%(-0.800)#60 | 10.9%(-5.00)#3,087 |
| 61. | La Verkin | 6.0% | 6.7%(-0.700)#61 | 10.9%(-4.90)#3,205 |
| 62. | Saratoga Springs | 6.1% | 6.7%(-0.600)#62 | 10.9%(-4.80)#3,263 |
| 63. | Hurricane | 6.1% | 6.7%(-0.600)#63 | 10.9%(-4.80)#3,271 |
| 64. | Kaysville | 6.2% | 6.7%(-0.500)#64 | 10.9%(-4.70)#3,336 |
| 65. | Honeyville | 6.2% | 6.7%(-0.500)#65 | 10.9%(-4.70)#3,385 |
| 66. | Orem | 6.3% | 6.7%(-0.400)#66 | 10.9%(-4.60)#3,419 |
| 67. | Clearfield | 6.5% | 6.7%(-0.200)#67 | 10.9%(-4.40)#3,580 |
| 68. | Farmington | 6.5% | 6.7%(-0.200)#68 | 10.9%(-4.40)#3,587 |
| 69. | Santaquin | 6.5% | 6.7%(-0.200)#69 | 10.9%(-4.40)#3,598 |
| 70. | Hyrum | 6.6% | 6.7%(-0.100)#70 | 10.9%(-4.30)#3,672 |
| 71. | Pleasant View | 6.8% | 6.7%(+0.100)#71 | 10.9%(-4.10)#3,824 |
| 72. | Washington Terrace | 6.8% | 6.7%(+0.100)#72 | 10.9%(-4.10)#3,831 |
| 73. | Redmond | 6.9% | 6.7%(+0.200)#73 | 10.9%(-4.00)#3,953 |
| 74. | Highland | 7.0% | 6.7%(+0.300)#74 | 10.9%(-3.90)#3,970 |
| 75. | Salina | 7.0% | 6.7%(+0.300)#75 | 10.9%(-3.90)#4,006 |
| 76. | Roy | 7.2% | 6.7%(+0.500)#76 | 10.9%(-3.70)#4,110 |
| 77. | Naples | 7.5% | 6.7%(+0.800)#77 | 10.9%(-3.40)#4,375 |
| 78. | Brigham City | 7.6% | 6.7%(+0.900)#78 | 10.9%(-3.30)#4,421 |
| 79. | Corinne | 7.8% | 6.7%(+1.10)#79 | 10.9%(-3.10)#4,652 |
| 80. | North Ogden | 8.1% | 6.7%(+1.40)#80 | 10.9%(-2.80)#4,817 |
| 81. | Hyde Park | 8.1% | 6.7%(+1.40)#81 | 10.9%(-2.80)#4,840 |
| 82. | Coalville | 8.1% | 6.7%(+1.40)#82 | 10.9%(-2.80)#4,858 |
| 83. | Draper | 8.2% | 6.7%(+1.50)#83 | 10.9%(-2.70)#4,886 |
| 84. | Huntington | 8.2% | 6.7%(+1.50)#84 | 10.9%(-2.70)#4,929 |
| 85. | Eagle Mountain | 8.3% | 6.7%(+1.60)#85 | 10.9%(-2.60)#4,942 |
| 86. | River Heights | 8.3% | 6.7%(+1.60)#86 | 10.9%(-2.60)#4,988 |
| 87. | Glenwood | 8.3% | 6.7%(+1.60)#87 | 10.9%(-2.60)#5,012 |
| 88. | Ogden | 8.5% | 6.7%(+1.80)#88 | 10.9%(-2.40)#5,123 |
| 89. | Cottonwood Heights | 8.7% | 6.7%(+2.00)#89 | 10.9%(-2.20)#5,312 |
| 90. | Herriman | 8.8% | 6.7%(+2.10)#90 | 10.9%(-2.10)#5,381 |
| 91. | Virgin | 8.8% | 6.7%(+2.10)#91 | 10.9%(-2.10)#5,458 |
| 92. | Riverton | 8.9% | 6.7%(+2.20)#92 | 10.9%(-2.00)#5,474 |
| 93. | Lindon | 8.9% | 6.7%(+2.20)#93 | 10.9%(-2.00)#5,497 |
| 94. | Orderville | 9.0% | 6.7%(+2.30)#94 | 10.9%(-1.90)#5,602 |
| 95. | West Valley City | 9.2% | 6.7%(+2.50)#95 | 10.9%(-1.70)#5,710 |
| 96. | Tooele | 9.2% | 6.7%(+2.50)#96 | 10.9%(-1.70)#5,723 |
| 97. | Bluffdale | 9.3% | 6.7%(+2.60)#97 | 10.9%(-1.60)#5,812 |
| 98. | Price | 9.6% | 6.7%(+2.90)#98 | 10.9%(-1.30)#6,058 |
| 99. | Paradise | 9.6% | 6.7%(+2.90)#99 | 10.9%(-1.30)#6,086 |
| 100. | Toquerville | 9.9% | 6.7%(+3.20)#100 | 10.9%(-1.000)#6,302 |
1
2Common Questions
What are the Top 10 Cities with the Lowest Unemployment Rate Amomg Youth Under the Age of 25 in Utah?
Top 10 Cities with the Lowest Unemployment Rate Amomg Youth Under the Age of 25 in Utah are:
#1
0.80%
#2
1.0%
#3
1.1%
#4
1.1%
#5
1.2%
#6
1.2%
#7
1.5%
#8
1.8%
#9
1.8%
#10
1.8%
What city has the Lowest Unemployment Rate Amomg Youth Under the Age of 25 in Utah?
Plain City has the Lowest Unemployment Rate Amomg Youth Under the Age of 25 in Utah with 0.80%.
What is the Unemployment Rate Amomg Youth Under the Age of 25 in the State of Utah?
Unemployment Rate Amomg Youth Under the Age of 25 in Utah is 6.7%.
What is the Unemployment Rate Amomg Youth Under the Age of 25 in the United States?
Unemployment Rate Amomg Youth Under the Age of 25 in the United States is 10.9%.