Cities with the Lowest Unemployment Rate Amomg Youth Under the Age of 25 in Oklahoma
RELATED REPORTS & OPTIONS
Lowest Unemployment | Youth < 25
Oklahoma
Compare Cities
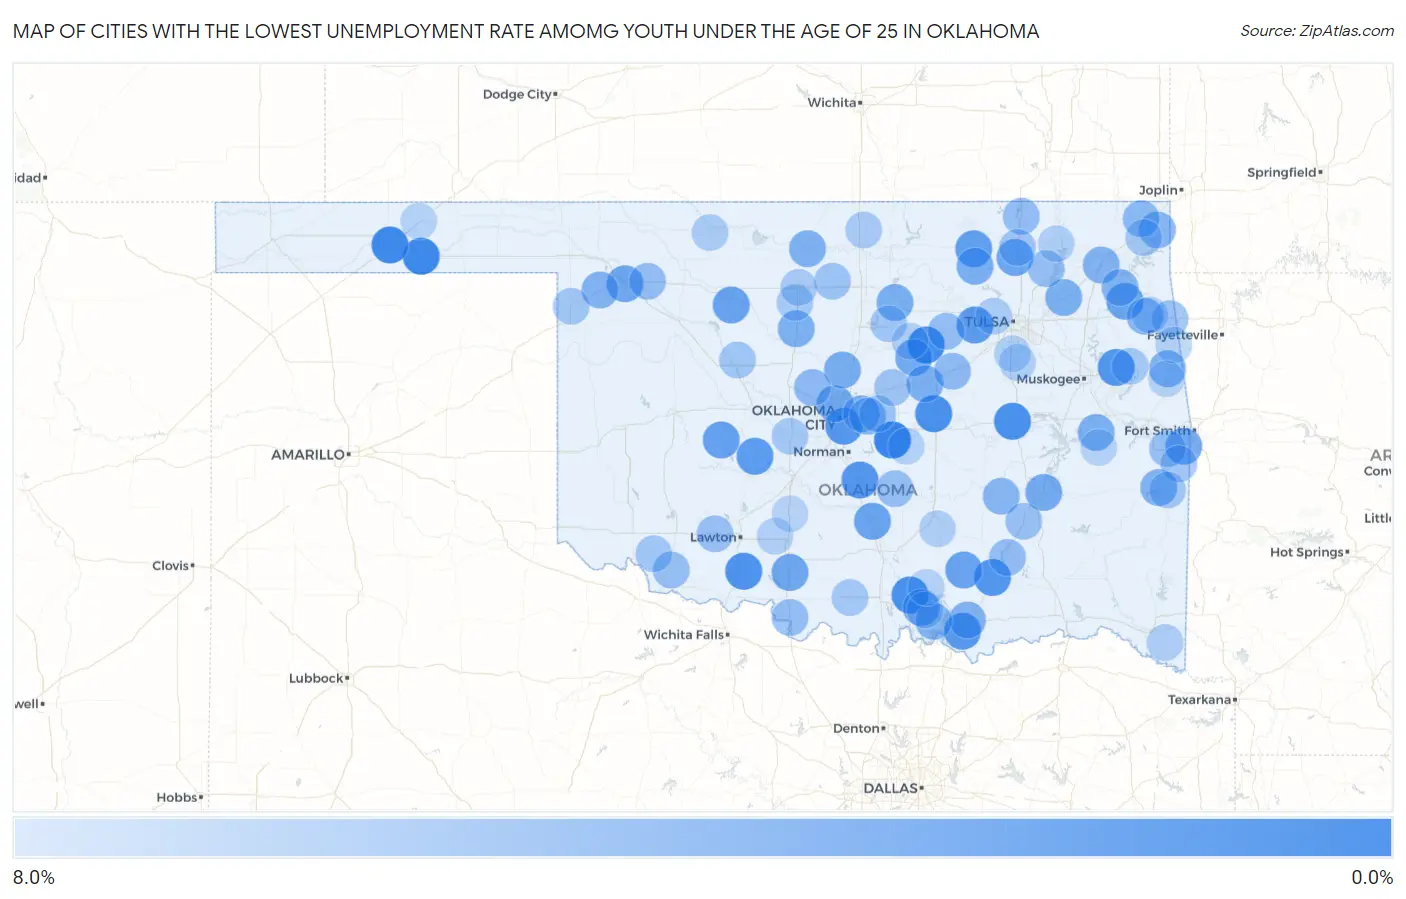
Map of Cities with the Lowest Unemployment Rate Amomg Youth Under the Age of 25 in Oklahoma
8.0%
0.0%
Cities with the Lowest Unemployment Rate Amomg Youth Under the Age of 25 in Oklahoma
| City | Youth Unemployment | vs State | vs National | |
| 1. | Bethel Acres | 0.60% | 9.4%(-8.80)#1 | 10.9%(-10.3)#59 |
| 2. | Hardesty | 0.90% | 9.4%(-8.50)#2 | 10.9%(-10.00)#116 |
| 3. | Guymon | 1.1% | 9.4%(-8.30)#3 | 10.9%(-9.80)#145 |
| 4. | Cushing | 1.2% | 9.4%(-8.20)#4 | 10.9%(-9.70)#173 |
| 5. | Mannsville | 1.6% | 9.4%(-7.80)#5 | 10.9%(-9.30)#293 |
| 6. | Henryetta | 1.7% | 9.4%(-7.70)#6 | 10.9%(-9.20)#325 |
| 7. | Prague | 1.7% | 9.4%(-7.70)#7 | 10.9%(-9.20)#338 |
| 8. | Walters | 1.8% | 9.4%(-7.60)#8 | 10.9%(-9.10)#384 |
| 9. | Woodall | 2.1% | 9.4%(-7.30)#9 | 10.9%(-8.80)#521 |
| 10. | Tushka | 2.1% | 9.4%(-7.30)#10 | 10.9%(-8.80)#529 |
| 11. | Lexington | 2.2% | 9.4%(-7.20)#11 | 10.9%(-8.70)#563 |
| 12. | Valley Brook | 2.3% | 9.4%(-7.10)#12 | 10.9%(-8.60)#627 |
| 13. | Calera | 2.4% | 9.4%(-7.00)#13 | 10.9%(-8.50)#669 |
| 14. | Gracemont | 2.6% | 9.4%(-6.80)#14 | 10.9%(-8.30)#821 |
| 15. | Mannford | 2.7% | 9.4%(-6.70)#15 | 10.9%(-8.20)#849 |
| 16. | Shady Grove Cdp Cherokee County | 2.8% | 9.4%(-6.60)#16 | 10.9%(-8.10)#951 |
| 17. | Pawhuska | 2.9% | 9.4%(-6.50)#17 | 10.9%(-8.00)#986 |
| 18. | Eakly | 3.1% | 9.4%(-6.30)#18 | 10.9%(-7.80)#1,143 |
| 19. | Fairview | 3.3% | 9.4%(-6.10)#19 | 10.9%(-7.60)#1,257 |
| 20. | Kenwood | 3.3% | 9.4%(-6.10)#20 | 10.9%(-7.60)#1,267 |
| 21. | Wapanucka | 3.3% | 9.4%(-6.10)#21 | 10.9%(-7.60)#1,280 |
| 22. | Pauls Valley | 3.4% | 9.4%(-6.00)#22 | 10.9%(-7.50)#1,311 |
| 23. | Ochelata | 3.5% | 9.4%(-5.90)#23 | 10.9%(-7.40)#1,404 |
| 24. | Woodward | 3.6% | 9.4%(-5.80)#24 | 10.9%(-7.30)#1,431 |
| 25. | Comanche | 3.6% | 9.4%(-5.80)#25 | 10.9%(-7.30)#1,461 |
| 26. | Pocola | 3.8% | 9.4%(-5.60)#26 | 10.9%(-7.10)#1,578 |
| 27. | Agra | 3.8% | 9.4%(-5.60)#27 | 10.9%(-7.10)#1,606 |
| 28. | The Village | 3.9% | 9.4%(-5.50)#28 | 10.9%(-7.00)#1,632 |
| 29. | Krebs | 4.0% | 9.4%(-5.40)#29 | 10.9%(-6.90)#1,720 |
| 30. | Oakland | 4.0% | 9.4%(-5.40)#30 | 10.9%(-6.90)#1,730 |
| 31. | Guthrie | 4.2% | 9.4%(-5.20)#31 | 10.9%(-6.70)#1,836 |
| 32. | Morrison | 4.3% | 9.4%(-5.10)#32 | 10.9%(-6.60)#1,937 |
| 33. | Davenport | 4.3% | 9.4%(-5.10)#33 | 10.9%(-6.60)#1,938 |
| 34. | Wynona | 4.3% | 9.4%(-5.10)#34 | 10.9%(-6.60)#1,947 |
| 35. | Claremore | 4.4% | 9.4%(-5.00)#35 | 10.9%(-6.50)#1,962 |
| 36. | Porum | 4.4% | 9.4%(-5.00)#36 | 10.9%(-6.50)#2,017 |
| 37. | Hennessey | 4.5% | 9.4%(-4.90)#37 | 10.9%(-6.40)#2,069 |
| 38. | Stilwell | 4.6% | 9.4%(-4.80)#38 | 10.9%(-6.30)#2,144 |
| 39. | Pond Creek | 4.6% | 9.4%(-4.80)#39 | 10.9%(-6.30)#2,165 |
| 40. | Durant | 4.7% | 9.4%(-4.70)#40 | 10.9%(-6.20)#2,188 |
| 41. | Wister | 4.7% | 9.4%(-4.70)#41 | 10.9%(-6.20)#2,238 |
| 42. | Fargo | 4.7% | 9.4%(-4.70)#42 | 10.9%(-6.20)#2,255 |
| 43. | Big Cabin | 4.7% | 9.4%(-4.70)#43 | 10.9%(-6.20)#2,261 |
| 44. | Nicoma Park | 4.8% | 9.4%(-4.60)#44 | 10.9%(-6.10)#2,301 |
| 45. | Kingston | 4.8% | 9.4%(-4.60)#45 | 10.9%(-6.10)#2,310 |
| 46. | Spavinaw | 4.9% | 9.4%(-4.50)#46 | 10.9%(-6.00)#2,399 |
| 47. | Twin Oaks | 4.9% | 9.4%(-4.50)#47 | 10.9%(-6.00)#2,401 |
| 48. | Wyandotte | 5.0% | 9.4%(-4.40)#48 | 10.9%(-5.90)#2,458 |
| 49. | Stuart | 5.0% | 9.4%(-4.40)#49 | 10.9%(-5.90)#2,463 |
| 50. | Choctaw | 5.1% | 9.4%(-4.30)#50 | 10.9%(-5.80)#2,482 |
| 51. | Miami | 5.3% | 9.4%(-4.10)#51 | 10.9%(-5.60)#2,634 |
| 52. | Piedmont | 5.4% | 9.4%(-4.00)#52 | 10.9%(-5.50)#2,720 |
| 53. | Depew | 5.4% | 9.4%(-4.00)#53 | 10.9%(-5.50)#2,769 |
| 54. | Mooreland | 5.7% | 9.4%(-3.70)#54 | 10.9%(-5.20)#2,986 |
| 55. | Copan | 5.7% | 9.4%(-3.70)#55 | 10.9%(-5.20)#2,989 |
| 56. | Ryan | 5.7% | 9.4%(-3.70)#56 | 10.9%(-5.20)#2,991 |
| 57. | Stringtown | 5.7% | 9.4%(-3.70)#57 | 10.9%(-5.20)#2,999 |
| 58. | Talala | 5.8% | 9.4%(-3.60)#58 | 10.9%(-5.10)#3,077 |
| 59. | Wanette | 5.8% | 9.4%(-3.60)#59 | 10.9%(-5.10)#3,082 |
| 60. | Frederick | 5.9% | 9.4%(-3.50)#60 | 10.9%(-5.00)#3,128 |
| 61. | Oilton | 5.9% | 9.4%(-3.50)#61 | 10.9%(-5.00)#3,154 |
| 62. | Cache | 6.0% | 9.4%(-3.40)#62 | 10.9%(-4.90)#3,213 |
| 63. | Spiro | 6.0% | 9.4%(-3.40)#63 | 10.9%(-4.90)#3,220 |
| 64. | West Siloam Springs | 6.0% | 9.4%(-3.40)#64 | 10.9%(-4.90)#3,230 |
| 65. | Kiowa | 6.0% | 9.4%(-3.40)#65 | 10.9%(-4.90)#3,252 |
| 66. | Harrah | 6.2% | 9.4%(-3.20)#66 | 10.9%(-4.70)#3,366 |
| 67. | Garber | 6.2% | 9.4%(-3.20)#67 | 10.9%(-4.70)#3,397 |
| 68. | Bartlesville | 6.3% | 9.4%(-3.10)#68 | 10.9%(-4.60)#3,429 |
| 69. | Wellston | 6.3% | 9.4%(-3.10)#69 | 10.9%(-4.60)#3,492 |
| 70. | Stillwater | 6.4% | 9.4%(-3.00)#70 | 10.9%(-4.50)#3,508 |
| 71. | Watonga | 6.4% | 9.4%(-3.00)#71 | 10.9%(-4.50)#3,546 |
| 72. | Tipton | 6.4% | 9.4%(-3.00)#72 | 10.9%(-4.50)#3,565 |
| 73. | Cameron | 6.4% | 9.4%(-3.00)#73 | 10.9%(-4.50)#3,571 |
| 74. | Shattuck | 6.6% | 9.4%(-2.80)#74 | 10.9%(-4.30)#3,704 |
| 75. | Howe | 6.6% | 9.4%(-2.80)#75 | 10.9%(-4.30)#3,714 |
| 76. | Wilson | 6.7% | 9.4%(-2.70)#76 | 10.9%(-4.20)#3,787 |
| 77. | Minco | 6.7% | 9.4%(-2.70)#77 | 10.9%(-4.20)#3,788 |
| 78. | Fairland | 6.7% | 9.4%(-2.70)#78 | 10.9%(-4.20)#3,790 |
| 79. | Park Hill | 6.8% | 9.4%(-2.60)#79 | 10.9%(-4.10)#3,845 |
| 80. | Waukomis | 6.8% | 9.4%(-2.60)#80 | 10.9%(-4.10)#3,869 |
| 81. | Enid | 6.9% | 9.4%(-2.50)#81 | 10.9%(-4.00)#3,899 |
| 82. | Blackwell | 6.9% | 9.4%(-2.50)#82 | 10.9%(-4.00)#3,923 |
| 83. | Sand Springs | 7.0% | 9.4%(-2.40)#83 | 10.9%(-3.90)#3,969 |
| 84. | Alva | 7.0% | 9.4%(-2.40)#84 | 10.9%(-3.90)#3,989 |
| 85. | Haworth | 7.1% | 9.4%(-2.30)#85 | 10.9%(-3.80)#4,094 |
| 86. | Liberty | 7.1% | 9.4%(-2.30)#86 | 10.9%(-3.80)#4,098 |
| 87. | Ada | 7.2% | 9.4%(-2.20)#87 | 10.9%(-3.70)#4,124 |
| 88. | Nowata | 7.2% | 9.4%(-2.20)#88 | 10.9%(-3.70)#4,153 |
| 89. | Kansas | 7.2% | 9.4%(-2.20)#89 | 10.9%(-3.70)#4,174 |
| 90. | Glenpool | 7.4% | 9.4%(-2.00)#90 | 10.9%(-3.50)#4,278 |
| 91. | Central High | 7.4% | 9.4%(-2.00)#91 | 10.9%(-3.50)#4,311 |
| 92. | Ripley | 7.4% | 9.4%(-2.00)#92 | 10.9%(-3.50)#4,333 |
| 93. | Tecumseh | 7.5% | 9.4%(-1.90)#93 | 10.9%(-3.40)#4,365 |
| 94. | Westville | 7.5% | 9.4%(-1.90)#94 | 10.9%(-3.40)#4,381 |
| 95. | Hooker | 7.5% | 9.4%(-1.90)#95 | 10.9%(-3.40)#4,383 |
| 96. | Madill | 7.6% | 9.4%(-1.80)#96 | 10.9%(-3.30)#4,447 |
| 97. | Rush Springs | 7.6% | 9.4%(-1.80)#97 | 10.9%(-3.30)#4,462 |
| 98. | Cherry Tree | 7.6% | 9.4%(-1.80)#98 | 10.9%(-3.30)#4,471 |
| 99. | Ravia | 7.6% | 9.4%(-1.80)#99 | 10.9%(-3.30)#4,485 |
| 100. | Whitefield | 7.6% | 9.4%(-1.80)#100 | 10.9%(-3.30)#4,486 |
Common Questions
What are the Top 10 Cities with the Lowest Unemployment Rate Amomg Youth Under the Age of 25 in Oklahoma?
Top 10 Cities with the Lowest Unemployment Rate Amomg Youth Under the Age of 25 in Oklahoma are:
#1
0.60%
#2
0.90%
#3
1.1%
#4
1.2%
#5
1.6%
#6
1.7%
#7
1.7%
#8
1.8%
#9
2.1%
#10
2.1%
What city has the Lowest Unemployment Rate Amomg Youth Under the Age of 25 in Oklahoma?
Bethel Acres has the Lowest Unemployment Rate Amomg Youth Under the Age of 25 in Oklahoma with 0.60%.
What is the Unemployment Rate Amomg Youth Under the Age of 25 in the State of Oklahoma?
Unemployment Rate Amomg Youth Under the Age of 25 in Oklahoma is 9.4%.
What is the Unemployment Rate Amomg Youth Under the Age of 25 in the United States?
Unemployment Rate Amomg Youth Under the Age of 25 in the United States is 10.9%.