Cities with the Lowest Unemployment Rate Amomg Youth Under the Age of 25 in the United States
RELATED REPORTS & OPTIONS
Lowest Unemployment | Youth < 25
United States
Compare Cities
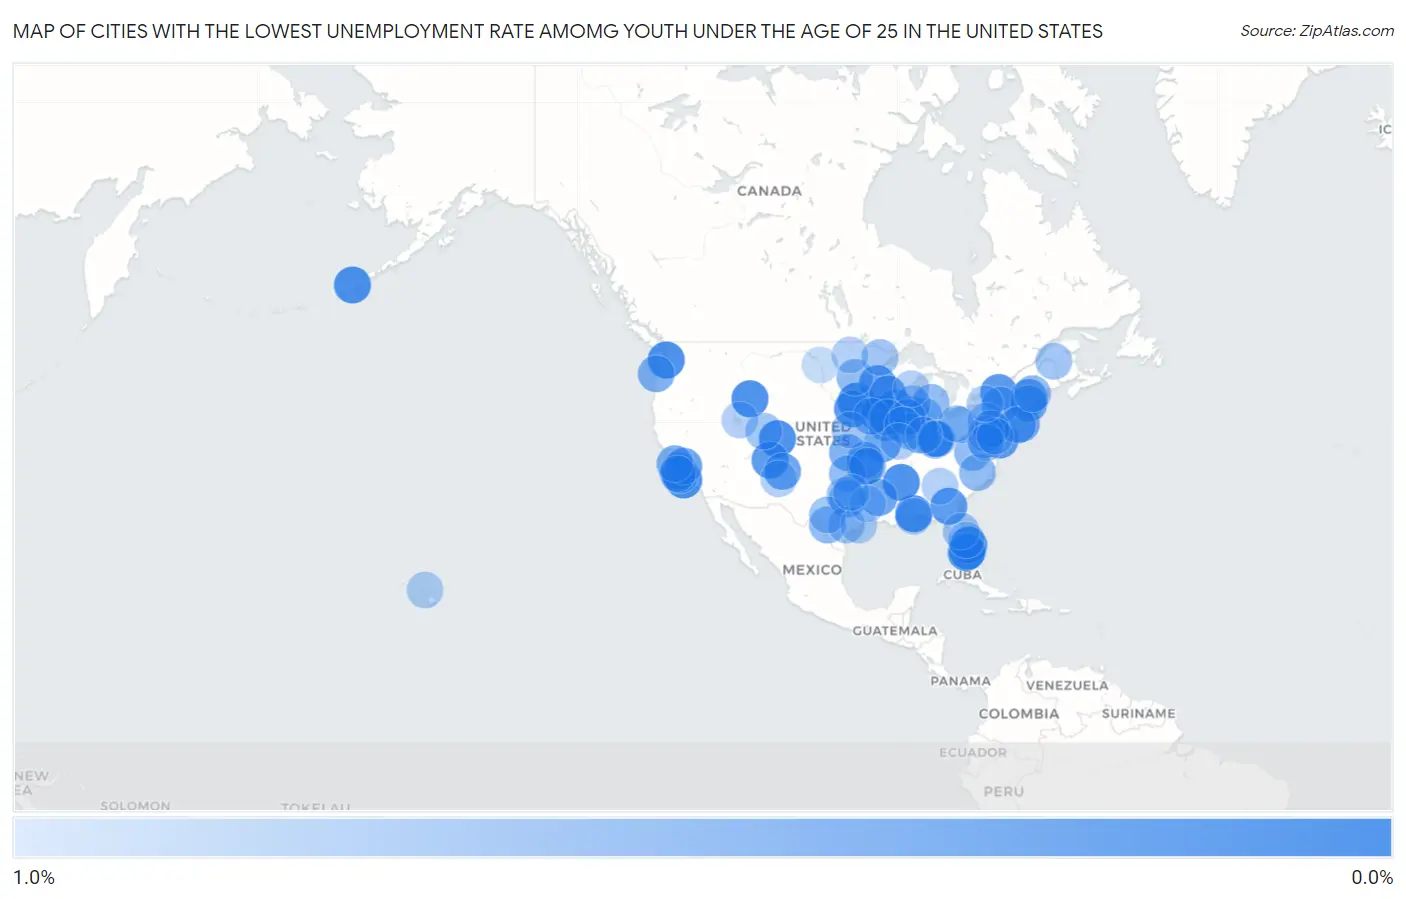
Map of Cities with the Lowest Unemployment Rate Amomg Youth Under the Age of 25 in the United States
1.0%
0.0%
Cities with the Lowest Unemployment Rate Amomg Youth Under the Age of 25 in the United States
| City | Youth Unemployment | vs State | vs National | |
| 1. | Sweetwater | 0.10% | 10.4%(-10.3)#1 | 10.9%(-10.8)#1 |
| 2. | North Liberty | 0.20% | 7.9%(-7.70)#1 | 10.9%(-10.7)#2 |
| 3. | North Palm Beach | 0.20% | 10.4%(-10.2)#2 | 10.9%(-10.7)#3 |
| 4. | Gig Harbor | 0.20% | 10.9%(-10.7)#1 | 10.9%(-10.7)#4 |
| 5. | Jackson | 0.20% | 8.8%(-8.60)#1 | 10.9%(-10.7)#5 |
| 6. | Aspen | 0.20% | 9.1%(-8.90)#1 | 10.9%(-10.7)#6 |
| 7. | Robertsdale | 0.20% | 10.9%(-10.7)#1 | 10.9%(-10.7)#7 |
| 8. | Solvang | 0.20% | 12.5%(-12.3)#1 | 10.9%(-10.7)#8 |
| 9. | Palmerton Borough | 0.20% | 11.1%(-10.9)#1 | 10.9%(-10.7)#9 |
| 10. | Sheldon | 0.20% | 7.9%(-7.70)#2 | 10.9%(-10.7)#10 |
| 11. | University | 0.20% | 13.8%(-13.6)#1 | 10.9%(-10.7)#11 |
| 12. | Unalaska | 0.20% | 12.6%(-12.4)#1 | 10.9%(-10.7)#12 |
| 13. | Hudson | 0.30% | 6.8%(-6.50)#1 | 10.9%(-10.6)#13 |
| 14. | South Sioux City | 0.30% | 6.8%(-6.50)#1 | 10.9%(-10.6)#14 |
| 15. | Douglas | 0.30% | 11.3%(-11.0)#1 | 10.9%(-10.6)#15 |
| 16. | Cusseta Chattahoochee County Unified Government | 0.30% | 11.3%(-11.0)#2 | 10.9%(-10.6)#16 |
| 17. | Templeton | 0.30% | 12.5%(-12.2)#2 | 10.9%(-10.6)#17 |
| 18. | Aztec | 0.30% | 11.6%(-11.3)#1 | 10.9%(-10.6)#18 |
| 19. | Calcium | 0.30% | 13.2%(-12.9)#1 | 10.9%(-10.6)#19 |
| 20. | Kent Acres | 0.30% | 11.7%(-11.4)#1 | 10.9%(-10.6)#20 |
| 21. | Crown College | 0.30% | 7.7%(-7.40)#1 | 10.9%(-10.6)#21 |
| 22. | Arroyo Grande | 0.40% | 12.5%(-12.1)#3 | 10.9%(-10.5)#22 |
| 23. | Siloam Springs | 0.40% | 11.3%(-10.9)#1 | 10.9%(-10.5)#23 |
| 24. | Laconia | 0.40% | 7.0%(-6.60)#1 | 10.9%(-10.5)#24 |
| 25. | Mount Pleasant | 0.40% | 7.9%(-7.50)#3 | 10.9%(-10.5)#25 |
| 26. | Covedale | 0.40% | 9.9%(-9.50)#1 | 10.9%(-10.5)#26 |
| 27. | Flanders | 0.40% | 13.2%(-12.8)#2 | 10.9%(-10.5)#27 |
| 28. | Huron | 0.40% | 12.5%(-12.1)#4 | 10.9%(-10.5)#28 |
| 29. | Grambling | 0.40% | 13.8%(-13.4)#1 | 10.9%(-10.5)#29 |
| 30. | Westmont Borough | 0.40% | 11.1%(-10.7)#2 | 10.9%(-10.5)#30 |
| 31. | Pinardville | 0.40% | 7.0%(-6.60)#2 | 10.9%(-10.5)#31 |
| 32. | Holts Summit | 0.40% | 8.7%(-8.30)#1 | 10.9%(-10.5)#32 |
| 33. | La Cienega | 0.40% | 11.6%(-11.2)#2 | 10.9%(-10.5)#33 |
| 34. | Tama | 0.40% | 7.9%(-7.50)#4 | 10.9%(-10.5)#34 |
| 35. | Cuba City | 0.40% | 6.8%(-6.40)#2 | 10.9%(-10.5)#35 |
| 36. | Sussex Borough | 0.40% | 12.9%(-12.5)#1 | 10.9%(-10.5)#36 |
| 37. | Trempealeau | 0.40% | 6.8%(-6.40)#3 | 10.9%(-10.5)#37 |
| 38. | Soledad | 0.50% | 12.5%(-12.0)#5 | 10.9%(-10.4)#38 |
| 39. | Johnston | 0.50% | 7.9%(-7.40)#5 | 10.9%(-10.4)#39 |
| 40. | Progress | 0.50% | 11.1%(-10.6)#3 | 10.9%(-10.4)#40 |
| 41. | Westview | 0.50% | 10.4%(-9.90)#3 | 10.9%(-10.4)#41 |
| 42. | Greencastle | 0.50% | 9.1%(-8.60)#1 | 10.9%(-10.4)#42 |
| 43. | Augusta | 0.50% | 8.7%(-8.20)#1 | 10.9%(-10.4)#43 |
| 44. | Seaside | 0.50% | 11.7%(-11.2)#1 | 10.9%(-10.4)#44 |
| 45. | Venus | 0.50% | 10.8%(-10.3)#1 | 10.9%(-10.4)#45 |
| 46. | Hamilton | 0.50% | 13.2%(-12.7)#3 | 10.9%(-10.4)#46 |
| 47. | North Great River | 0.50% | 13.2%(-12.7)#4 | 10.9%(-10.4)#47 |
| 48. | Seneca | 0.50% | 8.7%(-8.20)#2 | 10.9%(-10.4)#48 |
| 49. | The University Of Virginia's College At Wise | 0.50% | 10.6%(-10.1)#1 | 10.9%(-10.4)#49 |
| 50. | Darien | 0.60% | 12.2%(-11.6)#1 | 10.9%(-10.3)#50 |
| 51. | Uvalde | 0.60% | 10.8%(-10.2)#2 | 10.9%(-10.3)#51 |
| 52. | Lock Haven | 0.60% | 11.1%(-10.5)#4 | 10.9%(-10.3)#52 |
| 53. | Lexington | 0.60% | 10.6%(-10.00)#2 | 10.9%(-10.3)#53 |
| 54. | Notre Dame | 0.60% | 9.1%(-8.50)#2 | 10.9%(-10.3)#54 |
| 55. | Belding | 0.60% | 11.6%(-11.0)#1 | 10.9%(-10.3)#55 |
| 56. | New Brighton Borough | 0.60% | 11.1%(-10.5)#5 | 10.9%(-10.3)#56 |
| 57. | Morris | 0.60% | 7.7%(-7.10)#2 | 10.9%(-10.3)#57 |
| 58. | Lillington | 0.60% | 11.1%(-10.5)#1 | 10.9%(-10.3)#58 |
| 59. | Bethel Acres | 0.60% | 9.4%(-8.80)#1 | 10.9%(-10.3)#59 |
| 60. | Elm Springs | 0.60% | 11.3%(-10.7)#2 | 10.9%(-10.3)#60 |
| 61. | Rossmoyne | 0.60% | 9.9%(-9.30)#2 | 10.9%(-10.3)#61 |
| 62. | Fryeburg | 0.60% | 8.8%(-8.20)#1 | 10.9%(-10.3)#62 |
| 63. | Oak Creek | 0.70% | 6.8%(-6.10)#4 | 10.9%(-10.2)#63 |
| 64. | Colonial Park | 0.70% | 11.1%(-10.4)#6 | 10.9%(-10.2)#64 |
| 65. | Purcellville | 0.70% | 10.6%(-9.90)#3 | 10.9%(-10.2)#65 |
| 66. | Savoy | 0.70% | 12.2%(-11.5)#2 | 10.9%(-10.2)#66 |
| 67. | Virginia | 0.70% | 7.7%(-7.00)#3 | 10.9%(-10.2)#67 |
| 68. | Wedgefield | 0.70% | 10.4%(-9.70)#4 | 10.9%(-10.2)#68 |
| 69. | River Oaks | 0.70% | 10.8%(-10.1)#3 | 10.9%(-10.2)#69 |
| 70. | Yoakum | 0.70% | 10.8%(-10.1)#4 | 10.9%(-10.2)#70 |
| 71. | Junction | 0.70% | 10.8%(-10.1)#5 | 10.9%(-10.2)#71 |
| 72. | Rangely | 0.70% | 9.1%(-8.40)#2 | 10.9%(-10.2)#72 |
| 73. | Van Buren | 0.70% | 8.8%(-8.10)#2 | 10.9%(-10.2)#73 |
| 74. | Malvern | 0.70% | 9.9%(-9.20)#3 | 10.9%(-10.2)#74 |
| 75. | Wymore | 0.70% | 6.8%(-6.10)#2 | 10.9%(-10.2)#75 |
| 76. | Lone Tree | 0.70% | 7.9%(-7.20)#6 | 10.9%(-10.2)#76 |
| 77. | Newark | 0.70% | 12.2%(-11.5)#3 | 10.9%(-10.2)#77 |
| 78. | Blue Ridge Summit | 0.70% | 11.1%(-10.4)#7 | 10.9%(-10.2)#78 |
| 79. | Angleton | 0.80% | 10.8%(-10.00)#6 | 10.9%(-10.1)#79 |
| 80. | Sudley | 0.80% | 10.6%(-9.80)#4 | 10.9%(-10.1)#80 |
| 81. | White Oak | 0.80% | 9.9%(-9.10)#4 | 10.9%(-10.1)#81 |
| 82. | Gulf Shores | 0.80% | 10.9%(-10.1)#2 | 10.9%(-10.1)#82 |
| 83. | Harrison | 0.80% | 9.9%(-9.10)#5 | 10.9%(-10.1)#83 |
| 84. | Waihee Waiehu | 0.80% | 10.8%(-10.00)#1 | 10.9%(-10.1)#84 |
| 85. | Hobart | 0.80% | 6.8%(-6.00)#5 | 10.9%(-10.1)#85 |
| 86. | Plain City | 0.80% | 6.7%(-5.90)#1 | 10.9%(-10.1)#86 |
| 87. | Crookston | 0.80% | 7.7%(-6.90)#4 | 10.9%(-10.1)#87 |
| 88. | Indian River Estates | 0.80% | 10.4%(-9.60)#5 | 10.9%(-10.1)#88 |
| 89. | Riverside | 0.80% | 12.3%(-11.5)#1 | 10.9%(-10.1)#89 |
| 90. | Eureka | 0.80% | 12.2%(-11.4)#4 | 10.9%(-10.1)#90 |
| 91. | Center | 0.80% | 10.8%(-10.00)#7 | 10.9%(-10.1)#91 |
| 92. | Staunton | 0.80% | 12.2%(-11.4)#5 | 10.9%(-10.1)#92 |
| 93. | Grayson | 0.80% | 11.3%(-10.5)#3 | 10.9%(-10.1)#93 |
| 94. | Lima | 0.80% | 13.2%(-12.4)#5 | 10.9%(-10.1)#94 |
| 95. | Lowry Crossing | 0.80% | 10.8%(-10.00)#8 | 10.9%(-10.1)#95 |
| 96. | Las Maravillas | 0.80% | 11.6%(-10.8)#3 | 10.9%(-10.1)#96 |
| 97. | Dalton | 0.80% | 9.9%(-9.10)#6 | 10.9%(-10.1)#97 |
| 98. | Mandan | 0.90% | 6.4%(-5.50)#1 | 10.9%(-10.00)#98 |
| 99. | Morro Bay | 0.90% | 12.5%(-11.6)#6 | 10.9%(-10.00)#99 |
| 100. | Mooresville | 0.90% | 9.1%(-8.20)#3 | 10.9%(-10.00)#100 |
Common Questions
What are the Top 10 Cities with the Lowest Unemployment Rate Amomg Youth Under the Age of 25 in the United States?
Top 10 Cities with the Lowest Unemployment Rate Amomg Youth Under the Age of 25 in the United States are:
#1
0.10%
#2
0.20%
#3
0.20%
#4
0.20%
#5
0.20%
#6
0.20%
#7
0.20%
#8
0.20%
#9
0.20%
#10
0.20%
What city has the Lowest Unemployment Rate Amomg Youth Under the Age of 25 in the United States?
Sweetwater has the Lowest Unemployment Rate Amomg Youth Under the Age of 25 in the United States with 0.10%.
What is the Unemployment Rate Amomg Youth Under the Age of 25 in the United States?
Unemployment Rate Amomg Youth Under the Age of 25 in the United States is 10.9%.