Cities with the Lowest Unemployment Rate Amomg Youth Under the Age of 25 in Massachusetts
RELATED REPORTS & OPTIONS
Lowest Unemployment | Youth < 25
Massachusetts
Compare Cities
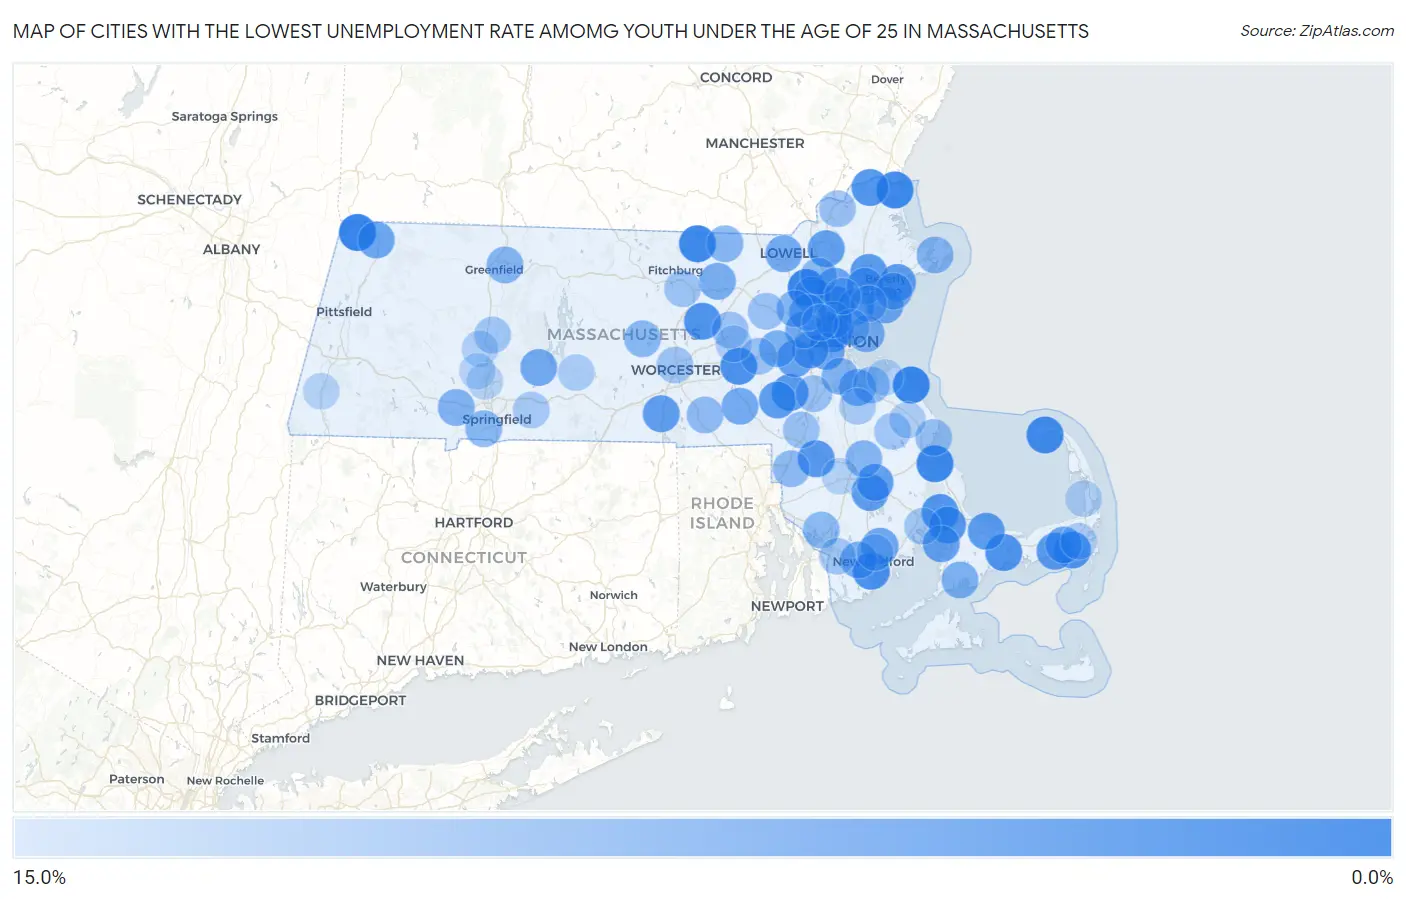
Map of Cities with the Lowest Unemployment Rate Amomg Youth Under the Age of 25 in Massachusetts
15.0%
0.0%
Cities with the Lowest Unemployment Rate Amomg Youth Under the Age of 25 in Massachusetts
| City | Youth Unemployment | vs State | vs National | |
| 1. | Williamstown | 1.2% | 10.8%(-9.60)#1 | 10.9%(-9.70)#176 |
| 2. | North Scituate | 1.3% | 10.8%(-9.50)#2 | 10.9%(-9.60)#199 |
| 3. | Pinehurst | 1.4% | 10.8%(-9.40)#3 | 10.9%(-9.50)#223 |
| 4. | Plymouth | 1.7% | 10.8%(-9.10)#4 | 10.9%(-9.20)#322 |
| 5. | Townsend | 1.7% | 10.8%(-9.10)#5 | 10.9%(-9.20)#345 |
| 6. | Salisbury | 1.9% | 10.8%(-8.90)#6 | 10.9%(-9.00)#416 |
| 7. | Provincetown | 2.2% | 10.8%(-8.60)#7 | 10.9%(-8.70)#556 |
| 8. | Cordaville | 3.0% | 10.8%(-7.80)#8 | 10.9%(-7.90)#1,038 |
| 9. | Bliss Corner | 3.1% | 10.8%(-7.70)#9 | 10.9%(-7.80)#1,096 |
| 10. | Barnstable Town | 3.2% | 10.8%(-7.60)#10 | 10.9%(-7.70)#1,150 |
| 11. | Stoneham | 3.2% | 10.8%(-7.60)#11 | 10.9%(-7.70)#1,156 |
| 12. | Clinton | 3.3% | 10.8%(-7.50)#12 | 10.9%(-7.60)#1,246 |
| 13. | Amesbury Town | 3.6% | 10.8%(-7.20)#13 | 10.9%(-7.30)#1,424 |
| 14. | Harwich Port | 3.6% | 10.8%(-7.20)#14 | 10.9%(-7.30)#1,453 |
| 15. | White Island Shores | 3.6% | 10.8%(-7.20)#15 | 10.9%(-7.30)#1,454 |
| 16. | Medfield | 4.0% | 10.8%(-6.80)#16 | 10.9%(-6.90)#1,699 |
| 17. | Buzzards Bay | 4.0% | 10.8%(-6.80)#17 | 10.9%(-6.90)#1,711 |
| 18. | Norton Center | 4.0% | 10.8%(-6.80)#18 | 10.9%(-6.90)#1,715 |
| 19. | Somerville | 4.2% | 10.8%(-6.60)#19 | 10.9%(-6.70)#1,816 |
| 20. | Danvers | 4.2% | 10.8%(-6.60)#20 | 10.9%(-6.70)#1,819 |
| 21. | Dennis Port | 4.2% | 10.8%(-6.60)#21 | 10.9%(-6.70)#1,851 |
| 22. | Beverly | 4.3% | 10.8%(-6.50)#22 | 10.9%(-6.60)#1,886 |
| 23. | East Sandwich | 4.3% | 10.8%(-6.50)#23 | 10.9%(-6.60)#1,915 |
| 24. | Millis Clicquot | 4.5% | 10.8%(-6.30)#24 | 10.9%(-6.40)#2,061 |
| 25. | Oxford | 4.6% | 10.8%(-6.20)#25 | 10.9%(-6.30)#2,138 |
| 26. | North Lakeville | 4.6% | 10.8%(-6.20)#26 | 10.9%(-6.30)#2,146 |
| 27. | Andover | 4.8% | 10.8%(-6.00)#27 | 10.9%(-6.10)#2,279 |
| 28. | Middleborough Center | 5.1% | 10.8%(-5.70)#28 | 10.9%(-5.80)#2,491 |
| 29. | Wellesley | 5.3% | 10.8%(-5.50)#29 | 10.9%(-5.60)#2,623 |
| 30. | Pocasset | 5.3% | 10.8%(-5.50)#30 | 10.9%(-5.60)#2,668 |
| 31. | Cambridge | 5.4% | 10.8%(-5.40)#31 | 10.9%(-5.50)#2,687 |
| 32. | Brookline | 5.5% | 10.8%(-5.30)#32 | 10.9%(-5.40)#2,771 |
| 33. | Reading | 5.5% | 10.8%(-5.30)#33 | 10.9%(-5.40)#2,778 |
| 34. | Newton | 5.8% | 10.8%(-5.00)#34 | 10.9%(-5.10)#3,005 |
| 35. | North Adams | 5.8% | 10.8%(-5.00)#35 | 10.9%(-5.10)#3,021 |
| 36. | Waltham | 5.9% | 10.8%(-4.90)#36 | 10.9%(-5.00)#3,093 |
| 37. | Swampscott | 5.9% | 10.8%(-4.90)#37 | 10.9%(-5.00)#3,108 |
| 38. | Northwest Harwich | 5.9% | 10.8%(-4.90)#38 | 10.9%(-5.00)#3,124 |
| 39. | Saugus | 6.0% | 10.8%(-4.80)#39 | 10.9%(-4.90)#3,169 |
| 40. | Acushnet Center | 6.0% | 10.8%(-4.80)#40 | 10.9%(-4.90)#3,212 |
| 41. | Braintree Town | 6.3% | 10.8%(-4.50)#41 | 10.9%(-4.60)#3,428 |
| 42. | Belchertown | 6.4% | 10.8%(-4.40)#42 | 10.9%(-4.50)#3,547 |
| 43. | Lowell | 6.5% | 10.8%(-4.30)#43 | 10.9%(-4.40)#3,572 |
| 44. | Peabody | 6.5% | 10.8%(-4.30)#44 | 10.9%(-4.40)#3,576 |
| 45. | Milford | 6.5% | 10.8%(-4.30)#45 | 10.9%(-4.40)#3,581 |
| 46. | Burlington | 6.5% | 10.8%(-4.30)#46 | 10.9%(-4.40)#3,584 |
| 47. | Smith Mills | 6.7% | 10.8%(-4.10)#47 | 10.9%(-4.20)#3,770 |
| 48. | Salem | 6.9% | 10.8%(-3.90)#48 | 10.9%(-4.00)#3,901 |
| 49. | Winthrop Town | 6.9% | 10.8%(-3.90)#49 | 10.9%(-4.00)#3,912 |
| 50. | Devens | 6.9% | 10.8%(-3.90)#50 | 10.9%(-4.00)#3,942 |
| 51. | Greenfield | 7.0% | 10.8%(-3.80)#51 | 10.9%(-3.90)#3,973 |
| 52. | Cochituate | 7.2% | 10.8%(-3.60)#52 | 10.9%(-3.70)#4,140 |
| 53. | Lexington | 7.3% | 10.8%(-3.50)#53 | 10.9%(-3.60)#4,186 |
| 54. | East Falmouth | 7.3% | 10.8%(-3.50)#54 | 10.9%(-3.60)#4,220 |
| 55. | Medford | 7.5% | 10.8%(-3.30)#55 | 10.9%(-3.40)#4,340 |
| 56. | Westfield | 7.7% | 10.8%(-3.10)#56 | 10.9%(-3.20)#4,525 |
| 57. | Milton | 7.7% | 10.8%(-3.10)#57 | 10.9%(-3.20)#4,530 |
| 58. | Gloucester | 7.9% | 10.8%(-2.90)#58 | 10.9%(-3.00)#4,666 |
| 59. | Bridgewater Town | 7.9% | 10.8%(-2.90)#59 | 10.9%(-3.00)#4,667 |
| 60. | Turners Falls | 7.9% | 10.8%(-2.90)#60 | 10.9%(-3.00)#4,703 |
| 61. | Hanscom Afb | 7.9% | 10.8%(-2.90)#61 | 10.9%(-3.00)#4,720 |
| 62. | Pepperell | 8.2% | 10.8%(-2.60)#62 | 10.9%(-2.70)#4,927 |
| 63. | Agawam Town | 8.3% | 10.8%(-2.50)#63 | 10.9%(-2.60)#4,950 |
| 64. | Rutland | 8.4% | 10.8%(-2.40)#64 | 10.9%(-2.50)#5,104 |
| 65. | Wilmington | 8.5% | 10.8%(-2.30)#65 | 10.9%(-2.40)#5,134 |
| 66. | Somerset | 8.5% | 10.8%(-2.30)#66 | 10.9%(-2.40)#5,138 |
| 67. | Attleboro | 8.7% | 10.8%(-2.10)#67 | 10.9%(-2.20)#5,308 |
| 68. | Whitinsville | 8.9% | 10.8%(-1.90)#68 | 10.9%(-2.00)#5,505 |
| 69. | Lynn | 9.1% | 10.8%(-1.70)#69 | 10.9%(-1.80)#5,651 |
| 70. | Weymouth Town | 9.1% | 10.8%(-1.70)#70 | 10.9%(-1.80)#5,656 |
| 71. | Duxbury | 9.5% | 10.8%(-1.30)#71 | 10.9%(-1.40)#6,000 |
| 72. | Haverhill | 9.6% | 10.8%(-1.20)#72 | 10.9%(-1.30)#6,034 |
| 73. | Hudson | 9.6% | 10.8%(-1.20)#73 | 10.9%(-1.30)#6,048 |
| 74. | Chelsea | 9.7% | 10.8%(-1.10)#74 | 10.9%(-1.20)#6,116 |
| 75. | Norwood | 9.7% | 10.8%(-1.10)#75 | 10.9%(-1.20)#6,120 |
| 76. | Framingham | 9.8% | 10.8%(-1.00)#76 | 10.9%(-1.10)#6,192 |
| 77. | Wakefield | 9.8% | 10.8%(-1.00)#77 | 10.9%(-1.10)#6,200 |
| 78. | West Concord | 9.8% | 10.8%(-1.00)#78 | 10.9%(-1.10)#6,215 |
| 79. | Foxborough | 9.8% | 10.8%(-1.00)#79 | 10.9%(-1.10)#6,216 |
| 80. | Leominster | 10.0% | 10.8%(-0.800)#80 | 10.9%(-0.900)#6,348 |
| 81. | Worcester | 10.1% | 10.8%(-0.700)#81 | 10.9%(-0.800)#6,429 |
| 82. | Hatfield | 10.3% | 10.8%(-0.500)#82 | 10.9%(-0.600)#6,637 |
| 83. | Hanson | 10.4% | 10.8%(-0.400)#83 | 10.9%(-0.500)#6,719 |
| 84. | New Bedford | 10.5% | 10.8%(-0.300)#84 | 10.9%(-0.400)#6,737 |
| 85. | North Westport | 10.6% | 10.8%(-0.200)#85 | 10.9%(-0.300)#6,866 |
| 86. | Wareham Center | 10.6% | 10.8%(-0.200)#86 | 10.9%(-0.300)#6,873 |
| 87. | Holbrook | 10.9% | 10.8%(+0.100)#87 | 10.9%(=0.000)#7,052 |
| 88. | Wilbraham | 10.9% | 10.8%(+0.100)#88 | 10.9%(=0.000)#7,063 |
| 89. | Arlington | 11.2% | 10.8%(+0.400)#89 | 10.9%(+0.300)#7,258 |
| 90. | Ware | 11.2% | 10.8%(+0.400)#90 | 10.9%(+0.300)#7,282 |
| 91. | East Harwich | 11.2% | 10.8%(+0.400)#91 | 10.9%(+0.300)#7,287 |
| 92. | Marlborough | 11.4% | 10.8%(+0.600)#92 | 10.9%(+0.500)#7,373 |
| 93. | North Pembroke | 11.4% | 10.8%(+0.600)#93 | 10.9%(+0.500)#7,400 |
| 94. | Northampton | 11.8% | 10.8%(+1.000)#94 | 10.9%(+0.900)#7,645 |
| 95. | North Eastham | 11.8% | 10.8%(+1.000)#95 | 10.9%(+0.900)#7,672 |
| 96. | Taunton | 12.0% | 10.8%(+1.20)#96 | 10.9%(+1.10)#7,750 |
| 97. | Hingham | 12.0% | 10.8%(+1.20)#97 | 10.9%(+1.10)#7,777 |
| 98. | Great Barrington | 12.0% | 10.8%(+1.20)#98 | 10.9%(+1.10)#7,794 |
| 99. | Holyoke | 12.2% | 10.8%(+1.40)#99 | 10.9%(+1.30)#7,872 |
| 100. | Easthampton Town | 12.2% | 10.8%(+1.40)#100 | 10.9%(+1.30)#7,891 |
1
2Common Questions
What are the Top 10 Cities with the Lowest Unemployment Rate Amomg Youth Under the Age of 25 in Massachusetts?
Top 10 Cities with the Lowest Unemployment Rate Amomg Youth Under the Age of 25 in Massachusetts are:
#1
1.2%
#2
1.3%
#3
1.4%
#4
1.7%
#5
1.7%
#6
1.9%
#7
2.2%
#8
3.0%
#9
3.1%
#10
3.2%
What city has the Lowest Unemployment Rate Amomg Youth Under the Age of 25 in Massachusetts?
Williamstown has the Lowest Unemployment Rate Amomg Youth Under the Age of 25 in Massachusetts with 1.2%.
What is the Unemployment Rate Amomg Youth Under the Age of 25 in the State of Massachusetts?
Unemployment Rate Amomg Youth Under the Age of 25 in Massachusetts is 10.8%.
What is the Unemployment Rate Amomg Youth Under the Age of 25 in the United States?
Unemployment Rate Amomg Youth Under the Age of 25 in the United States is 10.9%.