Cities with the Lowest Unemployment Rate Amomg Youth Under the Age of 25 in Kansas
RELATED REPORTS & OPTIONS
Lowest Unemployment | Youth < 25
Kansas
Compare Cities
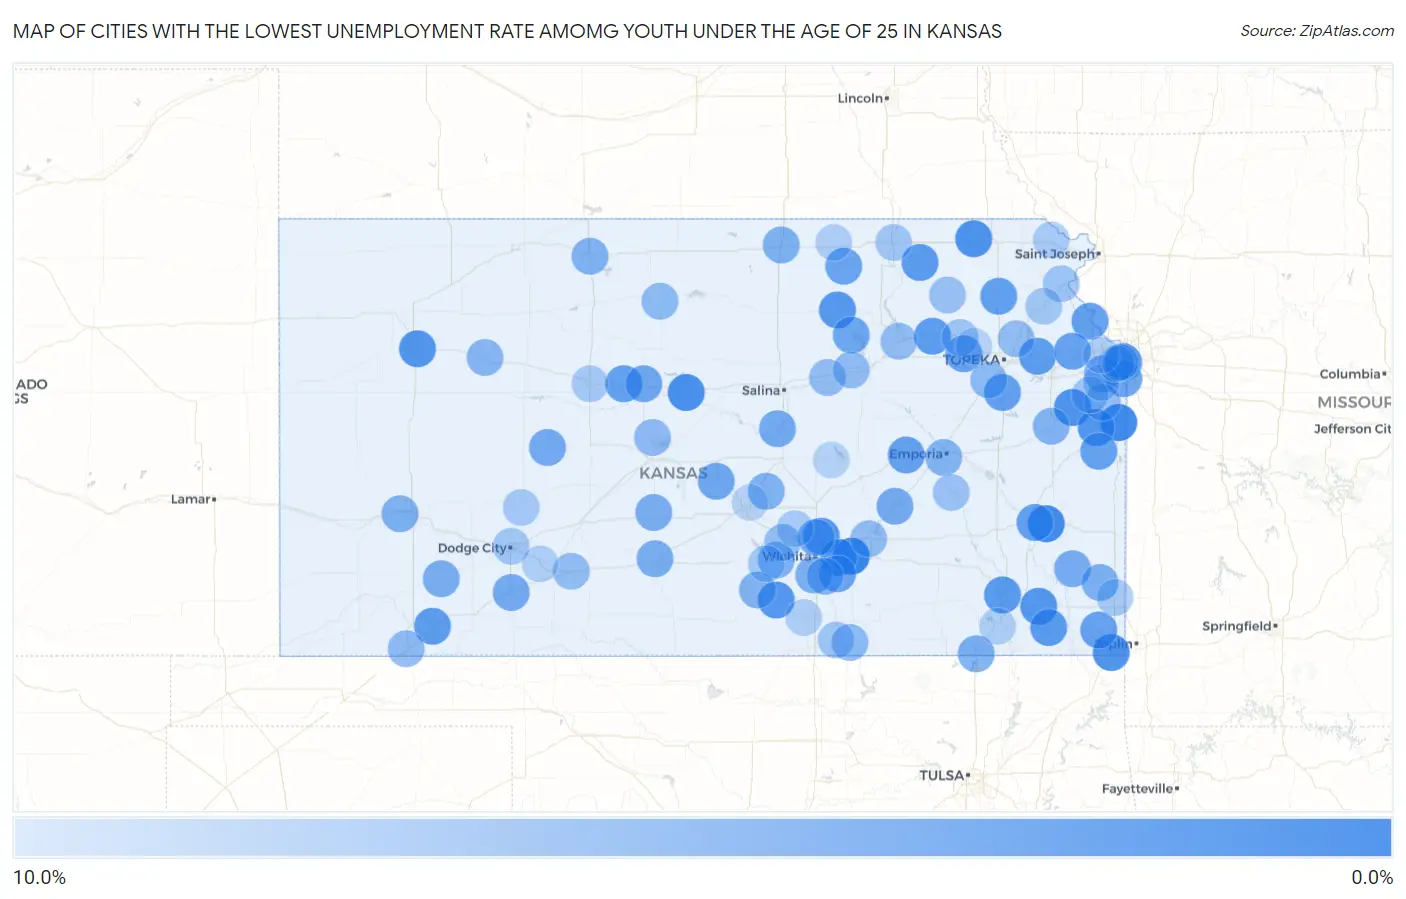
Map of Cities with the Lowest Unemployment Rate Amomg Youth Under the Age of 25 in Kansas
10.0%
0.0%
Cities with the Lowest Unemployment Rate Amomg Youth Under the Age of 25 in Kansas
| City | Youth Unemployment | vs State | vs National | |
| 1. | Augusta | 0.50% | 8.7%(-8.20)#1 | 10.9%(-10.4)#43 |
| 2. | Louisburg | 1.1% | 8.7%(-7.60)#2 | 10.9%(-9.80)#156 |
| 3. | La Harpe | 1.2% | 8.7%(-7.50)#3 | 10.9%(-9.70)#186 |
| 4. | Wilson | 1.6% | 8.7%(-7.10)#4 | 10.9%(-9.30)#297 |
| 5. | Wellsville | 1.8% | 8.7%(-6.90)#5 | 10.9%(-9.10)#387 |
| 6. | Oneida | 1.8% | 8.7%(-6.90)#6 | 10.9%(-9.10)#400 |
| 7. | Baxter Springs | 1.9% | 8.7%(-6.80)#7 | 10.9%(-9.00)#419 |
| 8. | Paola | 2.2% | 8.7%(-6.50)#8 | 10.9%(-8.70)#550 |
| 9. | Oakley | 2.2% | 8.7%(-6.50)#9 | 10.9%(-8.70)#562 |
| 10. | Conway Springs | 2.3% | 8.7%(-6.40)#10 | 10.9%(-8.60)#618 |
| 11. | Parsons | 2.4% | 8.7%(-6.30)#11 | 10.9%(-8.50)#647 |
| 12. | Kechi | 2.4% | 8.7%(-6.30)#12 | 10.9%(-8.50)#668 |
| 13. | Clay Center | 2.5% | 8.7%(-6.20)#13 | 10.9%(-8.40)#720 |
| 14. | Fairway | 2.6% | 8.7%(-6.10)#14 | 10.9%(-8.30)#788 |
| 15. | Neodesha | 2.7% | 8.7%(-6.00)#15 | 10.9%(-8.20)#859 |
| 16. | Altamont | 2.7% | 8.7%(-6.00)#16 | 10.9%(-8.20)#876 |
| 17. | Frankfort | 2.7% | 8.7%(-6.00)#17 | 10.9%(-8.20)#885 |
| 18. | Andover | 2.8% | 8.7%(-5.90)#18 | 10.9%(-8.10)#902 |
| 19. | Wamego | 2.8% | 8.7%(-5.90)#19 | 10.9%(-8.10)#926 |
| 20. | Perry | 2.9% | 8.7%(-5.80)#20 | 10.9%(-8.00)#1,001 |
| 21. | Kismet | 2.9% | 8.7%(-5.80)#21 | 10.9%(-8.00)#1,008 |
| 22. | Holton | 3.1% | 8.7%(-5.60)#22 | 10.9%(-7.80)#1,109 |
| 23. | Leavenworth | 3.2% | 8.7%(-5.50)#23 | 10.9%(-7.70)#1,153 |
| 24. | Iola | 3.2% | 8.7%(-5.50)#24 | 10.9%(-7.70)#1,179 |
| 25. | Carbondale | 3.2% | 8.7%(-5.50)#25 | 10.9%(-7.70)#1,205 |
| 26. | Gorham | 3.2% | 8.7%(-5.50)#26 | 10.9%(-7.70)#1,222 |
| 27. | Tonganoxie | 3.3% | 8.7%(-5.40)#27 | 10.9%(-7.60)#1,248 |
| 28. | Columbus | 3.4% | 8.7%(-5.30)#28 | 10.9%(-7.50)#1,326 |
| 29. | Fontana | 3.4% | 8.7%(-5.30)#29 | 10.9%(-7.50)#1,343 |
| 30. | Maple Hill | 3.5% | 8.7%(-5.20)#30 | 10.9%(-7.40)#1,406 |
| 31. | Strong City | 3.5% | 8.7%(-5.20)#31 | 10.9%(-7.40)#1,409 |
| 32. | Rose Hill | 3.6% | 8.7%(-5.10)#32 | 10.9%(-7.30)#1,446 |
| 33. | Leawood | 3.7% | 8.7%(-5.00)#33 | 10.9%(-7.20)#1,472 |
| 34. | Linn | 3.7% | 8.7%(-5.00)#34 | 10.9%(-7.20)#1,539 |
| 35. | Wakefield | 3.8% | 8.7%(-4.90)#35 | 10.9%(-7.10)#1,600 |
| 36. | Russell | 3.9% | 8.7%(-4.80)#36 | 10.9%(-7.00)#1,641 |
| 37. | Sterling | 4.0% | 8.7%(-4.70)#37 | 10.9%(-6.90)#1,717 |
| 38. | Bazine | 4.1% | 8.7%(-4.60)#38 | 10.9%(-6.80)#1,810 |
| 39. | Lindsborg | 4.2% | 8.7%(-4.50)#39 | 10.9%(-6.70)#1,850 |
| 40. | Minneola | 4.2% | 8.7%(-4.50)#40 | 10.9%(-6.70)#1,878 |
| 41. | Cassoday | 4.3% | 8.7%(-4.40)#41 | 10.9%(-6.60)#1,949 |
| 42. | Lenexa | 4.5% | 8.7%(-4.20)#42 | 10.9%(-6.40)#2,025 |
| 43. | Park City | 4.5% | 8.7%(-4.20)#43 | 10.9%(-6.40)#2,047 |
| 44. | Walnut | 4.5% | 8.7%(-4.20)#44 | 10.9%(-6.40)#2,099 |
| 45. | Pratt | 4.6% | 8.7%(-4.10)#45 | 10.9%(-6.30)#2,135 |
| 46. | Caney | 4.6% | 8.7%(-4.10)#46 | 10.9%(-6.30)#2,160 |
| 47. | St John | 4.6% | 8.7%(-4.10)#47 | 10.9%(-6.30)#2,163 |
| 48. | Copeland | 4.6% | 8.7%(-4.10)#48 | 10.9%(-6.30)#2,170 |
| 49. | Haysville | 4.8% | 8.7%(-3.90)#49 | 10.9%(-6.10)#2,276 |
| 50. | Girard | 4.8% | 8.7%(-3.90)#50 | 10.9%(-6.10)#2,299 |
| 51. | Holcomb | 4.9% | 8.7%(-3.80)#51 | 10.9%(-6.00)#2,370 |
| 52. | Belleville | 4.9% | 8.7%(-3.80)#52 | 10.9%(-6.00)#2,373 |
| 53. | Phillipsburg | 5.0% | 8.7%(-3.70)#53 | 10.9%(-5.90)#2,443 |
| 54. | Buhler | 5.0% | 8.7%(-3.70)#54 | 10.9%(-5.90)#2,449 |
| 55. | Garden Plain | 5.0% | 8.7%(-3.70)#55 | 10.9%(-5.90)#2,453 |
| 56. | Norwich | 5.2% | 8.7%(-3.50)#56 | 10.9%(-5.70)#2,611 |
| 57. | Emporia | 5.3% | 8.7%(-3.40)#57 | 10.9%(-5.60)#2,626 |
| 58. | Ottawa | 5.3% | 8.7%(-3.40)#58 | 10.9%(-5.60)#2,635 |
| 59. | Derby | 5.4% | 8.7%(-3.30)#59 | 10.9%(-5.50)#2,702 |
| 60. | Quinter | 5.5% | 8.7%(-3.20)#60 | 10.9%(-5.40)#2,831 |
| 61. | Osborne | 5.8% | 8.7%(-2.90)#61 | 10.9%(-5.10)#3,060 |
| 62. | Arkansas City | 5.9% | 8.7%(-2.80)#62 | 10.9%(-5.00)#3,111 |
| 63. | Auburn | 5.9% | 8.7%(-2.80)#63 | 10.9%(-5.00)#3,144 |
| 64. | Liberal | 6.0% | 8.7%(-2.70)#64 | 10.9%(-4.90)#3,178 |
| 65. | Hoisington | 6.0% | 8.7%(-2.70)#65 | 10.9%(-4.90)#3,216 |
| 66. | Manhattan | 6.2% | 8.7%(-2.50)#66 | 10.9%(-4.70)#3,330 |
| 67. | El Dorado | 6.2% | 8.7%(-2.50)#67 | 10.9%(-4.70)#3,351 |
| 68. | Spring Hill | 6.2% | 8.7%(-2.50)#68 | 10.9%(-4.70)#3,362 |
| 69. | Abilene | 6.2% | 8.7%(-2.50)#69 | 10.9%(-4.70)#3,365 |
| 70. | Chapman | 6.2% | 8.7%(-2.50)#70 | 10.9%(-4.70)#3,389 |
| 71. | Meriden | 6.2% | 8.7%(-2.50)#71 | 10.9%(-4.70)#3,396 |
| 72. | Mullinville | 6.2% | 8.7%(-2.50)#72 | 10.9%(-4.70)#3,414 |
| 73. | Andale | 6.4% | 8.7%(-2.30)#73 | 10.9%(-4.50)#3,563 |
| 74. | Roeland Park | 6.5% | 8.7%(-2.20)#74 | 10.9%(-4.40)#3,608 |
| 75. | Onaga | 6.6% | 8.7%(-2.10)#75 | 10.9%(-4.30)#3,716 |
| 76. | Madison | 6.8% | 8.7%(-1.90)#76 | 10.9%(-4.10)#3,873 |
| 77. | Atchison | 6.9% | 8.7%(-1.80)#77 | 10.9%(-4.00)#3,918 |
| 78. | Gardner | 7.1% | 8.7%(-1.60)#78 | 10.9%(-3.80)#4,028 |
| 79. | St Marys | 7.1% | 8.7%(-1.60)#79 | 10.9%(-3.80)#4,051 |
| 80. | Geuda Springs | 7.1% | 8.7%(-1.60)#80 | 10.9%(-3.80)#4,097 |
| 81. | Dodge City | 7.2% | 8.7%(-1.50)#81 | 10.9%(-3.70)#4,116 |
| 82. | Marysville | 7.2% | 8.7%(-1.50)#82 | 10.9%(-3.70)#4,154 |
| 83. | Nortonville | 7.3% | 8.7%(-1.40)#83 | 10.9%(-3.60)#4,245 |
| 84. | Hays | 7.4% | 8.7%(-1.30)#84 | 10.9%(-3.50)#4,268 |
| 85. | Cheney | 7.4% | 8.7%(-1.30)#85 | 10.9%(-3.50)#4,303 |
| 86. | Jetmore | 7.5% | 8.7%(-1.20)#86 | 10.9%(-3.40)#4,398 |
| 87. | Olathe | 7.6% | 8.7%(-1.10)#87 | 10.9%(-3.30)#4,405 |
| 88. | Pittsburg | 7.6% | 8.7%(-1.10)#88 | 10.9%(-3.30)#4,420 |
| 89. | Bentley | 7.6% | 8.7%(-1.10)#89 | 10.9%(-3.30)#4,487 |
| 90. | Highland | 7.7% | 8.7%(-1.000)#90 | 10.9%(-3.20)#4,584 |
| 91. | Merriam | 7.9% | 8.7%(-0.800)#91 | 10.9%(-3.00)#4,684 |
| 92. | Independence | 7.9% | 8.7%(-0.800)#92 | 10.9%(-3.00)#4,688 |
| 93. | Wellington | 8.0% | 8.7%(-0.700)#93 | 10.9%(-2.90)#4,774 |
| 94. | Morrowville | 8.0% | 8.7%(-0.700)#94 | 10.9%(-2.90)#4,801 |
| 95. | Edwardsville | 8.1% | 8.7%(-0.600)#95 | 10.9%(-2.80)#4,846 |
| 96. | Ford | 8.1% | 8.7%(-0.600)#96 | 10.9%(-2.80)#4,879 |
| 97. | Mission | 8.2% | 8.7%(-0.500)#97 | 10.9%(-2.70)#4,899 |
| 98. | Hillsboro | 8.4% | 8.7%(-0.300)#98 | 10.9%(-2.50)#5,086 |
| 99. | Hutchinson | 8.5% | 8.7%(-0.200)#99 | 10.9%(-2.40)#5,128 |
| 100. | Rossville | 8.5% | 8.7%(-0.200)#100 | 10.9%(-2.40)#5,180 |
Common Questions
What are the Top 10 Cities with the Lowest Unemployment Rate Amomg Youth Under the Age of 25 in Kansas?
Top 10 Cities with the Lowest Unemployment Rate Amomg Youth Under the Age of 25 in Kansas are:
#1
0.50%
#2
1.1%
#3
1.2%
#4
1.6%
#5
1.8%
#6
1.8%
#7
1.9%
#8
2.2%
#9
2.2%
#10
2.3%
What city has the Lowest Unemployment Rate Amomg Youth Under the Age of 25 in Kansas?
Augusta has the Lowest Unemployment Rate Amomg Youth Under the Age of 25 in Kansas with 0.50%.
What is the Unemployment Rate Amomg Youth Under the Age of 25 in the State of Kansas?
Unemployment Rate Amomg Youth Under the Age of 25 in Kansas is 8.7%.
What is the Unemployment Rate Amomg Youth Under the Age of 25 in the United States?
Unemployment Rate Amomg Youth Under the Age of 25 in the United States is 10.9%.