Cities with the Lowest Unemployment Rate Amomg Youth Under the Age of 25 in Pennsylvania
RELATED REPORTS & OPTIONS
Lowest Unemployment | Youth < 25
Pennsylvania
Compare Cities
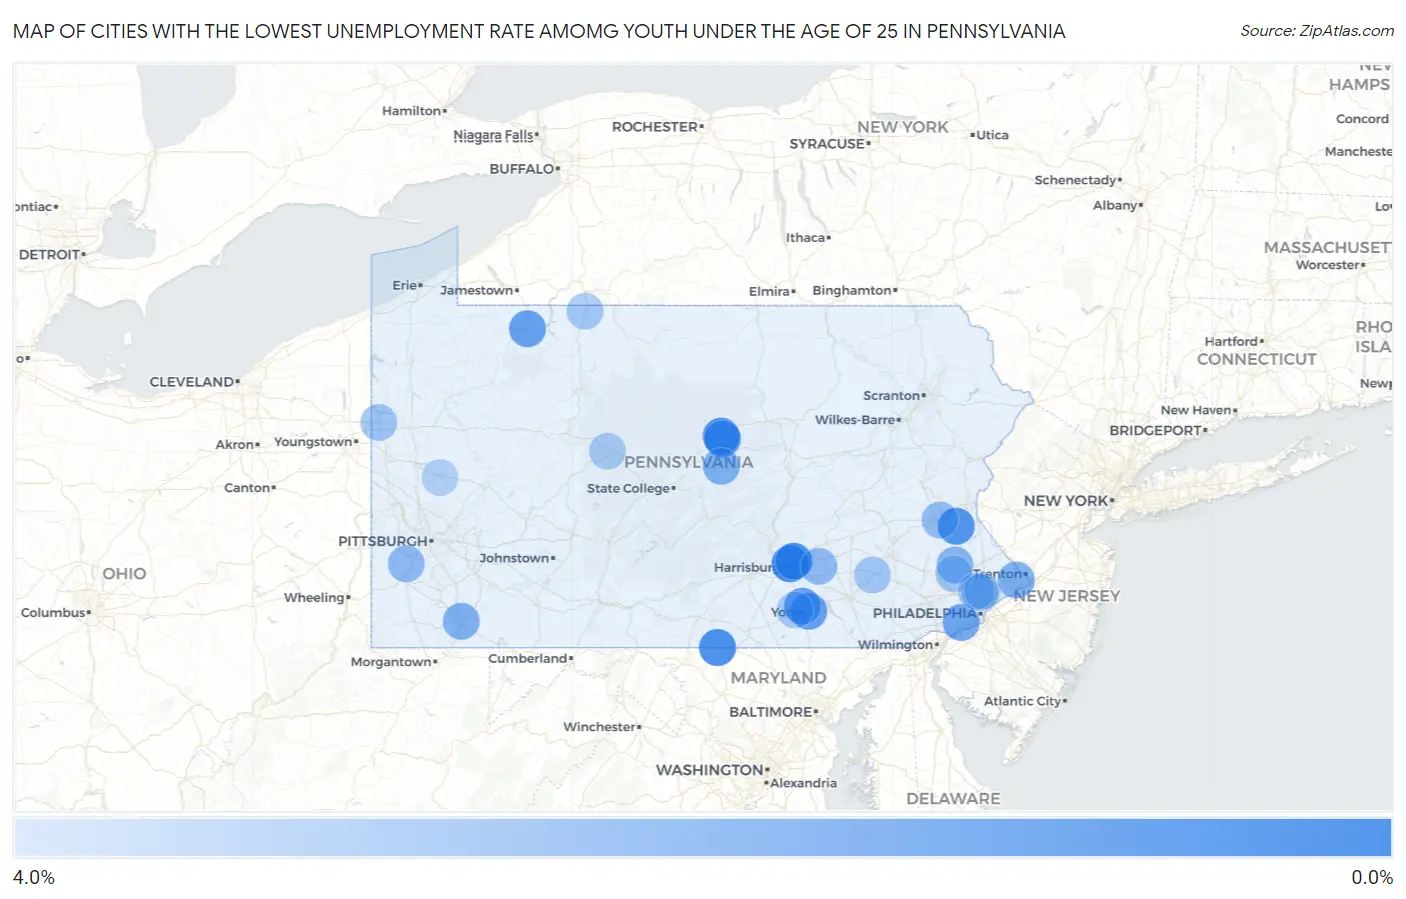
Map of Cities with the Lowest Unemployment Rate Amomg Youth Under the Age of 25 in Pennsylvania
4.0%
0.0%
Cities with the Lowest Unemployment Rate Amomg Youth Under the Age of 25 in Pennsylvania
| City | Youth Unemployment | vs State | vs National | |
| 1. | Palmerton Borough | 0.20% | 11.1%(-10.9)#1 | 10.9%(-10.7)#9 |
| 2. | Westmont Borough | 0.40% | 11.1%(-10.7)#2 | 10.9%(-10.5)#30 |
| 3. | Progress | 0.50% | 11.1%(-10.6)#3 | 10.9%(-10.4)#40 |
| 4. | Lock Haven | 0.60% | 11.1%(-10.5)#4 | 10.9%(-10.3)#52 |
| 5. | New Brighton Borough | 0.60% | 11.1%(-10.5)#5 | 10.9%(-10.3)#56 |
| 6. | Colonial Park | 0.70% | 11.1%(-10.4)#6 | 10.9%(-10.2)#64 |
| 7. | Blue Ridge Summit | 0.70% | 11.1%(-10.4)#7 | 10.9%(-10.2)#78 |
| 8. | Lewisburg Borough | 0.90% | 11.1%(-10.2)#8 | 10.9%(-10.00)#103 |
| 9. | New Wilmington Borough | 0.90% | 11.1%(-10.2)#9 | 10.9%(-10.00)#110 |
| 10. | Elizabethville Borough | 0.90% | 11.1%(-10.2)#10 | 10.9%(-10.00)#113 |
| 11. | Desales University | 0.90% | 11.1%(-10.2)#11 | 10.9%(-10.00)#115 |
| 12. | Bloomfield Borough | 1.1% | 11.1%(-10.00)#12 | 10.9%(-9.80)#160 |
| 13. | East York | 1.3% | 11.1%(-9.80)#13 | 10.9%(-9.60)#194 |
| 14. | West View Borough | 1.3% | 11.1%(-9.80)#14 | 10.9%(-9.60)#197 |
| 15. | Selinsgrove Borough | 1.4% | 11.1%(-9.70)#15 | 10.9%(-9.50)#226 |
| 16. | Emigsville | 1.4% | 11.1%(-9.70)#16 | 10.9%(-9.50)#229 |
| 17. | Castanea | 1.4% | 11.1%(-9.70)#17 | 10.9%(-9.50)#233 |
| 18. | Pringle Borough | 1.4% | 11.1%(-9.70)#18 | 10.9%(-9.50)#234 |
| 19. | Wyomissing Borough | 1.5% | 11.1%(-9.60)#19 | 10.9%(-9.40)#242 |
| 20. | Warren | 1.5% | 11.1%(-9.60)#20 | 10.9%(-9.40)#246 |
| 21. | Shippensburg Borough | 1.5% | 11.1%(-9.60)#21 | 10.9%(-9.40)#251 |
| 22. | Saxonburg Borough | 1.5% | 11.1%(-9.60)#22 | 10.9%(-9.40)#267 |
| 23. | Atglen Borough | 1.5% | 11.1%(-9.60)#23 | 10.9%(-9.40)#270 |
| 24. | Lincoln Borough | 1.5% | 11.1%(-9.60)#24 | 10.9%(-9.40)#272 |
| 25. | Folsom | 1.7% | 11.1%(-9.40)#25 | 10.9%(-9.20)#319 |
| 26. | Bedford Borough | 1.7% | 11.1%(-9.40)#26 | 10.9%(-9.20)#332 |
| 27. | Jermyn Borough | 1.7% | 11.1%(-9.40)#27 | 10.9%(-9.20)#336 |
| 28. | Lyons Borough | 1.7% | 11.1%(-9.40)#28 | 10.9%(-9.20)#349 |
| 29. | Elverson Borough | 1.8% | 11.1%(-9.30)#29 | 10.9%(-9.10)#390 |
| 30. | Stockertown Borough | 1.8% | 11.1%(-9.30)#30 | 10.9%(-9.10)#395 |
| 31. | Glenolden Borough | 1.9% | 11.1%(-9.20)#31 | 10.9%(-9.00)#410 |
| 32. | Milesburg Borough | 1.9% | 11.1%(-9.20)#32 | 10.9%(-9.00)#426 |
| 33. | Avalon Borough | 2.0% | 11.1%(-9.10)#33 | 10.9%(-8.90)#456 |
| 34. | South Coatesville Borough | 2.0% | 11.1%(-9.10)#34 | 10.9%(-8.90)#468 |
| 35. | Fairless Hills | 2.1% | 11.1%(-9.00)#35 | 10.9%(-8.80)#494 |
| 36. | Carnegie Borough | 2.1% | 11.1%(-9.00)#36 | 10.9%(-8.80)#496 |
| 37. | Palmyra Borough | 2.1% | 11.1%(-9.00)#37 | 10.9%(-8.80)#497 |
| 38. | Rosemont | 2.1% | 11.1%(-9.00)#38 | 10.9%(-8.80)#506 |
| 39. | Port Royal Borough | 2.1% | 11.1%(-9.00)#39 | 10.9%(-8.80)#528 |
| 40. | Uniontown | 2.2% | 11.1%(-8.90)#40 | 10.9%(-8.70)#538 |
| 41. | Coopersburg Borough | 2.2% | 11.1%(-8.90)#41 | 10.9%(-8.70)#560 |
| 42. | Bernville Borough | 2.2% | 11.1%(-8.90)#42 | 10.9%(-8.70)#571 |
| 43. | Rebersburg | 2.2% | 11.1%(-8.90)#43 | 10.9%(-8.70)#575 |
| 44. | Franklin Park Borough | 2.3% | 11.1%(-8.80)#44 | 10.9%(-8.60)#587 |
| 45. | Swissvale Borough | 2.3% | 11.1%(-8.80)#45 | 10.9%(-8.60)#597 |
| 46. | Old Forge Borough | 2.3% | 11.1%(-8.80)#46 | 10.9%(-8.60)#598 |
| 47. | Leesport Borough | 2.3% | 11.1%(-8.80)#47 | 10.9%(-8.60)#613 |
| 48. | Elizabethtown Borough | 2.4% | 11.1%(-8.70)#48 | 10.9%(-8.50)#644 |
| 49. | Harleysville | 2.4% | 11.1%(-8.70)#49 | 10.9%(-8.50)#650 |
| 50. | Bellefonte Borough | 2.4% | 11.1%(-8.70)#50 | 10.9%(-8.50)#655 |
| 51. | Ferndale Borough | 2.4% | 11.1%(-8.70)#51 | 10.9%(-8.50)#682 |
| 52. | Snow Shoe Borough | 2.5% | 11.1%(-8.60)#52 | 10.9%(-8.40)#750 |
| 53. | Oakmont Borough | 2.6% | 11.1%(-8.50)#53 | 10.9%(-8.30)#776 |
| 54. | Prospect Park Borough | 2.6% | 11.1%(-8.50)#54 | 10.9%(-8.30)#780 |
| 55. | Campbelltown | 2.6% | 11.1%(-8.50)#55 | 10.9%(-8.30)#781 |
| 56. | West Grove Borough | 2.6% | 11.1%(-8.50)#56 | 10.9%(-8.30)#797 |
| 57. | Muse | 2.6% | 11.1%(-8.50)#57 | 10.9%(-8.30)#800 |
| 58. | Arcadia University | 2.6% | 11.1%(-8.50)#58 | 10.9%(-8.30)#817 |
| 59. | Coraopolis Borough | 2.7% | 11.1%(-8.40)#59 | 10.9%(-8.20)#843 |
| 60. | Shillington Borough | 2.7% | 11.1%(-8.40)#60 | 10.9%(-8.20)#845 |
| 61. | Dorneyville | 2.7% | 11.1%(-8.40)#61 | 10.9%(-8.20)#846 |
| 62. | Adamstown Borough | 2.7% | 11.1%(-8.40)#62 | 10.9%(-8.20)#858 |
| 63. | Hallstead Borough | 2.7% | 11.1%(-8.40)#63 | 10.9%(-8.20)#871 |
| 64. | Freeburg Borough | 2.7% | 11.1%(-8.40)#64 | 10.9%(-8.20)#882 |
| 65. | Royersford Borough | 2.8% | 11.1%(-8.30)#65 | 10.9%(-8.10)#924 |
| 66. | Newtown Borough | 2.9% | 11.1%(-8.20)#66 | 10.9%(-8.00)#990 |
| 67. | East Washington Borough | 2.9% | 11.1%(-8.20)#67 | 10.9%(-8.00)#993 |
| 68. | Hermitage | 3.0% | 11.1%(-8.10)#68 | 10.9%(-7.90)#1,016 |
| 69. | Lititz Borough | 3.0% | 11.1%(-8.10)#69 | 10.9%(-7.90)#1,022 |
| 70. | Ellwood City Borough | 3.0% | 11.1%(-8.10)#70 | 10.9%(-7.90)#1,025 |
| 71. | Archbald Borough | 3.0% | 11.1%(-8.10)#71 | 10.9%(-7.90)#1,028 |
| 72. | Avoca Borough | 3.0% | 11.1%(-8.10)#72 | 10.9%(-7.90)#1,040 |
| 73. | Honey Brook Borough | 3.0% | 11.1%(-8.10)#73 | 10.9%(-7.90)#1,047 |
| 74. | Flemington Borough | 3.0% | 11.1%(-8.10)#74 | 10.9%(-7.90)#1,054 |
| 75. | Williamstown Borough | 3.0% | 11.1%(-8.10)#75 | 10.9%(-7.90)#1,059 |
| 76. | Doylestown Borough | 3.1% | 11.1%(-8.00)#76 | 10.9%(-7.80)#1,089 |
| 77. | Reamstown | 3.1% | 11.1%(-8.00)#77 | 10.9%(-7.80)#1,107 |
| 78. | New Oxford Borough | 3.1% | 11.1%(-8.00)#78 | 10.9%(-7.80)#1,123 |
| 79. | Mount Joy Borough | 3.2% | 11.1%(-7.90)#79 | 10.9%(-7.70)#1,171 |
| 80. | Bradford | 3.2% | 11.1%(-7.90)#80 | 10.9%(-7.70)#1,172 |
| 81. | Skippack | 3.2% | 11.1%(-7.90)#81 | 10.9%(-7.70)#1,184 |
| 82. | Highspire Borough | 3.2% | 11.1%(-7.90)#82 | 10.9%(-7.70)#1,189 |
| 83. | University Of Pittsburgh Bradford | 3.2% | 11.1%(-7.90)#83 | 10.9%(-7.70)#1,212 |
| 84. | Chambersburg Borough | 3.3% | 11.1%(-7.80)#84 | 10.9%(-7.60)#1,230 |
| 85. | Shiloh | 3.3% | 11.1%(-7.80)#85 | 10.9%(-7.60)#1,237 |
| 86. | Brentwood Borough | 3.3% | 11.1%(-7.80)#86 | 10.9%(-7.60)#1,240 |
| 87. | Canton Borough | 3.3% | 11.1%(-7.80)#87 | 10.9%(-7.60)#1,261 |
| 88. | Dravosburg Borough | 3.3% | 11.1%(-7.80)#88 | 10.9%(-7.60)#1,264 |
| 89. | Plymptonville | 3.3% | 11.1%(-7.80)#89 | 10.9%(-7.60)#1,268 |
| 90. | Bridgewater Borough | 3.3% | 11.1%(-7.80)#90 | 10.9%(-7.60)#1,271 |
| 91. | Bendersville Borough | 3.3% | 11.1%(-7.80)#91 | 10.9%(-7.60)#1,274 |
| 92. | West Pittston Borough | 3.4% | 11.1%(-7.70)#92 | 10.9%(-7.50)#1,319 |
| 93. | Flourtown | 3.4% | 11.1%(-7.70)#93 | 10.9%(-7.50)#1,321 |
| 94. | Homeacre Lyndora | 3.5% | 11.1%(-7.60)#94 | 10.9%(-7.40)#1,363 |
| 95. | Blooming Valley Borough | 3.5% | 11.1%(-7.60)#95 | 10.9%(-7.40)#1,413 |
| 96. | New Albany Borough | 3.5% | 11.1%(-7.60)#96 | 10.9%(-7.40)#1,414 |
| 97. | Jefferson Hills Borough | 3.6% | 11.1%(-7.50)#97 | 10.9%(-7.30)#1,430 |
| 98. | Silverdale Borough | 3.6% | 11.1%(-7.50)#98 | 10.9%(-7.30)#1,465 |
| 99. | Grove City Borough | 3.7% | 11.1%(-7.40)#99 | 10.9%(-7.20)#1,488 |
| 100. | Glenside | 3.7% | 11.1%(-7.40)#100 | 10.9%(-7.20)#1,489 |
Common Questions
What are the Top 10 Cities with the Lowest Unemployment Rate Amomg Youth Under the Age of 25 in Pennsylvania?
Top 10 Cities with the Lowest Unemployment Rate Amomg Youth Under the Age of 25 in Pennsylvania are:
#1
0.50%
#2
0.60%
#3
0.70%
#4
0.70%
#5
0.90%
#6
1.3%
#7
1.4%
#8
1.4%
#9
1.5%
#10
1.7%
What city has the Lowest Unemployment Rate Amomg Youth Under the Age of 25 in Pennsylvania?
Progress has the Lowest Unemployment Rate Amomg Youth Under the Age of 25 in Pennsylvania with 0.50%.
What is the Unemployment Rate Amomg Youth Under the Age of 25 in the State of Pennsylvania?
Unemployment Rate Amomg Youth Under the Age of 25 in Pennsylvania is 11.1%.
What is the Unemployment Rate Amomg Youth Under the Age of 25 in the United States?
Unemployment Rate Amomg Youth Under the Age of 25 in the United States is 10.9%.