Cities with the Lowest Unemployment Rate Amomg Youth Under the Age of 25 in New York
RELATED REPORTS & OPTIONS
Lowest Unemployment | Youth < 25
New York
Compare Cities
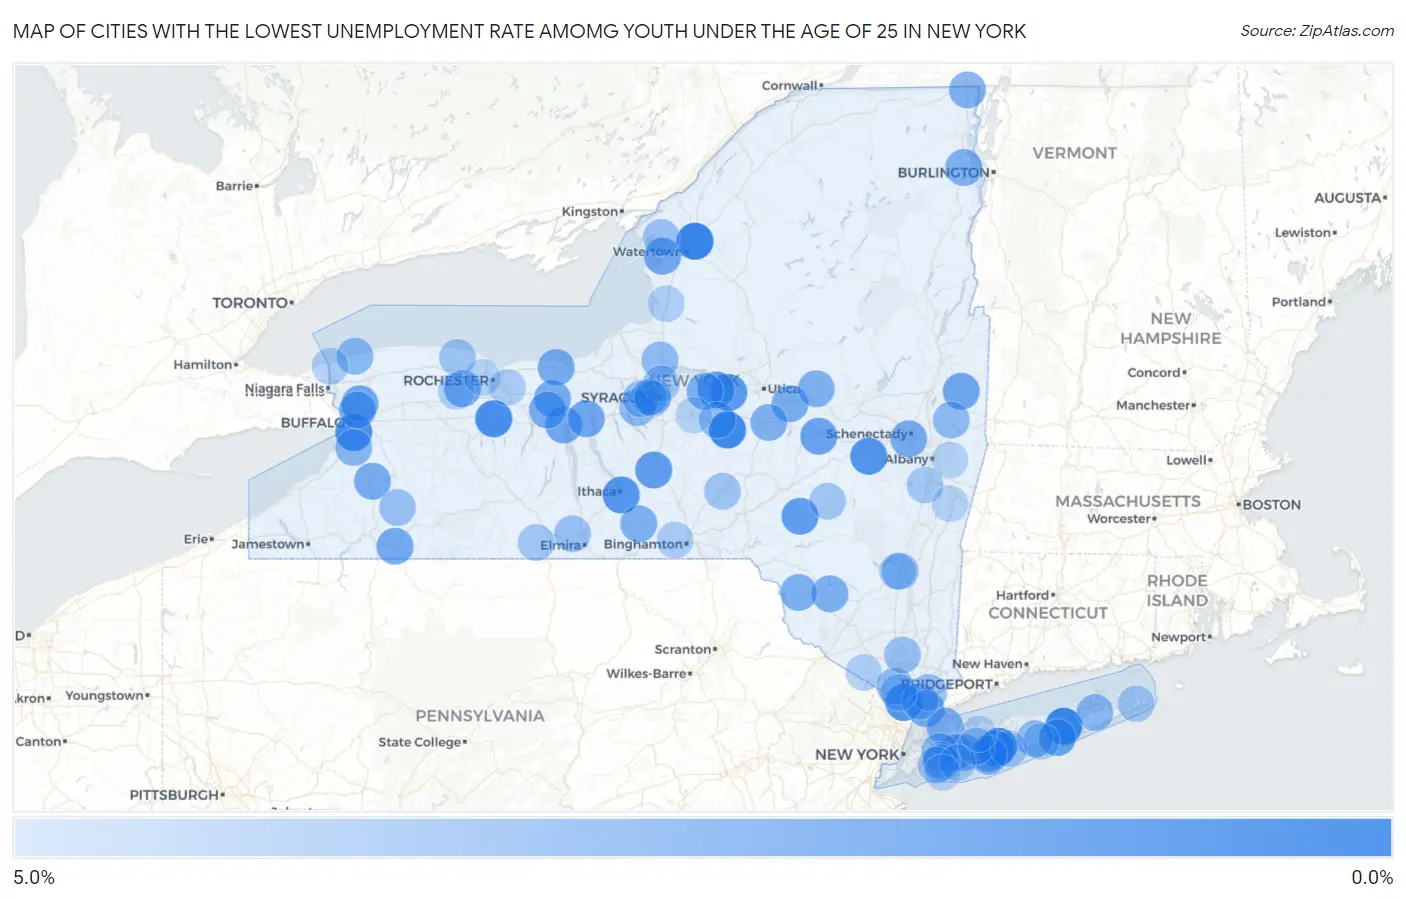
Map of Cities with the Lowest Unemployment Rate Amomg Youth Under the Age of 25 in New York
5.0%
0.0%
Cities with the Lowest Unemployment Rate Amomg Youth Under the Age of 25 in New York
| City | Youth Unemployment | vs State | vs National | |
| 1. | Calcium | 0.30% | 13.2%(-12.9)#1 | 10.9%(-10.6)#19 |
| 2. | Flanders | 0.40% | 13.2%(-12.8)#2 | 10.9%(-10.5)#27 |
| 3. | Hamilton | 0.50% | 13.2%(-12.7)#3 | 10.9%(-10.4)#46 |
| 4. | North Great River | 0.50% | 13.2%(-12.7)#4 | 10.9%(-10.4)#47 |
| 5. | Lima | 0.80% | 13.2%(-12.4)#5 | 10.9%(-10.1)#94 |
| 6. | Lackawanna | 1.0% | 13.2%(-12.2)#6 | 10.9%(-9.90)#122 |
| 7. | Pearl River | 1.2% | 13.2%(-12.0)#7 | 10.9%(-9.70)#168 |
| 8. | Schoharie | 1.2% | 13.2%(-12.0)#8 | 10.9%(-9.70)#184 |
| 9. | South Hill | 1.3% | 13.2%(-11.9)#9 | 10.9%(-9.60)#198 |
| 10. | Islip Terrace | 1.3% | 13.2%(-11.9)#10 | 10.9%(-9.60)#201 |
| 11. | Vernon | 1.5% | 13.2%(-11.7)#11 | 10.9%(-9.40)#268 |
| 12. | Oneida | 1.7% | 13.2%(-11.5)#12 | 10.9%(-9.20)#317 |
| 13. | Delhi | 1.7% | 13.2%(-11.5)#13 | 10.9%(-9.20)#331 |
| 14. | Munsons Corners | 1.7% | 13.2%(-11.5)#14 | 10.9%(-9.20)#333 |
| 15. | Westhampton | 2.0% | 13.2%(-11.2)#15 | 10.9%(-8.90)#460 |
| 16. | Niagara University | 2.0% | 13.2%(-11.2)#16 | 10.9%(-8.90)#476 |
| 17. | Cherry Valley | 2.0% | 13.2%(-11.2)#17 | 10.9%(-8.90)#478 |
| 18. | University At Buffalo | 2.2% | 13.2%(-11.0)#18 | 10.9%(-8.70)#548 |
| 19. | Greenwich | 2.2% | 13.2%(-11.0)#19 | 10.9%(-8.70)#565 |
| 20. | Geneva | 2.3% | 13.2%(-10.9)#20 | 10.9%(-8.60)#589 |
| 21. | Seneca Falls | 2.3% | 13.2%(-10.9)#21 | 10.9%(-8.60)#601 |
| 22. | Sackets Harbor | 2.3% | 13.2%(-10.9)#22 | 10.9%(-8.60)#620 |
| 23. | Nazareth College | 2.3% | 13.2%(-10.9)#23 | 10.9%(-8.60)#623 |
| 24. | Newark | 2.4% | 13.2%(-10.8)#24 | 10.9%(-8.50)#649 |
| 25. | St Bonaventure | 2.4% | 13.2%(-10.8)#25 | 10.9%(-8.50)#675 |
| 26. | Rotterdam | 2.5% | 13.2%(-10.7)#26 | 10.9%(-8.40)#701 |
| 27. | Carmel | 2.5% | 13.2%(-10.7)#27 | 10.9%(-8.40)#713 |
| 28. | Springville | 2.5% | 13.2%(-10.7)#28 | 10.9%(-8.40)#719 |
| 29. | Clifton Springs | 2.5% | 13.2%(-10.7)#29 | 10.9%(-8.40)#737 |
| 30. | Sodus | 2.5% | 13.2%(-10.7)#30 | 10.9%(-8.40)#740 |
| 31. | Churchville | 2.5% | 13.2%(-10.7)#31 | 10.9%(-8.40)#741 |
| 32. | Eggertsville | 2.6% | 13.2%(-10.6)#32 | 10.9%(-8.30)#763 |
| 33. | Solvay | 2.6% | 13.2%(-10.6)#33 | 10.9%(-8.30)#779 |
| 34. | Hartsdale | 2.6% | 13.2%(-10.6)#34 | 10.9%(-8.30)#794 |
| 35. | Mohawk | 2.6% | 13.2%(-10.6)#35 | 10.9%(-8.30)#799 |
| 36. | Loudonville | 2.7% | 13.2%(-10.5)#36 | 10.9%(-8.20)#835 |
| 37. | Plainedge | 2.7% | 13.2%(-10.5)#37 | 10.9%(-8.20)#838 |
| 38. | Canastota | 2.7% | 13.2%(-10.5)#38 | 10.9%(-8.20)#847 |
| 39. | Keeseville | 2.7% | 13.2%(-10.5)#39 | 10.9%(-8.20)#857 |
| 40. | Loch Sheldrake | 2.7% | 13.2%(-10.5)#40 | 10.9%(-8.20)#867 |
| 41. | Candor | 2.7% | 13.2%(-10.5)#41 | 10.9%(-8.20)#881 |
| 42. | Jeffersonville | 2.7% | 13.2%(-10.5)#42 | 10.9%(-8.20)#891 |
| 43. | Glen Cove | 2.8% | 13.2%(-10.4)#43 | 10.9%(-8.10)#896 |
| 44. | Dolgeville | 2.8% | 13.2%(-10.4)#44 | 10.9%(-8.10)#932 |
| 45. | West Winfield | 2.8% | 13.2%(-10.4)#45 | 10.9%(-8.10)#947 |
| 46. | West Bay Shore | 2.9% | 13.2%(-10.3)#46 | 10.9%(-8.00)#975 |
| 47. | Champlain | 2.9% | 13.2%(-10.3)#47 | 10.9%(-8.00)#1,000 |
| 48. | East Meadow | 3.0% | 13.2%(-10.2)#48 | 10.9%(-7.90)#1,012 |
| 49. | Hamburg | 3.1% | 13.2%(-10.1)#49 | 10.9%(-7.80)#1,084 |
| 50. | Brightwaters | 3.1% | 13.2%(-10.1)#50 | 10.9%(-7.80)#1,110 |
| 51. | New Hyde Park | 3.2% | 13.2%(-10.00)#51 | 10.9%(-7.70)#1,166 |
| 52. | Noyack | 3.2% | 13.2%(-10.00)#52 | 10.9%(-7.70)#1,180 |
| 53. | Marcellus | 3.2% | 13.2%(-10.00)#53 | 10.9%(-7.70)#1,196 |
| 54. | Hamilton College | 3.2% | 13.2%(-10.00)#54 | 10.9%(-7.70)#1,199 |
| 55. | Wilson | 3.2% | 13.2%(-10.00)#55 | 10.9%(-7.70)#1,207 |
| 56. | Hillside | 3.2% | 13.2%(-10.00)#56 | 10.9%(-7.70)#1,215 |
| 57. | Mastic | 3.3% | 13.2%(-9.90)#57 | 10.9%(-7.60)#1,232 |
| 58. | Wesley Hills | 3.4% | 13.2%(-9.80)#58 | 10.9%(-7.50)#1,309 |
| 59. | Vassar College | 3.4% | 13.2%(-9.80)#59 | 10.9%(-7.50)#1,325 |
| 60. | Central Square | 3.4% | 13.2%(-9.80)#60 | 10.9%(-7.50)#1,330 |
| 61. | Camillus | 3.4% | 13.2%(-9.80)#61 | 10.9%(-7.50)#1,337 |
| 62. | Schaghticoke | 3.4% | 13.2%(-9.80)#62 | 10.9%(-7.50)#1,341 |
| 63. | Morrisville | 3.5% | 13.2%(-9.70)#63 | 10.9%(-7.40)#1,392 |
| 64. | Thornwood | 3.6% | 13.2%(-9.60)#64 | 10.9%(-7.30)#1,444 |
| 65. | West Point | 3.7% | 13.2%(-9.50)#65 | 10.9%(-7.20)#1,493 |
| 66. | Big Flats | 3.7% | 13.2%(-9.50)#66 | 10.9%(-7.20)#1,494 |
| 67. | Wheatley Heights | 3.7% | 13.2%(-9.50)#67 | 10.9%(-7.20)#1,495 |
| 68. | Franklinville | 3.7% | 13.2%(-9.50)#68 | 10.9%(-7.20)#1,512 |
| 69. | Chaumont | 3.7% | 13.2%(-9.50)#69 | 10.9%(-7.20)#1,530 |
| 70. | Tarrytown | 3.8% | 13.2%(-9.40)#70 | 10.9%(-7.10)#1,556 |
| 71. | Malverne | 3.8% | 13.2%(-9.40)#71 | 10.9%(-7.10)#1,562 |
| 72. | Hamlin | 3.8% | 13.2%(-9.40)#72 | 10.9%(-7.10)#1,575 |
| 73. | Lake Delta | 3.8% | 13.2%(-9.40)#73 | 10.9%(-7.10)#1,584 |
| 74. | Oxford | 3.9% | 13.2%(-9.30)#74 | 10.9%(-7.00)#1,651 |
| 75. | Spring Valley | 4.0% | 13.2%(-9.20)#75 | 10.9%(-6.90)#1,674 |
| 76. | Lynbrook | 4.0% | 13.2%(-9.20)#76 | 10.9%(-6.90)#1,677 |
| 77. | North Syracuse | 4.0% | 13.2%(-9.20)#77 | 10.9%(-6.90)#1,696 |
| 78. | Addison | 4.0% | 13.2%(-9.20)#78 | 10.9%(-6.90)#1,723 |
| 79. | Hobart | 4.0% | 13.2%(-9.20)#79 | 10.9%(-6.90)#1,745 |
| 80. | Woodmere | 4.1% | 13.2%(-9.10)#80 | 10.9%(-6.80)#1,758 |
| 81. | Montauk | 4.1% | 13.2%(-9.10)#81 | 10.9%(-6.80)#1,785 |
| 82. | Ravena | 4.1% | 13.2%(-9.10)#82 | 10.9%(-6.80)#1,791 |
| 83. | Sayville | 4.2% | 13.2%(-9.00)#83 | 10.9%(-6.70)#1,829 |
| 84. | Endwell | 4.3% | 13.2%(-8.90)#84 | 10.9%(-6.60)#1,897 |
| 85. | Center Moriches | 4.3% | 13.2%(-8.90)#85 | 10.9%(-6.60)#1,903 |
| 86. | Youngstown | 4.3% | 13.2%(-8.90)#86 | 10.9%(-6.60)#1,929 |
| 87. | Warwick | 4.4% | 13.2%(-8.80)#87 | 10.9%(-6.50)#1,977 |
| 88. | East Rochester | 4.4% | 13.2%(-8.80)#88 | 10.9%(-6.50)#1,978 |
| 89. | Bellmore | 4.5% | 13.2%(-8.70)#89 | 10.9%(-6.40)#2,034 |
| 90. | Westvale | 4.5% | 13.2%(-8.70)#90 | 10.9%(-6.40)#2,059 |
| 91. | Hurley | 4.5% | 13.2%(-8.70)#91 | 10.9%(-6.40)#2,063 |
| 92. | Bergen | 4.5% | 13.2%(-8.70)#92 | 10.9%(-6.40)#2,080 |
| 93. | Sandy Creek | 4.5% | 13.2%(-8.70)#93 | 10.9%(-6.40)#2,091 |
| 94. | North Gates | 4.6% | 13.2%(-8.60)#94 | 10.9%(-6.30)#2,127 |
| 95. | West Sand Lake | 4.6% | 13.2%(-8.60)#95 | 10.9%(-6.30)#2,149 |
| 96. | Cazenovia | 4.6% | 13.2%(-8.60)#96 | 10.9%(-6.30)#2,152 |
| 97. | Chatham | 4.6% | 13.2%(-8.60)#97 | 10.9%(-6.30)#2,158 |
| 98. | Long Beach | 4.7% | 13.2%(-8.50)#98 | 10.9%(-6.20)#2,181 |
| 99. | Elwood | 4.7% | 13.2%(-8.50)#99 | 10.9%(-6.20)#2,199 |
| 100. | Fairmount | 4.7% | 13.2%(-8.50)#100 | 10.9%(-6.20)#2,201 |
Common Questions
What are the Top 10 Cities with the Lowest Unemployment Rate Amomg Youth Under the Age of 25 in New York?
Top 10 Cities with the Lowest Unemployment Rate Amomg Youth Under the Age of 25 in New York are:
#1
0.30%
#2
0.40%
#3
0.50%
#4
0.50%
#5
0.80%
#6
1.0%
#7
1.2%
#8
1.2%
#9
1.3%
#10
1.3%
What city has the Lowest Unemployment Rate Amomg Youth Under the Age of 25 in New York?
Calcium has the Lowest Unemployment Rate Amomg Youth Under the Age of 25 in New York with 0.30%.
What is the Unemployment Rate Amomg Youth Under the Age of 25 in the State of New York?
Unemployment Rate Amomg Youth Under the Age of 25 in New York is 13.2%.
What is the Unemployment Rate Amomg Youth Under the Age of 25 in the United States?
Unemployment Rate Amomg Youth Under the Age of 25 in the United States is 10.9%.