Cities with the Lowest Unemployment Rate Amomg Youth Under the Age of 25 in Virginia
RELATED REPORTS & OPTIONS
Lowest Unemployment | Youth < 25
Virginia
Compare Cities
Map of Cities with the Lowest Unemployment Rate Amomg Youth Under the Age of 25 in Virginia
8.0%
0.0%
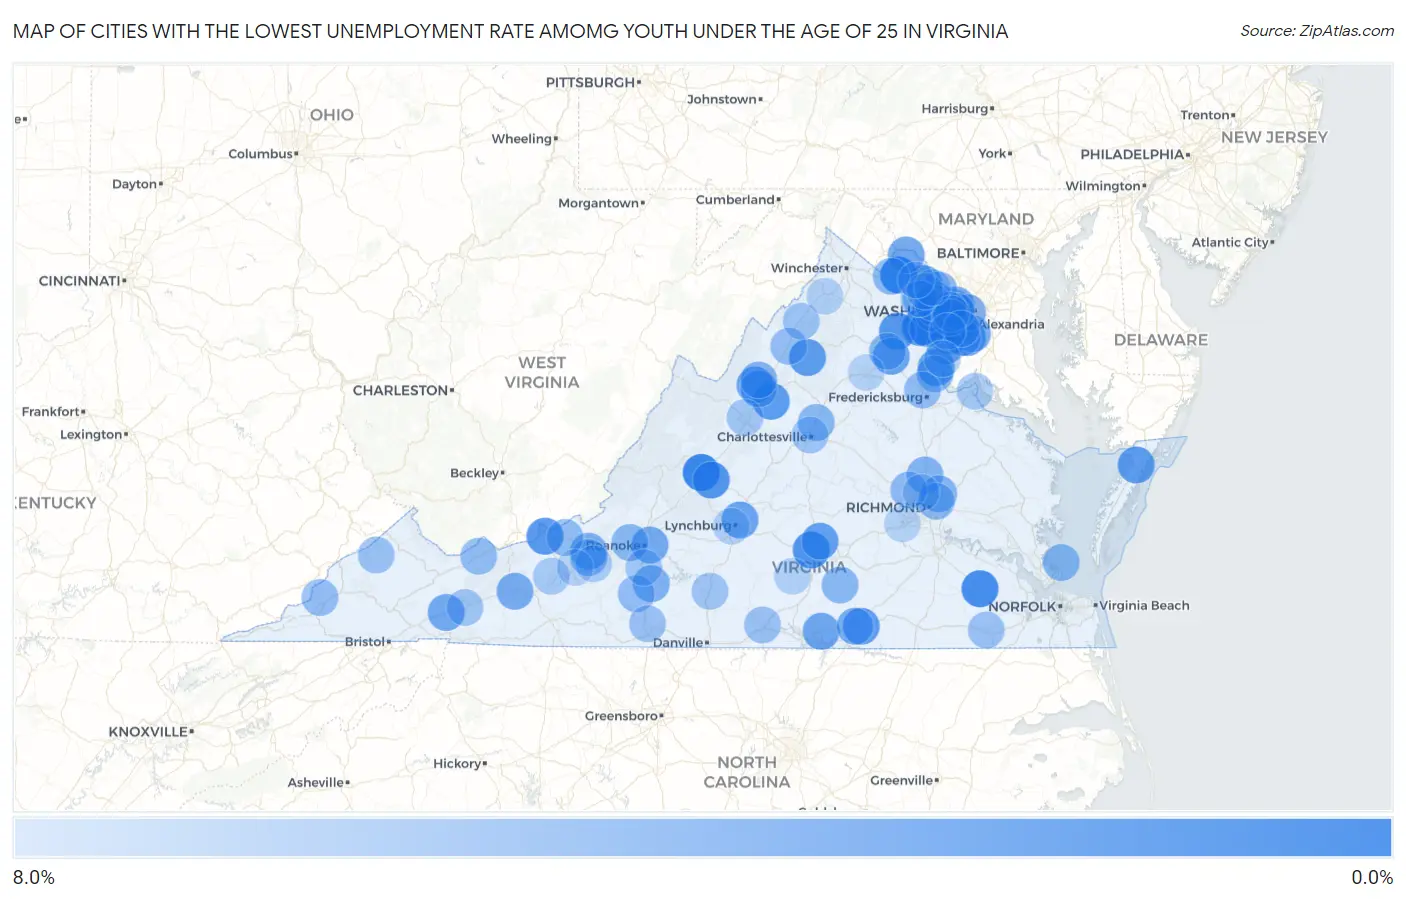
Cities with the Lowest Unemployment Rate Amomg Youth Under the Age of 25 in Virginia
| City | Youth Unemployment | vs State | vs National | |
| 1. | The University Of Virginia's College At Wise | 0.50% | 10.6%(-10.1)#1 | 10.9%(-10.4)#49 |
| 2. | Lexington | 0.60% | 10.6%(-10.00)#2 | 10.9%(-10.3)#53 |
| 3. | Purcellville | 0.70% | 10.6%(-9.90)#3 | 10.9%(-10.2)#65 |
| 4. | Sudley | 0.80% | 10.6%(-9.80)#4 | 10.9%(-10.1)#80 |
| 5. | Wakefield | 1.3% | 10.6%(-9.30)#5 | 10.9%(-9.60)#208 |
| 6. | Hampden Sydney | 1.8% | 10.6%(-8.80)#6 | 10.9%(-9.10)#388 |
| 7. | Long Branch | 1.9% | 10.6%(-8.70)#7 | 10.9%(-9.00)#407 |
| 8. | North Springfield | 1.9% | 10.6%(-8.70)#8 | 10.9%(-9.00)#411 |
| 9. | Buena Vista | 2.2% | 10.6%(-8.40)#9 | 10.9%(-8.70)#547 |
| 10. | Bull Run | 2.3% | 10.6%(-8.30)#10 | 10.9%(-8.60)#586 |
| 11. | New Baltimore | 2.3% | 10.6%(-8.30)#11 | 10.9%(-8.60)#592 |
| 12. | Narrows | 2.3% | 10.6%(-8.30)#12 | 10.9%(-8.60)#615 |
| 13. | Grottoes | 2.6% | 10.6%(-8.00)#13 | 10.9%(-8.30)#795 |
| 14. | Lansdowne | 2.7% | 10.6%(-7.90)#14 | 10.9%(-8.20)#830 |
| 15. | Stanley | 2.7% | 10.6%(-7.90)#15 | 10.9%(-8.20)#864 |
| 16. | Bloxom | 2.7% | 10.6%(-7.90)#16 | 10.9%(-8.20)#893 |
| 17. | Brodnax | 2.8% | 10.6%(-7.80)#17 | 10.9%(-8.10)#952 |
| 18. | Greenbriar | 2.9% | 10.6%(-7.70)#18 | 10.9%(-8.00)#968 |
| 19. | Boswell S Corner | 2.9% | 10.6%(-7.70)#19 | 10.9%(-8.00)#999 |
| 20. | Farmville | 3.0% | 10.6%(-7.60)#20 | 10.9%(-7.90)#1,026 |
| 21. | Mount Vernon | 3.2% | 10.6%(-7.40)#21 | 10.9%(-7.70)#1,163 |
| 22. | Bealeton | 3.3% | 10.6%(-7.30)#22 | 10.9%(-7.60)#1,250 |
| 23. | Madison Heights | 3.4% | 10.6%(-7.20)#23 | 10.9%(-7.50)#1,296 |
| 24. | Bridgewater | 3.4% | 10.6%(-7.20)#24 | 10.9%(-7.50)#1,307 |
| 25. | Boydton | 3.7% | 10.6%(-6.90)#25 | 10.9%(-7.20)#1,542 |
| 26. | Lovettsville | 3.8% | 10.6%(-6.80)#26 | 10.9%(-7.10)#1,586 |
| 27. | Chilhowie | 3.8% | 10.6%(-6.80)#27 | 10.9%(-7.10)#1,588 |
| 28. | Fort Hunt | 3.9% | 10.6%(-6.70)#28 | 10.9%(-7.00)#1,622 |
| 29. | Vinton | 4.0% | 10.6%(-6.60)#29 | 10.9%(-6.90)#1,693 |
| 30. | Tysons | 4.2% | 10.6%(-6.40)#30 | 10.9%(-6.70)#1,820 |
| 31. | Wytheville | 4.2% | 10.6%(-6.40)#31 | 10.9%(-6.70)#1,840 |
| 32. | Mclean | 4.3% | 10.6%(-6.30)#32 | 10.9%(-6.60)#1,884 |
| 33. | Herndon | 4.3% | 10.6%(-6.30)#33 | 10.9%(-6.60)#1,891 |
| 34. | Crosspointe | 4.3% | 10.6%(-6.30)#34 | 10.9%(-6.60)#1,910 |
| 35. | La Crosse | 4.3% | 10.6%(-6.30)#35 | 10.9%(-6.60)#1,941 |
| 36. | Mount Crawford | 4.3% | 10.6%(-6.30)#36 | 10.9%(-6.60)#1,943 |
| 37. | Blacksburg | 4.5% | 10.6%(-6.10)#37 | 10.9%(-6.40)#2,026 |
| 38. | Potomac Mills | 4.5% | 10.6%(-6.10)#38 | 10.9%(-6.40)#2,053 |
| 39. | Arlington | 4.6% | 10.6%(-6.00)#39 | 10.9%(-6.30)#2,102 |
| 40. | Fort Belvoir | 4.6% | 10.6%(-6.00)#40 | 10.9%(-6.30)#2,131 |
| 41. | Rocky Mount | 4.6% | 10.6%(-6.00)#41 | 10.9%(-6.30)#2,139 |
| 42. | Idylwood | 4.8% | 10.6%(-5.80)#42 | 10.9%(-6.10)#2,270 |
| 43. | Lowes Island | 4.8% | 10.6%(-5.80)#43 | 10.9%(-6.10)#2,274 |
| 44. | Ashland | 4.9% | 10.6%(-5.70)#44 | 10.9%(-6.00)#2,355 |
| 45. | Dayton | 4.9% | 10.6%(-5.70)#45 | 10.9%(-6.00)#2,376 |
| 46. | Mechanicsville | 5.0% | 10.6%(-5.60)#46 | 10.9%(-5.90)#2,406 |
| 47. | Franklin Farm | 5.1% | 10.6%(-5.50)#47 | 10.9%(-5.80)#2,476 |
| 48. | Merrimac | 5.1% | 10.6%(-5.50)#48 | 10.9%(-5.80)#2,502 |
| 49. | Poquoson | 5.2% | 10.6%(-5.40)#49 | 10.9%(-5.70)#2,545 |
| 50. | Hollymead | 5.2% | 10.6%(-5.40)#50 | 10.9%(-5.70)#2,551 |
| 51. | Aquia Harbour | 5.2% | 10.6%(-5.40)#51 | 10.9%(-5.70)#2,557 |
| 52. | Victoria | 5.2% | 10.6%(-5.40)#52 | 10.9%(-5.70)#2,581 |
| 53. | Opal | 5.2% | 10.6%(-5.40)#53 | 10.9%(-5.70)#2,603 |
| 54. | Round Hill | 5.2% | 10.6%(-5.40)#54 | 10.9%(-5.70)#2,605 |
| 55. | Salem | 5.3% | 10.6%(-5.30)#55 | 10.9%(-5.60)#2,624 |
| 56. | East Highland Park | 5.3% | 10.6%(-5.30)#56 | 10.9%(-5.60)#2,629 |
| 57. | Loudoun Valley Estates | 5.4% | 10.6%(-5.20)#57 | 10.9%(-5.50)#2,714 |
| 58. | Vienna | 5.5% | 10.6%(-5.10)#58 | 10.9%(-5.40)#2,784 |
| 59. | Short Pump | 5.6% | 10.6%(-5.00)#59 | 10.9%(-5.30)#2,854 |
| 60. | Manassas Park | 5.6% | 10.6%(-5.00)#60 | 10.9%(-5.30)#2,862 |
| 61. | Southern Gateway | 5.7% | 10.6%(-4.90)#61 | 10.9%(-5.20)#2,967 |
| 62. | Springville | 5.7% | 10.6%(-4.90)#62 | 10.9%(-5.20)#2,987 |
| 63. | Pembroke | 5.7% | 10.6%(-4.90)#63 | 10.9%(-5.20)#2,988 |
| 64. | New Market | 5.8% | 10.6%(-4.80)#64 | 10.9%(-5.10)#3,052 |
| 65. | Ferrum | 5.8% | 10.6%(-4.80)#65 | 10.9%(-5.10)#3,056 |
| 66. | Appalachia | 5.8% | 10.6%(-4.80)#66 | 10.9%(-5.10)#3,059 |
| 67. | Mcnair | 5.9% | 10.6%(-4.70)#67 | 10.9%(-5.00)#3,098 |
| 68. | South Boston | 6.1% | 10.6%(-4.50)#68 | 10.9%(-4.80)#3,290 |
| 69. | Collinsville | 6.1% | 10.6%(-4.50)#69 | 10.9%(-4.80)#3,291 |
| 70. | Mantua | 6.1% | 10.6%(-4.50)#70 | 10.9%(-4.80)#3,293 |
| 71. | Union Mill | 6.1% | 10.6%(-4.50)#71 | 10.9%(-4.80)#3,301 |
| 72. | Merrifield | 6.2% | 10.6%(-4.40)#72 | 10.9%(-4.70)#3,341 |
| 73. | Franklin | 6.2% | 10.6%(-4.40)#73 | 10.9%(-4.70)#3,363 |
| 74. | Haysi | 6.2% | 10.6%(-4.40)#74 | 10.9%(-4.70)#3,402 |
| 75. | Charlottesville | 6.3% | 10.6%(-4.30)#75 | 10.9%(-4.60)#3,426 |
| 76. | Edinburg | 6.3% | 10.6%(-4.30)#76 | 10.9%(-4.60)#3,479 |
| 77. | Marion | 6.5% | 10.6%(-4.10)#77 | 10.9%(-4.40)#3,612 |
| 78. | Gretna | 6.5% | 10.6%(-4.10)#78 | 10.9%(-4.40)#3,635 |
| 79. | Staunton | 6.6% | 10.6%(-4.00)#79 | 10.9%(-4.30)#3,662 |
| 80. | Boones Mill | 6.6% | 10.6%(-4.00)#80 | 10.9%(-4.30)#3,727 |
| 81. | Brambleton | 6.7% | 10.6%(-3.90)#81 | 10.9%(-4.20)#3,741 |
| 82. | Franconia | 6.7% | 10.6%(-3.90)#82 | 10.9%(-4.20)#3,745 |
| 83. | Ashburn | 6.8% | 10.6%(-3.80)#83 | 10.9%(-4.10)#3,801 |
| 84. | Dahlgren Center | 6.8% | 10.6%(-3.80)#84 | 10.9%(-4.10)#3,874 |
| 85. | Pulaski | 6.9% | 10.6%(-3.70)#85 | 10.9%(-4.00)#3,921 |
| 86. | South Run | 7.1% | 10.6%(-3.50)#86 | 10.9%(-3.80)#4,040 |
| 87. | Christiansburg | 7.2% | 10.6%(-3.40)#87 | 10.9%(-3.70)#4,119 |
| 88. | Laurel | 7.2% | 10.6%(-3.40)#88 | 10.9%(-3.70)#4,122 |
| 89. | Dumfries | 7.2% | 10.6%(-3.40)#89 | 10.9%(-3.70)#4,145 |
| 90. | Midlothian | 7.4% | 10.6%(-3.20)#90 | 10.9%(-3.50)#4,270 |
| 91. | Difficult Run | 7.4% | 10.6%(-3.20)#91 | 10.9%(-3.50)#4,285 |
| 92. | Strasburg | 7.4% | 10.6%(-3.20)#92 | 10.9%(-3.50)#4,292 |
| 93. | Lynchburg | 7.5% | 10.6%(-3.10)#93 | 10.9%(-3.40)#4,337 |
| 94. | Countryside | 7.5% | 10.6%(-3.10)#94 | 10.9%(-3.40)#4,357 |
| 95. | Charlotte Court House | 7.5% | 10.6%(-3.10)#95 | 10.9%(-3.40)#4,399 |
| 96. | Leesburg | 7.7% | 10.6%(-2.90)#96 | 10.9%(-3.20)#4,522 |
| 97. | Culpeper | 7.7% | 10.6%(-2.90)#97 | 10.9%(-3.20)#4,536 |
| 98. | Woodlake | 7.7% | 10.6%(-2.90)#98 | 10.9%(-3.20)#4,547 |
| 99. | Earlysville | 7.7% | 10.6%(-2.90)#99 | 10.9%(-3.20)#4,583 |
| 100. | Radford | 7.8% | 10.6%(-2.80)#100 | 10.9%(-3.10)#4,603 |
Common Questions
What are the Top 10 Cities with the Lowest Unemployment Rate Amomg Youth Under the Age of 25 in Virginia?
Top 10 Cities with the Lowest Unemployment Rate Amomg Youth Under the Age of 25 in Virginia are:
#1
0.60%
#2
0.70%
#3
0.80%
#4
1.3%
#5
1.8%
#6
1.9%
#7
1.9%
#8
2.2%
#9
2.3%
#10
2.3%
What city has the Lowest Unemployment Rate Amomg Youth Under the Age of 25 in Virginia?
Lexington has the Lowest Unemployment Rate Amomg Youth Under the Age of 25 in Virginia with 0.60%.
What is the Unemployment Rate Amomg Youth Under the Age of 25 in the State of Virginia?
Unemployment Rate Amomg Youth Under the Age of 25 in Virginia is 10.6%.
What is the Unemployment Rate Amomg Youth Under the Age of 25 in the United States?
Unemployment Rate Amomg Youth Under the Age of 25 in the United States is 10.9%.