Cities with the Lowest Unemployment Rate Amomg Youth Under the Age of 25 in Mississippi
RELATED REPORTS & OPTIONS
Lowest Unemployment | Youth < 25
Mississippi
Compare Cities
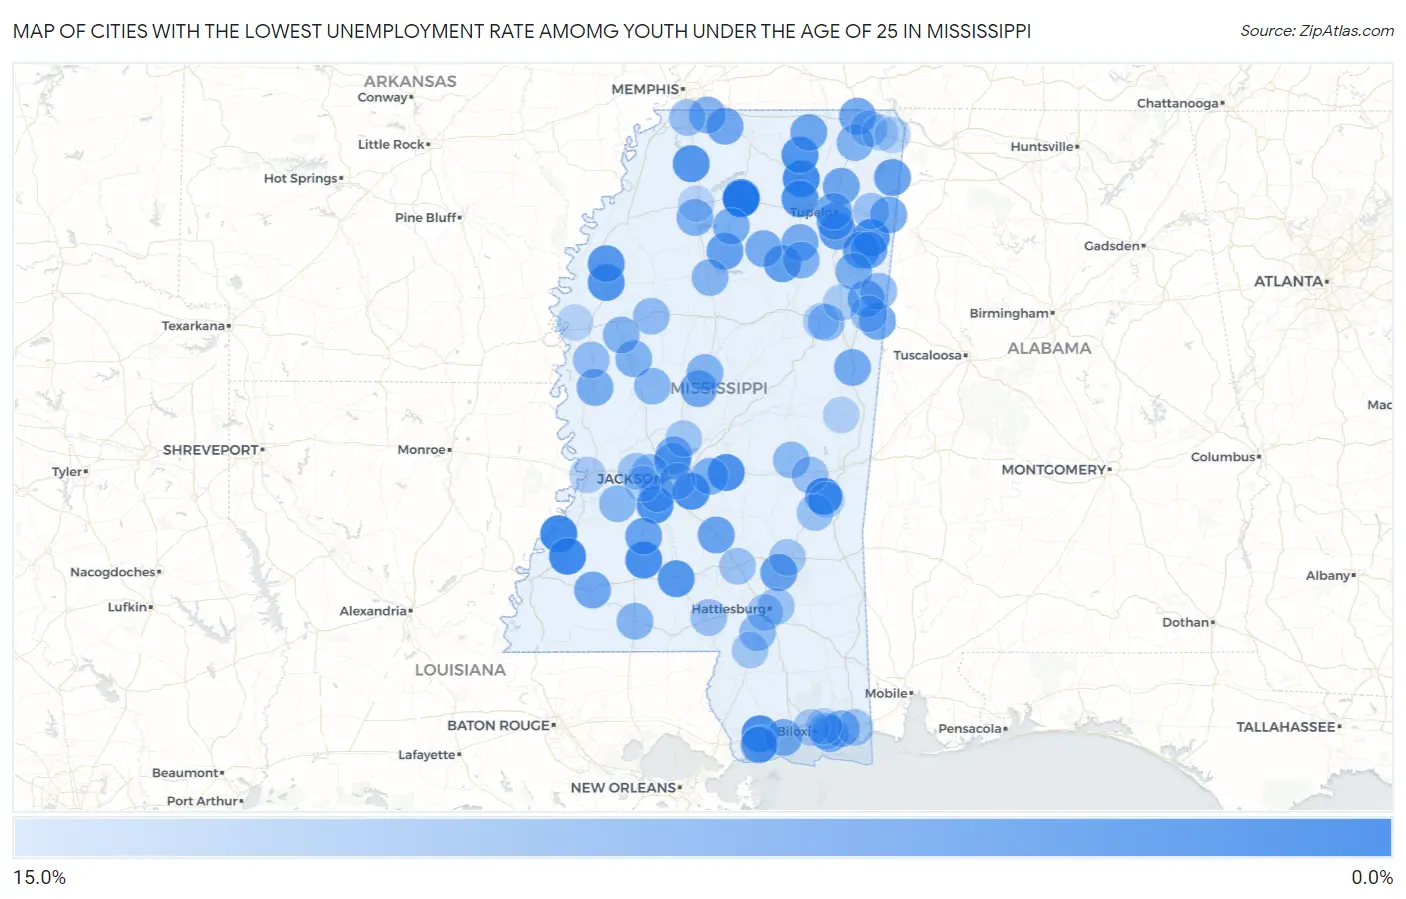
Map of Cities with the Lowest Unemployment Rate Amomg Youth Under the Age of 25 in Mississippi
15.0%
0.0%
Cities with the Lowest Unemployment Rate Amomg Youth Under the Age of 25 in Mississippi
| City | Youth Unemployment | vs State | vs National | |
| 1. | University | 0.20% | 13.8%(-13.6)#1 | 10.9%(-10.7)#11 |
| 2. | Alcorn State University | 1.0% | 13.8%(-12.8)#2 | 10.9%(-9.90)#139 |
| 3. | Fayette | 1.2% | 13.8%(-12.6)#3 | 10.9%(-9.70)#181 |
| 4. | New Albany | 1.3% | 13.8%(-12.5)#4 | 10.9%(-9.60)#195 |
| 5. | Oxford | 1.8% | 13.8%(-12.0)#5 | 10.9%(-9.10)#352 |
| 6. | Enterprise | 1.9% | 13.8%(-11.9)#6 | 10.9%(-9.00)#430 |
| 7. | Smithville | 2.1% | 13.8%(-11.7)#7 | 10.9%(-8.80)#526 |
| 8. | Wesson | 2.2% | 13.8%(-11.6)#8 | 10.9%(-8.70)#561 |
| 9. | Diamondhead | 2.3% | 13.8%(-11.5)#9 | 10.9%(-8.60)#595 |
| 10. | Morton | 2.5% | 13.8%(-11.3)#10 | 10.9%(-8.40)#723 |
| 11. | Terry | 2.6% | 13.8%(-11.2)#11 | 10.9%(-8.30)#812 |
| 12. | Robinhood | 2.7% | 13.8%(-11.1)#12 | 10.9%(-8.20)#873 |
| 13. | Ecru | 3.1% | 13.8%(-10.7)#13 | 10.9%(-7.80)#1,130 |
| 14. | Blue Mountain | 3.2% | 13.8%(-10.6)#14 | 10.9%(-7.70)#1,209 |
| 15. | Cleveland | 3.3% | 13.8%(-10.5)#15 | 10.9%(-7.60)#1,238 |
| 16. | Senatobia | 3.5% | 13.8%(-10.3)#16 | 10.9%(-7.40)#1,361 |
| 17. | Mound Bayou | 3.7% | 13.8%(-10.1)#17 | 10.9%(-7.20)#1,519 |
| 18. | Monticello | 3.9% | 13.8%(-9.90)#18 | 10.9%(-7.00)#1,654 |
| 19. | Shannon | 4.8% | 13.8%(-9.00)#19 | 10.9%(-6.10)#2,311 |
| 20. | Vardaman | 5.0% | 13.8%(-8.80)#20 | 10.9%(-5.90)#2,456 |
| 21. | Ellisville | 5.4% | 13.8%(-8.40)#21 | 10.9%(-5.50)#2,731 |
| 22. | Belmont | 5.4% | 13.8%(-8.40)#22 | 10.9%(-5.50)#2,739 |
| 23. | Coffeeville | 5.4% | 13.8%(-8.40)#23 | 10.9%(-5.50)#2,757 |
| 24. | Amory | 5.7% | 13.8%(-8.10)#24 | 10.9%(-5.20)#2,950 |
| 25. | Magee | 5.7% | 13.8%(-8.10)#25 | 10.9%(-5.20)#2,958 |
| 26. | Hazlehurst | 5.8% | 13.8%(-8.00)#26 | 10.9%(-5.10)#3,043 |
| 27. | Verona | 6.3% | 13.8%(-7.50)#27 | 10.9%(-4.60)#3,463 |
| 28. | Guntown | 6.6% | 13.8%(-7.20)#28 | 10.9%(-4.30)#3,694 |
| 29. | Falkner | 6.6% | 13.8%(-7.20)#29 | 10.9%(-4.30)#3,712 |
| 30. | New Hope | 6.7% | 13.8%(-7.10)#30 | 10.9%(-4.20)#3,777 |
| 31. | Byhalia | 6.7% | 13.8%(-7.10)#31 | 10.9%(-4.20)#3,782 |
| 32. | Corinth | 6.8% | 13.8%(-7.00)#32 | 10.9%(-4.10)#3,818 |
| 33. | Bude | 6.8% | 13.8%(-7.00)#33 | 10.9%(-4.10)#3,872 |
| 34. | Hatley | 6.8% | 13.8%(-7.00)#34 | 10.9%(-4.10)#3,877 |
| 35. | Columbus Afb | 6.9% | 13.8%(-6.90)#35 | 10.9%(-4.00)#3,945 |
| 36. | Goodman | 6.9% | 13.8%(-6.90)#36 | 10.9%(-4.00)#3,946 |
| 37. | Tremont | 7.1% | 13.8%(-6.70)#37 | 10.9%(-3.80)#4,093 |
| 38. | Macon | 7.2% | 13.8%(-6.60)#38 | 10.9%(-3.70)#4,155 |
| 39. | Bruce | 7.4% | 13.8%(-6.40)#39 | 10.9%(-3.50)#4,310 |
| 40. | Long Beach | 7.5% | 13.8%(-6.30)#40 | 10.9%(-3.40)#4,350 |
| 41. | New Houlka | 7.5% | 13.8%(-6.30)#41 | 10.9%(-3.40)#4,402 |
| 42. | Madison | 7.6% | 13.8%(-6.20)#42 | 10.9%(-3.30)#4,417 |
| 43. | Ridgeland | 7.6% | 13.8%(-6.20)#43 | 10.9%(-3.30)#4,419 |
| 44. | Tupelo | 7.7% | 13.8%(-6.10)#44 | 10.9%(-3.20)#4,527 |
| 45. | Anguilla | 7.8% | 13.8%(-6.00)#45 | 10.9%(-3.10)#4,656 |
| 46. | Aberdeen | 7.9% | 13.8%(-5.90)#46 | 10.9%(-3.00)#4,699 |
| 47. | Water Valley | 7.9% | 13.8%(-5.90)#47 | 10.9%(-3.00)#4,706 |
| 48. | Bay St Louis | 8.2% | 13.8%(-5.60)#48 | 10.9%(-2.70)#4,900 |
| 49. | Pelahatchie | 8.2% | 13.8%(-5.60)#49 | 10.9%(-2.70)#4,931 |
| 50. | Olive Branch | 8.3% | 13.8%(-5.50)#50 | 10.9%(-2.60)#4,943 |
| 51. | Gulf Park Estates | 8.3% | 13.8%(-5.50)#51 | 10.9%(-2.60)#4,970 |
| 52. | Pope | 8.3% | 13.8%(-5.50)#52 | 10.9%(-2.60)#5,015 |
| 53. | Gautier | 8.4% | 13.8%(-5.40)#53 | 10.9%(-2.50)#5,053 |
| 54. | Belzoni | 8.4% | 13.8%(-5.40)#54 | 10.9%(-2.50)#5,098 |
| 55. | Houston | 8.6% | 13.8%(-5.20)#55 | 10.9%(-2.30)#5,248 |
| 56. | Inverness | 8.8% | 13.8%(-5.00)#56 | 10.9%(-2.10)#5,450 |
| 57. | Rienzi | 9.0% | 13.8%(-4.80)#57 | 10.9%(-1.90)#5,626 |
| 58. | Mccomb | 9.1% | 13.8%(-4.70)#58 | 10.9%(-1.80)#5,674 |
| 59. | Durant | 9.2% | 13.8%(-4.60)#59 | 10.9%(-1.70)#5,769 |
| 60. | Grenada | 9.4% | 13.8%(-4.40)#60 | 10.9%(-1.50)#5,906 |
| 61. | Eden | 9.6% | 13.8%(-4.20)#61 | 10.9%(-1.30)#6,101 |
| 62. | Utica | 9.7% | 13.8%(-4.10)#62 | 10.9%(-1.20)#6,174 |
| 63. | Decatur | 9.8% | 13.8%(-4.00)#63 | 10.9%(-1.10)#6,236 |
| 64. | Clinton | 9.9% | 13.8%(-3.90)#64 | 10.9%(-1.000)#6,268 |
| 65. | Purvis | 10.0% | 13.8%(-3.80)#65 | 10.9%(-0.900)#6,394 |
| 66. | Caledonia | 10.0% | 13.8%(-3.80)#66 | 10.9%(-0.900)#6,401 |
| 67. | Waveland | 10.2% | 13.8%(-3.60)#67 | 10.9%(-0.700)#6,530 |
| 68. | Itta Bena | 10.3% | 13.8%(-3.50)#68 | 10.9%(-0.600)#6,634 |
| 69. | Byram | 10.4% | 13.8%(-3.40)#69 | 10.9%(-0.500)#6,691 |
| 70. | Mississippi State | 10.4% | 13.8%(-3.40)#70 | 10.9%(-0.500)#6,711 |
| 71. | Hollandale | 10.5% | 13.8%(-3.30)#71 | 10.9%(-0.400)#6,783 |
| 72. | Southaven | 11.1% | 13.8%(-2.70)#72 | 10.9%(+0.200)#7,132 |
| 73. | Columbia | 11.3% | 13.8%(-2.50)#73 | 10.9%(+0.400)#7,338 |
| 74. | Columbus | 11.4% | 13.8%(-2.40)#74 | 10.9%(+0.500)#7,380 |
| 75. | Chunky | 11.4% | 13.8%(-2.40)#75 | 10.9%(+0.500)#7,424 |
| 76. | Pearl | 11.5% | 13.8%(-2.30)#76 | 10.9%(+0.600)#7,440 |
| 77. | Fulton | 11.5% | 13.8%(-2.30)#77 | 10.9%(+0.600)#7,464 |
| 78. | Glen | 11.5% | 13.8%(-2.30)#78 | 10.9%(+0.600)#7,490 |
| 79. | Pachuta | 11.5% | 13.8%(-2.30)#79 | 10.9%(+0.600)#7,497 |
| 80. | Petal | 11.6% | 13.8%(-2.20)#80 | 10.9%(+0.700)#7,530 |
| 81. | Collins | 11.6% | 13.8%(-2.20)#81 | 10.9%(+0.700)#7,548 |
| 82. | Hattiesburg | 11.7% | 13.8%(-2.10)#82 | 10.9%(+0.800)#7,570 |
| 83. | Ocean Springs | 11.8% | 13.8%(-2.00)#83 | 10.9%(+0.900)#7,651 |
| 84. | Laurel | 12.0% | 13.8%(-1.80)#84 | 10.9%(+1.10)#7,761 |
| 85. | Bolton | 12.0% | 13.8%(-1.80)#85 | 10.9%(+1.10)#7,802 |
| 86. | Canton | 12.3% | 13.8%(-1.50)#86 | 10.9%(+1.40)#7,939 |
| 87. | Lumberton | 12.5% | 13.8%(-1.30)#87 | 10.9%(+1.60)#8,079 |
| 88. | Moss Point | 12.6% | 13.8%(-1.20)#88 | 10.9%(+1.70)#8,140 |
| 89. | Biloxi | 12.9% | 13.8%(-0.900)#89 | 10.9%(+2.00)#8,291 |
| 90. | Vicksburg | 13.3% | 13.8%(-0.500)#90 | 10.9%(+2.40)#8,514 |
| 91. | Starkville | 13.5% | 13.8%(-0.300)#91 | 10.9%(+2.60)#8,644 |
| 92. | West Point | 13.5% | 13.8%(-0.300)#92 | 10.9%(+2.60)#8,653 |
| 93. | Gulf Hills | 13.7% | 13.8%(-0.100)#93 | 10.9%(+2.80)#8,778 |
| 94. | Stonewall | 13.8% | 13.8%(=0.000)#94 | 10.9%(+2.90)#8,898 |
| 95. | De Kalb | 14.0% | 13.8%(+0.200)#95 | 10.9%(+3.10)#8,995 |
| 96. | Burnsville | 14.2% | 13.8%(+0.400)#96 | 10.9%(+3.30)#9,094 |
| 97. | Raymond | 14.4% | 13.8%(+0.600)#97 | 10.9%(+3.50)#9,236 |
| 98. | Iuka | 14.6% | 13.8%(+0.800)#98 | 10.9%(+3.70)#9,315 |
| 99. | Metcalfe | 14.6% | 13.8%(+0.800)#99 | 10.9%(+3.70)#9,324 |
| 100. | Batesville | 14.7% | 13.8%(+0.900)#100 | 10.9%(+3.80)#9,347 |
Common Questions
What are the Top 10 Cities with the Lowest Unemployment Rate Amomg Youth Under the Age of 25 in Mississippi?
Top 10 Cities with the Lowest Unemployment Rate Amomg Youth Under the Age of 25 in Mississippi are:
#1
0.20%
#2
1.0%
#3
1.2%
#4
1.3%
#5
1.8%
#6
1.9%
#7
2.1%
#8
2.2%
#9
2.3%
#10
2.5%
What city has the Lowest Unemployment Rate Amomg Youth Under the Age of 25 in Mississippi?
University has the Lowest Unemployment Rate Amomg Youth Under the Age of 25 in Mississippi with 0.20%.
What is the Unemployment Rate Amomg Youth Under the Age of 25 in the State of Mississippi?
Unemployment Rate Amomg Youth Under the Age of 25 in Mississippi is 13.8%.
What is the Unemployment Rate Amomg Youth Under the Age of 25 in the United States?
Unemployment Rate Amomg Youth Under the Age of 25 in the United States is 10.9%.