Cities with the Lowest Unemployment Rate Amomg Youth Under the Age of 25 in West Virginia
RELATED REPORTS & OPTIONS
Lowest Unemployment | Youth < 25
West Virginia
Compare Cities
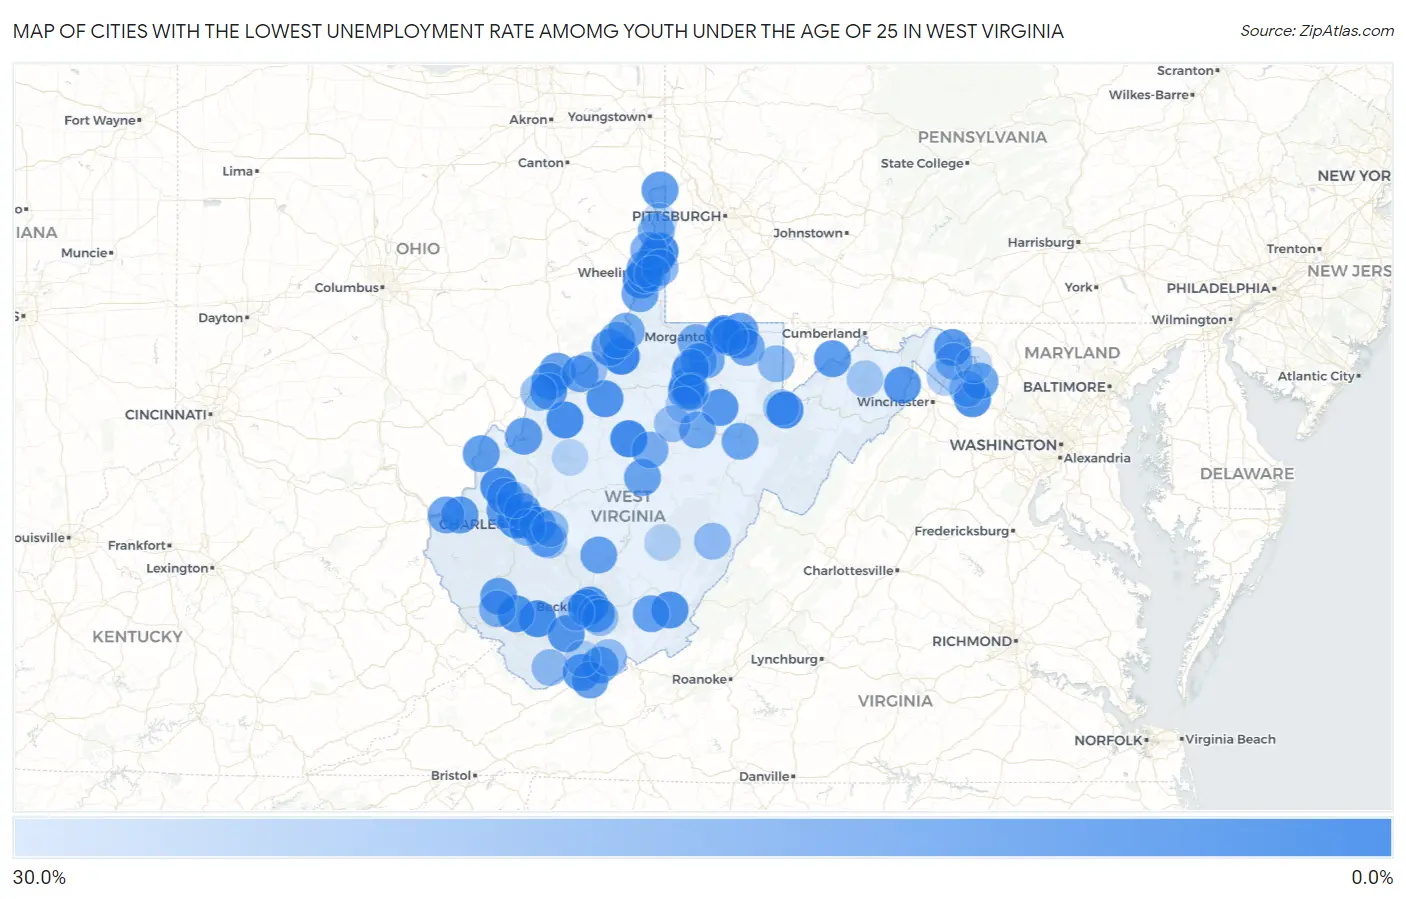
Map of Cities with the Lowest Unemployment Rate Amomg Youth Under the Age of 25 in West Virginia
30.0%
0.0%
Cities with the Lowest Unemployment Rate Amomg Youth Under the Age of 25 in West Virginia
| City | Youth Unemployment | vs State | vs National | |
| 1. | Dunbar | 1.0% | 12.4%(-11.4)#1 | 10.9%(-9.90)#129 |
| 2. | Middlebourne | 1.9% | 12.4%(-10.5)#2 | 10.9%(-9.00)#428 |
| 3. | Granville | 2.7% | 12.4%(-9.70)#3 | 10.9%(-8.20)#870 |
| 4. | Ranson Corporation | 3.0% | 12.4%(-9.40)#4 | 10.9%(-7.90)#1,032 |
| 5. | Glenville | 3.5% | 12.4%(-8.90)#5 | 10.9%(-7.40)#1,396 |
| 6. | Bethany | 3.9% | 12.4%(-8.50)#6 | 10.9%(-7.00)#1,657 |
| 7. | Davis | 3.9% | 12.4%(-8.50)#7 | 10.9%(-7.00)#1,662 |
| 8. | Benwood | 4.1% | 12.4%(-8.30)#8 | 10.9%(-6.80)#1,798 |
| 9. | Buffalo | 4.4% | 12.4%(-8.00)#9 | 10.9%(-6.50)#2,010 |
| 10. | Elizabeth | 4.4% | 12.4%(-8.00)#10 | 10.9%(-6.50)#2,018 |
| 11. | Oceana | 4.5% | 12.4%(-7.90)#11 | 10.9%(-6.40)#2,078 |
| 12. | St Albans | 5.0% | 12.4%(-7.40)#12 | 10.9%(-5.90)#2,422 |
| 13. | West Liberty | 5.4% | 12.4%(-7.00)#13 | 10.9%(-5.50)#2,746 |
| 14. | Shannondale | 5.9% | 12.4%(-6.50)#14 | 10.9%(-5.00)#3,129 |
| 15. | Mallory | 6.0% | 12.4%(-6.40)#15 | 10.9%(-4.90)#3,231 |
| 16. | Harrisville | 6.1% | 12.4%(-6.30)#16 | 10.9%(-4.80)#3,313 |
| 17. | Ronceverte | 6.2% | 12.4%(-6.20)#17 | 10.9%(-4.70)#3,386 |
| 18. | Beckley | 6.7% | 12.4%(-5.70)#18 | 10.9%(-4.20)#3,747 |
| 19. | Clarksburg | 6.9% | 12.4%(-5.50)#19 | 10.9%(-4.00)#3,914 |
| 20. | Mullens | 7.0% | 12.4%(-5.40)#20 | 10.9%(-3.90)#4,008 |
| 21. | Mabscott | 7.2% | 12.4%(-5.20)#21 | 10.9%(-3.70)#4,165 |
| 22. | Capon Bridge | 7.4% | 12.4%(-5.00)#22 | 10.9%(-3.50)#4,327 |
| 23. | Hedgesville | 7.6% | 12.4%(-4.80)#23 | 10.9%(-3.30)#4,499 |
| 24. | Brookhaven | 7.8% | 12.4%(-4.60)#24 | 10.9%(-3.10)#4,618 |
| 25. | Bluewell | 8.1% | 12.4%(-4.30)#25 | 10.9%(-2.80)#4,855 |
| 26. | Sistersville | 8.1% | 12.4%(-4.30)#26 | 10.9%(-2.80)#4,866 |
| 27. | Philippi | 8.2% | 12.4%(-4.20)#27 | 10.9%(-2.70)#4,917 |
| 28. | Shinnston | 8.2% | 12.4%(-4.20)#28 | 10.9%(-2.70)#4,925 |
| 29. | Pea Ridge | 8.3% | 12.4%(-4.10)#29 | 10.9%(-2.60)#4,971 |
| 30. | Teays Valley | 8.4% | 12.4%(-4.00)#30 | 10.9%(-2.50)#5,057 |
| 31. | Piedmont | 8.6% | 12.4%(-3.80)#31 | 10.9%(-2.30)#5,274 |
| 32. | Logan | 8.9% | 12.4%(-3.50)#32 | 10.9%(-2.00)#5,521 |
| 33. | Daniels | 9.0% | 12.4%(-3.40)#33 | 10.9%(-1.90)#5,584 |
| 34. | Ravenswood | 9.4% | 12.4%(-3.00)#34 | 10.9%(-1.50)#5,925 |
| 35. | Chester | 9.5% | 12.4%(-2.90)#35 | 10.9%(-1.40)#5,999 |
| 36. | Eleanor | 9.5% | 12.4%(-2.90)#36 | 10.9%(-1.40)#6,005 |
| 37. | Henderson | 9.5% | 12.4%(-2.90)#37 | 10.9%(-1.40)#6,025 |
| 38. | Williamstown | 9.7% | 12.4%(-2.70)#38 | 10.9%(-1.20)#6,156 |
| 39. | Cross Lanes | 9.8% | 12.4%(-2.60)#39 | 10.9%(-1.10)#6,212 |
| 40. | Vienna | 9.9% | 12.4%(-2.50)#40 | 10.9%(-1.000)#6,280 |
| 41. | Parkersburg | 10.2% | 12.4%(-2.20)#41 | 10.9%(-0.700)#6,513 |
| 42. | Cheat Lake | 10.7% | 12.4%(-1.70)#42 | 10.9%(-0.200)#6,926 |
| 43. | Princeton | 11.0% | 12.4%(-1.40)#43 | 10.9%(+0.100)#7,109 |
| 44. | Alderson | 11.1% | 12.4%(-1.30)#44 | 10.9%(+0.200)#7,195 |
| 45. | Belmont | 11.2% | 12.4%(-1.20)#45 | 10.9%(+0.300)#7,306 |
| 46. | Bluefield | 11.4% | 12.4%(-1.000)#46 | 10.9%(+0.500)#7,391 |
| 47. | Ansted | 11.4% | 12.4%(-1.000)#47 | 10.9%(+0.500)#7,410 |
| 48. | Huntington | 11.9% | 12.4%(-0.500)#48 | 10.9%(+1.00)#7,689 |
| 49. | Sutton | 12.0% | 12.4%(-0.400)#49 | 10.9%(+1.10)#7,803 |
| 50. | Moundsville | 12.1% | 12.4%(-0.300)#50 | 10.9%(+1.20)#7,832 |
| 51. | Westover | 12.1% | 12.4%(-0.300)#51 | 10.9%(+1.20)#7,837 |
| 52. | Bolivar | 12.6% | 12.4%(+0.200)#52 | 10.9%(+1.70)#8,163 |
| 53. | Fairmont | 12.7% | 12.4%(+0.300)#53 | 10.9%(+1.80)#8,190 |
| 54. | Elkins | 12.9% | 12.4%(+0.500)#54 | 10.9%(+2.00)#8,308 |
| 55. | Buckhannon | 13.1% | 12.4%(+0.700)#55 | 10.9%(+2.20)#8,436 |
| 56. | Charleston | 13.2% | 12.4%(+0.800)#56 | 10.9%(+2.30)#8,472 |
| 57. | Masontown | 13.5% | 12.4%(+1.10)#57 | 10.9%(+2.60)#8,681 |
| 58. | Bethlehem | 13.8% | 12.4%(+1.40)#58 | 10.9%(+2.90)#8,879 |
| 59. | West Dunbar | 13.9% | 12.4%(+1.50)#59 | 10.9%(+3.00)#8,950 |
| 60. | Follansbee | 14.0% | 12.4%(+1.60)#60 | 10.9%(+3.10)#8,978 |
| 61. | New Martinsville | 14.2% | 12.4%(+1.80)#61 | 10.9%(+3.30)#9,065 |
| 62. | Nutter Fort | 14.2% | 12.4%(+1.80)#62 | 10.9%(+3.30)#9,082 |
| 63. | Fairview | 14.2% | 12.4%(+1.80)#63 | 10.9%(+3.30)#9,135 |
| 64. | Wheeling | 14.8% | 12.4%(+2.40)#64 | 10.9%(+3.90)#9,379 |
| 65. | Monongah | 15.2% | 12.4%(+2.80)#65 | 10.9%(+4.30)#9,612 |
| 66. | Burnsville | 15.3% | 12.4%(+2.90)#66 | 10.9%(+4.40)#9,659 |
| 67. | Paden City | 15.5% | 12.4%(+3.10)#67 | 10.9%(+4.60)#9,751 |
| 68. | Beech Bottom | 15.5% | 12.4%(+3.10)#68 | 10.9%(+4.60)#9,766 |
| 69. | Chauncey | 15.6% | 12.4%(+3.20)#69 | 10.9%(+4.70)#9,810 |
| 70. | Martinsburg | 16.1% | 12.4%(+3.70)#70 | 10.9%(+5.20)#10,007 |
| 71. | Valley Grove | 17.8% | 12.4%(+5.40)#71 | 10.9%(+6.90)#10,752 |
| 72. | Morgantown | 18.4% | 12.4%(+6.00)#72 | 10.9%(+7.50)#10,946 |
| 73. | Belle | 18.5% | 12.4%(+6.10)#73 | 10.9%(+7.60)#10,990 |
| 74. | Marmet | 18.6% | 12.4%(+6.20)#74 | 10.9%(+7.70)#11,021 |
| 75. | Terra Alta | 19.3% | 12.4%(+6.90)#75 | 10.9%(+8.40)#11,257 |
| 76. | South Charleston | 19.9% | 12.4%(+7.50)#76 | 10.9%(+9.00)#11,396 |
| 77. | Anmoore | 19.9% | 12.4%(+7.50)#77 | 10.9%(+9.00)#11,431 |
| 78. | Marlinton | 20.2% | 12.4%(+7.80)#78 | 10.9%(+9.30)#11,552 |
| 79. | Gary | 20.4% | 12.4%(+8.00)#79 | 10.9%(+9.50)#11,604 |
| 80. | Coal Fork | 21.0% | 12.4%(+8.60)#80 | 10.9%(+10.1)#11,747 |
| 81. | Athens | 21.0% | 12.4%(+8.60)#81 | 10.9%(+10.1)#11,749 |
| 82. | Charles Town | 21.1% | 12.4%(+8.70)#82 | 10.9%(+10.2)#11,773 |
| 83. | Shady Spring | 21.1% | 12.4%(+8.70)#83 | 10.9%(+10.2)#11,780 |
| 84. | Blennerhassett | 21.4% | 12.4%(+9.00)#84 | 10.9%(+10.5)#11,844 |
| 85. | Weston | 21.6% | 12.4%(+9.20)#85 | 10.9%(+10.7)#11,906 |
| 86. | St Marys | 22.4% | 12.4%(+10.00)#86 | 10.9%(+11.5)#12,121 |
| 87. | Triadelphia | 22.9% | 12.4%(+10.5)#87 | 10.9%(+12.0)#12,233 |
| 88. | Romney | 24.4% | 12.4%(+12.0)#88 | 10.9%(+13.5)#12,565 |
| 89. | Enterprise | 24.5% | 12.4%(+12.1)#89 | 10.9%(+13.6)#12,589 |
| 90. | Stonewood | 24.7% | 12.4%(+12.3)#90 | 10.9%(+13.8)#12,626 |
| 91. | Thomas | 25.0% | 12.4%(+12.6)#91 | 10.9%(+14.1)#12,706 |
| 92. | Bancroft | 25.0% | 12.4%(+12.6)#92 | 10.9%(+14.1)#12,712 |
| 93. | Lester | 26.0% | 12.4%(+13.6)#93 | 10.9%(+15.1)#12,893 |
| 94. | Inwood | 26.2% | 12.4%(+13.8)#94 | 10.9%(+15.3)#12,920 |
| 95. | Lost Creek | 26.2% | 12.4%(+13.8)#95 | 10.9%(+15.3)#12,929 |
| 96. | Matoaka | 27.2% | 12.4%(+14.8)#96 | 10.9%(+16.3)#13,127 |
| 97. | Richwood | 28.1% | 12.4%(+15.7)#97 | 10.9%(+17.2)#13,240 |
| 98. | Spencer | 28.6% | 12.4%(+16.2)#98 | 10.9%(+17.7)#13,337 |
| 99. | Weirton | 29.2% | 12.4%(+16.8)#99 | 10.9%(+18.3)#13,394 |
| 100. | Shepherdstown | 29.2% | 12.4%(+16.8)#100 | 10.9%(+18.3)#13,406 |
1
2Common Questions
What are the Top 10 Cities with the Lowest Unemployment Rate Amomg Youth Under the Age of 25 in West Virginia?
Top 10 Cities with the Lowest Unemployment Rate Amomg Youth Under the Age of 25 in West Virginia are:
What city has the Lowest Unemployment Rate Amomg Youth Under the Age of 25 in West Virginia?
Dunbar has the Lowest Unemployment Rate Amomg Youth Under the Age of 25 in West Virginia with 1.0%.
What is the Unemployment Rate Amomg Youth Under the Age of 25 in the State of West Virginia?
Unemployment Rate Amomg Youth Under the Age of 25 in West Virginia is 12.4%.
What is the Unemployment Rate Amomg Youth Under the Age of 25 in the United States?
Unemployment Rate Amomg Youth Under the Age of 25 in the United States is 10.9%.