Cities with the Lowest Unemployment Rate Amomg Youth Under the Age of 25 in Oregon
RELATED REPORTS & OPTIONS
Lowest Unemployment | Youth < 25
Oregon
Compare Cities
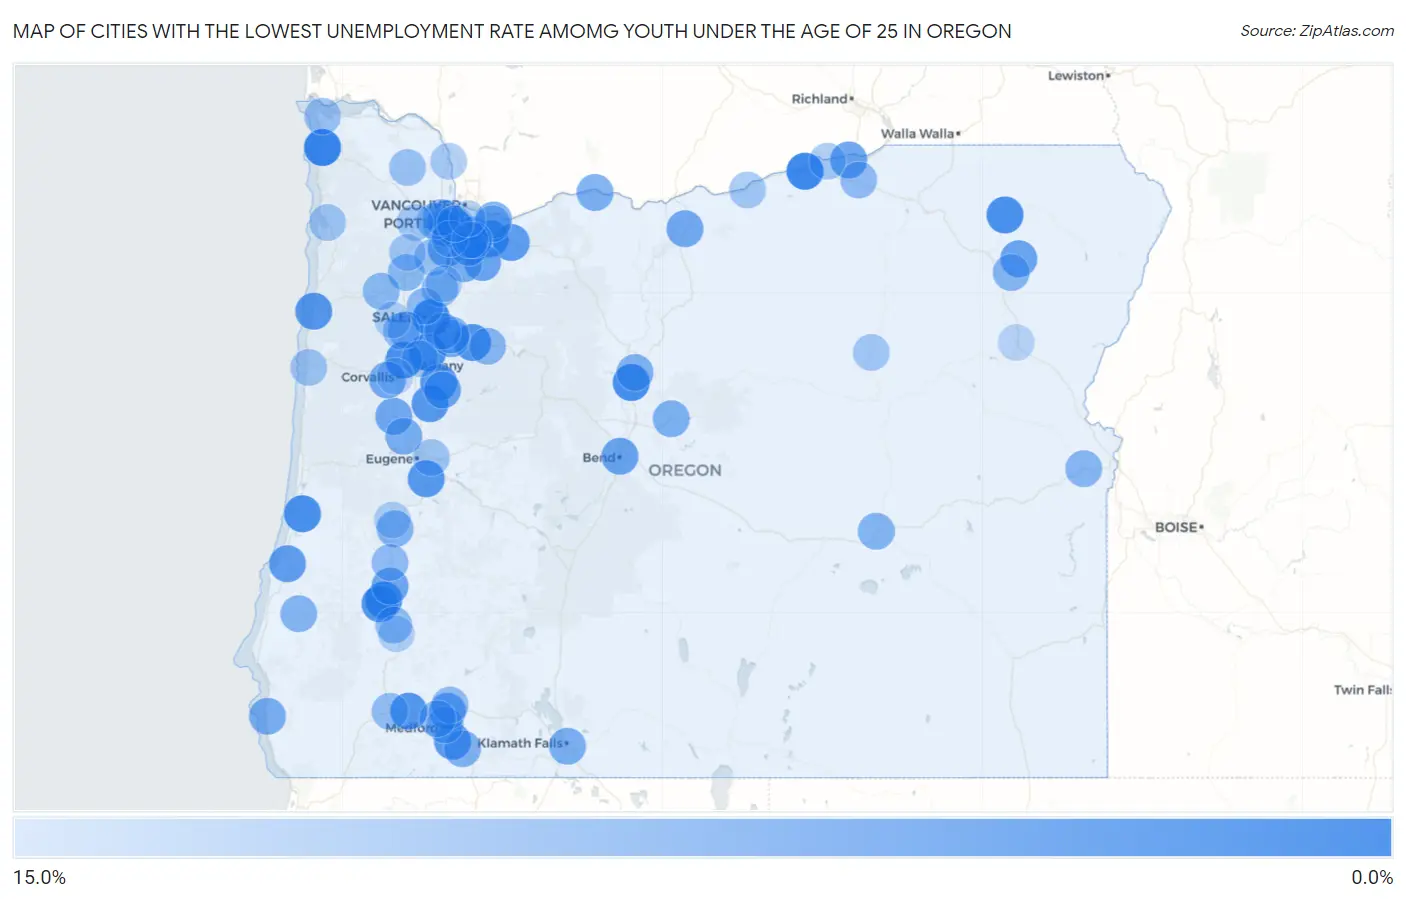
Map of Cities with the Lowest Unemployment Rate Amomg Youth Under the Age of 25 in Oregon
15.0%
0.0%
Cities with the Lowest Unemployment Rate Amomg Youth Under the Age of 25 in Oregon
| City | Youth Unemployment | vs State | vs National | |
| 1. | Seaside | 0.50% | 11.7%(-11.2)#1 | 10.9%(-10.4)#44 |
| 2. | Boardman | 1.0% | 11.7%(-10.7)#2 | 10.9%(-9.90)#133 |
| 3. | Four Corners | 1.4% | 11.7%(-10.3)#3 | 10.9%(-9.50)#214 |
| 4. | Jefferson | 1.8% | 11.7%(-9.90)#4 | 10.9%(-9.10)#377 |
| 5. | Culver | 1.8% | 11.7%(-9.90)#5 | 10.9%(-9.10)#385 |
| 6. | Damascus | 2.1% | 11.7%(-9.60)#6 | 10.9%(-8.80)#492 |
| 7. | Raleigh Hills | 2.1% | 11.7%(-9.60)#7 | 10.9%(-8.80)#500 |
| 8. | Reedsport | 2.3% | 11.7%(-9.40)#8 | 10.9%(-8.60)#609 |
| 9. | Green | 2.4% | 11.7%(-9.30)#9 | 10.9%(-8.50)#651 |
| 10. | Elgin | 2.4% | 11.7%(-9.30)#10 | 10.9%(-8.50)#681 |
| 11. | Adair Village | 2.4% | 11.7%(-9.30)#11 | 10.9%(-8.50)#688 |
| 12. | Dunthorpe | 3.0% | 11.7%(-8.70)#12 | 10.9%(-7.90)#1,050 |
| 13. | Lyons | 3.0% | 11.7%(-8.70)#13 | 10.9%(-7.90)#1,058 |
| 14. | Rogue River | 3.2% | 11.7%(-8.50)#14 | 10.9%(-7.70)#1,198 |
| 15. | Lincoln City | 3.4% | 11.7%(-8.30)#15 | 10.9%(-7.50)#1,299 |
| 16. | Winston | 3.4% | 11.7%(-8.30)#16 | 10.9%(-7.50)#1,313 |
| 17. | Creswell | 3.6% | 11.7%(-8.10)#17 | 10.9%(-7.30)#1,442 |
| 18. | Brownsville | 3.6% | 11.7%(-8.10)#18 | 10.9%(-7.30)#1,460 |
| 19. | Lebanon | 3.7% | 11.7%(-8.00)#19 | 10.9%(-7.20)#1,476 |
| 20. | Talent | 3.8% | 11.7%(-7.90)#20 | 10.9%(-7.10)#1,568 |
| 21. | Sandy | 4.0% | 11.7%(-7.70)#21 | 10.9%(-6.90)#1,684 |
| 22. | Gladstone | 4.4% | 11.7%(-7.30)#22 | 10.9%(-6.50)#1,968 |
| 23. | Coos Bay | 4.5% | 11.7%(-7.20)#23 | 10.9%(-6.40)#2,033 |
| 24. | West Slope | 4.7% | 11.7%(-7.00)#24 | 10.9%(-6.20)#2,207 |
| 25. | Beaverton | 5.3% | 11.7%(-6.40)#25 | 10.9%(-5.60)#2,620 |
| 26. | Bend | 5.4% | 11.7%(-6.30)#26 | 10.9%(-5.50)#2,688 |
| 27. | Sherwood | 5.4% | 11.7%(-6.30)#27 | 10.9%(-5.50)#2,705 |
| 28. | Umatilla | 5.4% | 11.7%(-6.30)#28 | 10.9%(-5.50)#2,721 |
| 29. | Cove | 5.4% | 11.7%(-6.30)#29 | 10.9%(-5.50)#2,762 |
| 30. | Beavercreek | 5.5% | 11.7%(-6.20)#30 | 10.9%(-5.40)#2,808 |
| 31. | Sodaville | 5.5% | 11.7%(-6.20)#31 | 10.9%(-5.40)#2,841 |
| 32. | Cherry Grove | 5.7% | 11.7%(-6.00)#32 | 10.9%(-5.20)#2,998 |
| 33. | Roseburg | 5.9% | 11.7%(-5.80)#33 | 10.9%(-5.00)#3,096 |
| 34. | White City | 6.0% | 11.7%(-5.70)#34 | 10.9%(-4.90)#3,184 |
| 35. | Monroe | 6.1% | 11.7%(-5.60)#35 | 10.9%(-4.80)#3,324 |
| 36. | Moro | 6.2% | 11.7%(-5.50)#36 | 10.9%(-4.70)#3,408 |
| 37. | Milwaukie | 6.4% | 11.7%(-5.30)#37 | 10.9%(-4.50)#3,517 |
| 38. | Stayton | 6.5% | 11.7%(-5.20)#38 | 10.9%(-4.40)#3,605 |
| 39. | Philomath | 6.5% | 11.7%(-5.20)#39 | 10.9%(-4.40)#3,614 |
| 40. | Junction City | 7.0% | 11.7%(-4.70)#40 | 10.9%(-3.90)#3,985 |
| 41. | Gold Beach | 7.0% | 11.7%(-4.70)#41 | 10.9%(-3.90)#4,005 |
| 42. | Canby | 7.1% | 11.7%(-4.60)#42 | 10.9%(-3.80)#4,033 |
| 43. | Klamath Falls | 7.3% | 11.7%(-4.40)#43 | 10.9%(-3.60)#4,194 |
| 44. | Hood River | 7.3% | 11.7%(-4.40)#44 | 10.9%(-3.60)#4,213 |
| 45. | West Linn | 7.4% | 11.7%(-4.30)#45 | 10.9%(-3.50)#4,266 |
| 46. | Oak Hills | 7.4% | 11.7%(-4.30)#46 | 10.9%(-3.50)#4,283 |
| 47. | Prineville | 7.5% | 11.7%(-4.20)#47 | 10.9%(-3.40)#4,354 |
| 48. | Wood Village | 7.5% | 11.7%(-4.20)#48 | 10.9%(-3.40)#4,369 |
| 49. | Ashland | 7.8% | 11.7%(-3.90)#49 | 10.9%(-3.10)#4,598 |
| 50. | Sublimity | 7.9% | 11.7%(-3.80)#50 | 10.9%(-3.00)#4,708 |
| 51. | Yoncalla | 7.9% | 11.7%(-3.80)#51 | 10.9%(-3.00)#4,728 |
| 52. | Metolius | 7.9% | 11.7%(-3.80)#52 | 10.9%(-3.00)#4,732 |
| 53. | Burns | 8.2% | 11.7%(-3.50)#53 | 10.9%(-2.70)#4,920 |
| 54. | Union | 8.2% | 11.7%(-3.50)#54 | 10.9%(-2.70)#4,926 |
| 55. | Myrtle Point | 8.3% | 11.7%(-3.40)#55 | 10.9%(-2.60)#4,983 |
| 56. | Independence | 8.4% | 11.7%(-3.30)#56 | 10.9%(-2.50)#5,062 |
| 57. | Mill City | 8.4% | 11.7%(-3.30)#57 | 10.9%(-2.50)#5,101 |
| 58. | Aumsville | 8.5% | 11.7%(-3.20)#58 | 10.9%(-2.40)#5,154 |
| 59. | Vale | 8.5% | 11.7%(-3.20)#59 | 10.9%(-2.40)#5,170 |
| 60. | Mcminnville | 8.6% | 11.7%(-3.10)#60 | 10.9%(-2.30)#5,216 |
| 61. | Sheridan | 8.6% | 11.7%(-3.10)#61 | 10.9%(-2.30)#5,243 |
| 62. | Gervais | 8.6% | 11.7%(-3.10)#62 | 10.9%(-2.30)#5,255 |
| 63. | Keizer | 8.8% | 11.7%(-2.90)#63 | 10.9%(-2.10)#5,383 |
| 64. | Marlene | 8.9% | 11.7%(-2.80)#64 | 10.9%(-2.00)#5,513 |
| 65. | Medford | 9.2% | 11.7%(-2.50)#65 | 10.9%(-1.70)#5,713 |
| 66. | Sutherlin | 9.3% | 11.7%(-2.40)#66 | 10.9%(-1.60)#5,828 |
| 67. | Tri City | 9.3% | 11.7%(-2.40)#67 | 10.9%(-1.60)#5,837 |
| 68. | Eagle Point | 9.4% | 11.7%(-2.30)#68 | 10.9%(-1.50)#5,910 |
| 69. | Stanfield | 9.4% | 11.7%(-2.30)#69 | 10.9%(-1.50)#5,935 |
| 70. | Gresham | 9.5% | 11.7%(-2.20)#70 | 10.9%(-1.40)#5,949 |
| 71. | Aloha | 9.5% | 11.7%(-2.20)#71 | 10.9%(-1.40)#5,955 |
| 72. | Grants Pass | 9.5% | 11.7%(-2.20)#72 | 10.9%(-1.40)#5,960 |
| 73. | Central Point | 9.5% | 11.7%(-2.20)#73 | 10.9%(-1.40)#5,973 |
| 74. | Monmouth | 9.5% | 11.7%(-2.20)#74 | 10.9%(-1.40)#5,982 |
| 75. | Oatfield | 9.8% | 11.7%(-1.90)#75 | 10.9%(-1.10)#6,210 |
| 76. | Hillsboro | 10.0% | 11.7%(-1.70)#76 | 10.9%(-0.900)#6,337 |
| 77. | Rockcreek | 10.0% | 11.7%(-1.70)#77 | 10.9%(-0.900)#6,363 |
| 78. | Warrenton | 10.1% | 11.7%(-1.60)#78 | 10.9%(-0.800)#6,465 |
| 79. | Vernonia | 10.3% | 11.7%(-1.40)#79 | 10.9%(-0.600)#6,623 |
| 80. | Newberg | 10.4% | 11.7%(-1.30)#80 | 10.9%(-0.500)#6,676 |
| 81. | Newport | 10.6% | 11.7%(-1.10)#81 | 10.9%(-0.300)#6,851 |
| 82. | Springfield | 10.7% | 11.7%(-1.000)#82 | 10.9%(-0.200)#6,903 |
| 83. | Bay City | 10.7% | 11.7%(-1.000)#83 | 10.9%(-0.200)#6,942 |
| 84. | Forest Grove | 10.9% | 11.7%(-0.800)#84 | 10.9%(=0.000)#7,038 |
| 85. | Yamhill | 10.9% | 11.7%(-0.800)#85 | 10.9%(=0.000)#7,083 |
| 86. | Arlington | 10.9% | 11.7%(-0.800)#86 | 10.9%(=0.000)#7,086 |
| 87. | Long Creek | 11.1% | 11.7%(-0.600)#87 | 10.9%(+0.200)#7,241 |
| 88. | Millersburg | 11.3% | 11.7%(-0.400)#88 | 10.9%(+0.400)#7,344 |
| 89. | Irrigon | 11.3% | 11.7%(-0.400)#89 | 10.9%(+0.400)#7,357 |
| 90. | Columbia City | 11.6% | 11.7%(-0.100)#90 | 10.9%(+0.700)#7,552 |
| 91. | Tigard | 11.7% | 11.7%(=0.000)#91 | 10.9%(+0.800)#7,569 |
| 92. | Woodburn | 12.0% | 11.7%(+0.300)#92 | 10.9%(+1.10)#7,757 |
| 93. | Oak Grove | 12.1% | 11.7%(+0.400)#93 | 10.9%(+1.20)#7,828 |
| 94. | Dallas | 12.2% | 11.7%(+0.500)#94 | 10.9%(+1.30)#7,890 |
| 95. | Canyonville | 12.2% | 11.7%(+0.500)#95 | 10.9%(+1.30)#7,913 |
| 96. | Portland | 12.3% | 11.7%(+0.600)#96 | 10.9%(+1.40)#7,923 |
| 97. | Drain | 12.3% | 11.7%(+0.600)#97 | 10.9%(+1.40)#7,962 |
| 98. | West Haven Sylvan | 12.6% | 11.7%(+0.900)#98 | 10.9%(+1.70)#8,144 |
| 99. | Baker City | 13.0% | 11.7%(+1.30)#99 | 10.9%(+2.10)#8,365 |
| 100. | Corvallis | 13.1% | 11.7%(+1.40)#100 | 10.9%(+2.20)#8,412 |
Common Questions
What are the Top 10 Cities with the Lowest Unemployment Rate Amomg Youth Under the Age of 25 in Oregon?
Top 10 Cities with the Lowest Unemployment Rate Amomg Youth Under the Age of 25 in Oregon are:
#1
0.50%
#2
1.0%
#3
1.4%
#4
1.8%
#5
1.8%
#6
2.1%
#7
2.1%
#8
2.3%
#9
2.4%
#10
2.4%
What city has the Lowest Unemployment Rate Amomg Youth Under the Age of 25 in Oregon?
Seaside has the Lowest Unemployment Rate Amomg Youth Under the Age of 25 in Oregon with 0.50%.
What is the Unemployment Rate Amomg Youth Under the Age of 25 in the State of Oregon?
Unemployment Rate Amomg Youth Under the Age of 25 in Oregon is 11.7%.
What is the Unemployment Rate Amomg Youth Under the Age of 25 in the United States?
Unemployment Rate Amomg Youth Under the Age of 25 in the United States is 10.9%.