Cities with the Lowest Unemployment Rate Amomg Youth Under the Age of 25 in Colorado
RELATED REPORTS & OPTIONS
Lowest Unemployment | Youth < 25
Colorado
Compare Cities
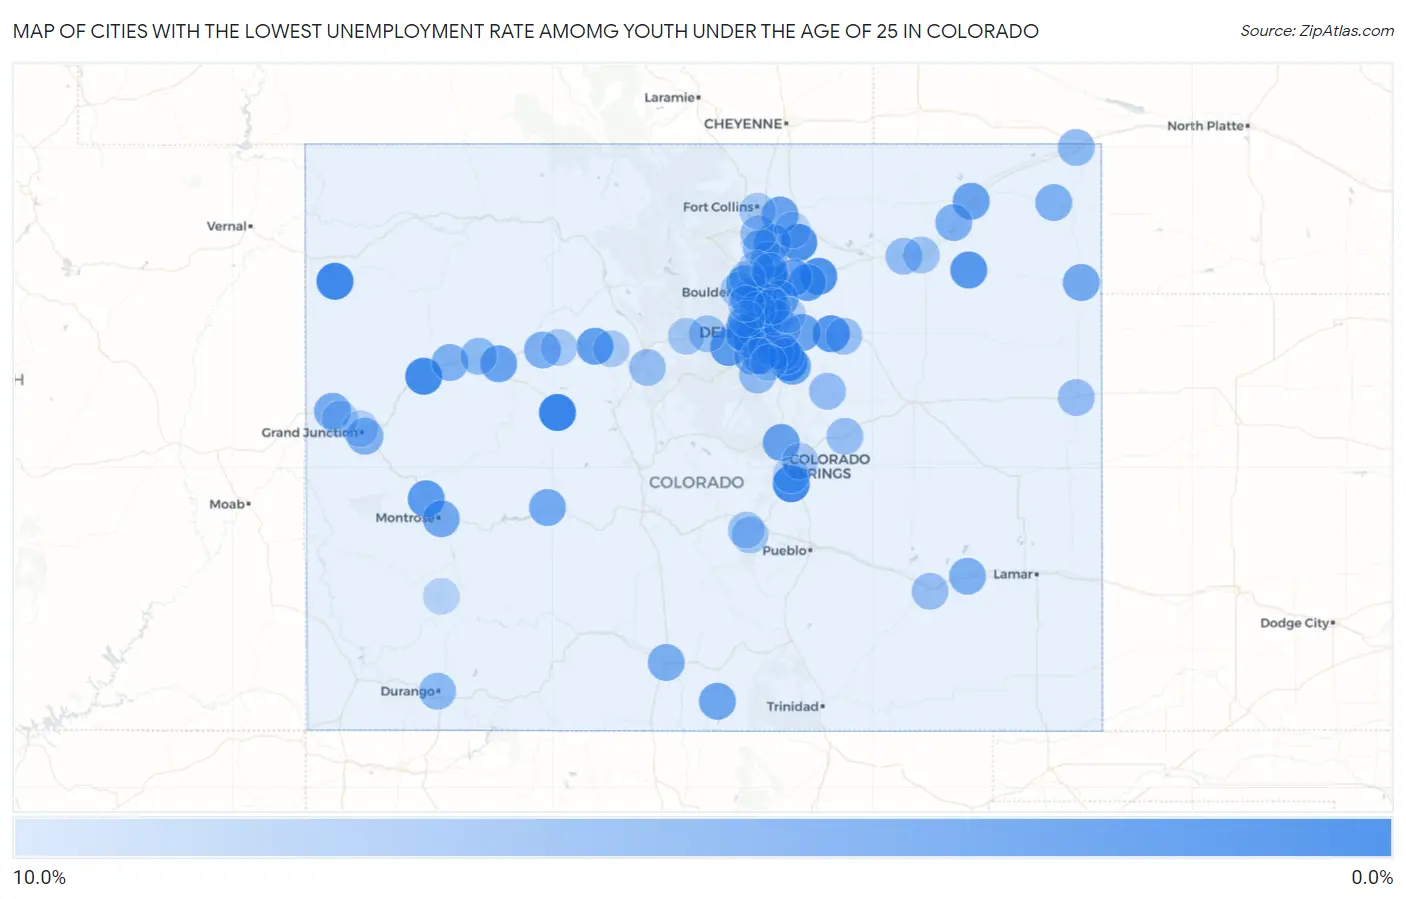
Map of Cities with the Lowest Unemployment Rate Amomg Youth Under the Age of 25 in Colorado
10.0%
0.0%
Cities with the Lowest Unemployment Rate Amomg Youth Under the Age of 25 in Colorado
| City | Youth Unemployment | vs State | vs National | |
| 1. | Aspen | 0.20% | 9.1%(-8.90)#1 | 10.9%(-10.7)#6 |
| 2. | Rangely | 0.70% | 9.1%(-8.40)#2 | 10.9%(-10.2)#72 |
| 3. | Fort Carson | 1.0% | 9.1%(-8.10)#3 | 10.9%(-9.90)#123 |
| 4. | Battlement Mesa | 1.0% | 9.1%(-8.10)#4 | 10.9%(-9.90)#131 |
| 5. | Stonegate | 1.1% | 9.1%(-8.00)#5 | 10.9%(-9.80)#150 |
| 6. | La Salle | 1.8% | 9.1%(-7.30)#6 | 10.9%(-9.10)#380 |
| 7. | Keenesburg | 2.0% | 9.1%(-7.10)#7 | 10.9%(-8.90)#471 |
| 8. | Four Square Mile | 2.3% | 9.1%(-6.80)#8 | 10.9%(-8.60)#579 |
| 9. | Bennett | 2.5% | 9.1%(-6.60)#9 | 10.9%(-8.40)#725 |
| 10. | Akron | 2.6% | 9.1%(-6.50)#10 | 10.9%(-8.30)#811 |
| 11. | Olathe | 2.9% | 9.1%(-6.20)#11 | 10.9%(-8.00)#992 |
| 12. | Twin Lakes Cdp Adams County | 3.0% | 9.1%(-6.10)#12 | 10.9%(-7.90)#1,024 |
| 13. | Evergreen | 3.1% | 9.1%(-6.00)#13 | 10.9%(-7.80)#1,085 |
| 14. | Federal Heights | 3.2% | 9.1%(-5.90)#14 | 10.9%(-7.70)#1,162 |
| 15. | Hudson | 3.2% | 9.1%(-5.90)#15 | 10.9%(-7.70)#1,195 |
| 16. | Gunbarrel | 3.4% | 9.1%(-5.70)#16 | 10.9%(-7.50)#1,298 |
| 17. | Avon | 3.4% | 9.1%(-5.70)#17 | 10.9%(-7.50)#1,310 |
| 18. | Aristocrat Ranchettes | 3.6% | 9.1%(-5.50)#18 | 10.9%(-7.30)#1,456 |
| 19. | Dacono | 3.9% | 9.1%(-5.20)#19 | 10.9%(-7.00)#1,637 |
| 20. | Welby | 4.0% | 9.1%(-5.10)#20 | 10.9%(-6.90)#1,679 |
| 21. | Frederick | 4.0% | 9.1%(-5.10)#21 | 10.9%(-6.90)#1,682 |
| 22. | Severance | 4.0% | 9.1%(-5.10)#22 | 10.9%(-6.90)#1,692 |
| 23. | Air Force Academy | 4.0% | 9.1%(-5.10)#23 | 10.9%(-6.90)#1,697 |
| 24. | Aetna Estates | 4.0% | 9.1%(-5.10)#24 | 10.9%(-6.90)#1,729 |
| 25. | Johnstown | 4.1% | 9.1%(-5.00)#25 | 10.9%(-6.80)#1,759 |
| 26. | Sterling | 4.1% | 9.1%(-5.00)#26 | 10.9%(-6.80)#1,763 |
| 27. | Glenwood Springs | 4.2% | 9.1%(-4.90)#27 | 10.9%(-6.70)#1,839 |
| 28. | Parker | 4.4% | 9.1%(-4.70)#28 | 10.9%(-6.50)#1,954 |
| 29. | San Luis | 4.5% | 9.1%(-4.60)#29 | 10.9%(-6.40)#2,090 |
| 30. | Montrose | 4.7% | 9.1%(-4.40)#30 | 10.9%(-6.20)#2,185 |
| 31. | Wray | 4.7% | 9.1%(-4.40)#31 | 10.9%(-6.20)#2,227 |
| 32. | Todd Creek | 4.8% | 9.1%(-4.30)#32 | 10.9%(-6.10)#2,287 |
| 33. | Fairmount | 4.9% | 9.1%(-4.20)#33 | 10.9%(-6.00)#2,352 |
| 34. | Broomfield | 5.0% | 9.1%(-4.10)#34 | 10.9%(-5.90)#2,404 |
| 35. | Gunnison | 5.0% | 9.1%(-4.10)#35 | 10.9%(-5.90)#2,430 |
| 36. | Ken Caryl | 5.1% | 9.1%(-4.00)#36 | 10.9%(-5.80)#2,471 |
| 37. | Canon City | 5.1% | 9.1%(-4.00)#37 | 10.9%(-5.80)#2,477 |
| 38. | Loma | 5.2% | 9.1%(-3.90)#38 | 10.9%(-5.70)#2,587 |
| 39. | Cherry Creek | 5.4% | 9.1%(-3.70)#39 | 10.9%(-5.50)#2,711 |
| 40. | Alamosa | 5.5% | 9.1%(-3.60)#40 | 10.9%(-5.40)#2,795 |
| 41. | Rifle | 5.7% | 9.1%(-3.40)#41 | 10.9%(-5.20)#2,944 |
| 42. | Gypsum | 5.7% | 9.1%(-3.40)#42 | 10.9%(-5.20)#2,947 |
| 43. | Merino | 5.7% | 9.1%(-3.40)#43 | 10.9%(-5.20)#3,003 |
| 44. | Orchard Mesa | 5.8% | 9.1%(-3.30)#44 | 10.9%(-5.10)#3,028 |
| 45. | Las Animas | 5.8% | 9.1%(-3.30)#45 | 10.9%(-5.10)#3,050 |
| 46. | Paoli | 5.8% | 9.1%(-3.30)#46 | 10.9%(-5.10)#3,085 |
| 47. | Northglenn | 5.9% | 9.1%(-3.20)#47 | 10.9%(-5.00)#3,095 |
| 48. | Louisville | 5.9% | 9.1%(-3.20)#48 | 10.9%(-5.00)#3,099 |
| 49. | Berthoud | 6.0% | 9.1%(-3.10)#49 | 10.9%(-4.90)#3,185 |
| 50. | West Pleasant View | 6.0% | 9.1%(-3.10)#50 | 10.9%(-4.90)#3,203 |
| 51. | Lakewood | 6.4% | 9.1%(-2.70)#51 | 10.9%(-4.50)#3,502 |
| 52. | Mead | 6.5% | 9.1%(-2.60)#52 | 10.9%(-4.40)#3,615 |
| 53. | Wheat Ridge | 6.6% | 9.1%(-2.50)#53 | 10.9%(-4.30)#3,656 |
| 54. | Durango | 6.7% | 9.1%(-2.40)#54 | 10.9%(-4.20)#3,743 |
| 55. | New Castle | 6.8% | 9.1%(-2.30)#55 | 10.9%(-4.10)#3,840 |
| 56. | Julesburg | 6.8% | 9.1%(-2.30)#56 | 10.9%(-4.10)#3,868 |
| 57. | Berkley | 7.2% | 9.1%(-1.90)#57 | 10.9%(-3.70)#4,130 |
| 58. | Roxborough Park | 7.2% | 9.1%(-1.90)#58 | 10.9%(-3.70)#4,136 |
| 59. | Centennial | 7.4% | 9.1%(-1.70)#59 | 10.9%(-3.50)#4,253 |
| 60. | Loveland | 7.4% | 9.1%(-1.70)#60 | 10.9%(-3.50)#4,256 |
| 61. | Golden | 7.4% | 9.1%(-1.70)#61 | 10.9%(-3.50)#4,269 |
| 62. | Fort Morgan | 7.4% | 9.1%(-1.70)#62 | 10.9%(-3.50)#4,284 |
| 63. | Burlington | 7.4% | 9.1%(-1.70)#63 | 10.9%(-3.50)#4,300 |
| 64. | Kiowa | 7.4% | 9.1%(-1.70)#64 | 10.9%(-3.50)#4,325 |
| 65. | La Junta | 7.6% | 9.1%(-1.50)#65 | 10.9%(-3.30)#4,436 |
| 66. | Breckenridge | 7.6% | 9.1%(-1.50)#66 | 10.9%(-3.30)#4,442 |
| 67. | Calhan | 7.6% | 9.1%(-1.50)#67 | 10.9%(-3.30)#4,492 |
| 68. | Littleton | 7.7% | 9.1%(-1.40)#68 | 10.9%(-3.20)#4,524 |
| 69. | Strasburg | 7.7% | 9.1%(-1.40)#69 | 10.9%(-3.20)#4,566 |
| 70. | Idaho Springs | 7.8% | 9.1%(-1.30)#70 | 10.9%(-3.10)#4,636 |
| 71. | Brush | 8.0% | 9.1%(-1.10)#71 | 10.9%(-2.90)#4,776 |
| 72. | Englewood | 8.1% | 9.1%(-1.000)#72 | 10.9%(-2.80)#4,812 |
| 73. | Greenwood Village | 8.1% | 9.1%(-1.000)#73 | 10.9%(-2.80)#4,826 |
| 74. | Coal Creek | 8.1% | 9.1%(-1.000)#74 | 10.9%(-2.80)#4,876 |
| 75. | Lafayette | 8.3% | 9.1%(-0.800)#75 | 10.9%(-2.60)#4,949 |
| 76. | Derby | 8.4% | 9.1%(-0.700)#76 | 10.9%(-2.50)#5,063 |
| 77. | Dove Valley | 8.6% | 9.1%(-0.500)#77 | 10.9%(-2.30)#5,245 |
| 78. | Georgetown | 8.6% | 9.1%(-0.500)#78 | 10.9%(-2.30)#5,271 |
| 79. | Williamsburg | 8.6% | 9.1%(-0.500)#79 | 10.9%(-2.30)#5,278 |
| 80. | Boulder | 8.7% | 9.1%(-0.400)#80 | 10.9%(-2.20)#5,300 |
| 81. | Eagle | 8.7% | 9.1%(-0.400)#81 | 10.9%(-2.20)#5,336 |
| 82. | Fort Collins | 8.8% | 9.1%(-0.300)#82 | 10.9%(-2.10)#5,376 |
| 83. | Longmont | 8.8% | 9.1%(-0.300)#83 | 10.9%(-2.10)#5,377 |
| 84. | Cimarron Hills | 8.8% | 9.1%(-0.300)#84 | 10.9%(-2.10)#5,394 |
| 85. | Vail | 8.8% | 9.1%(-0.300)#85 | 10.9%(-2.10)#5,420 |
| 86. | Columbine | 8.9% | 9.1%(-0.200)#86 | 10.9%(-2.00)#5,482 |
| 87. | Denver | 9.0% | 9.1%(-0.100)#87 | 10.9%(-1.90)#5,535 |
| 88. | Commerce City | 9.2% | 9.1%(+0.100)#88 | 10.9%(-1.70)#5,718 |
| 89. | Fruita | 9.2% | 9.1%(+0.100)#89 | 10.9%(-1.70)#5,743 |
| 90. | Niwot | 9.2% | 9.1%(+0.100)#90 | 10.9%(-1.70)#5,762 |
| 91. | Westminster | 9.3% | 9.1%(+0.200)#91 | 10.9%(-1.60)#5,792 |
| 92. | Firestone | 9.4% | 9.1%(+0.300)#92 | 10.9%(-1.50)#5,901 |
| 93. | Highlands Ranch | 9.5% | 9.1%(+0.400)#93 | 10.9%(-1.40)#5,950 |
| 94. | Grand Junction | 9.5% | 9.1%(+0.400)#94 | 10.9%(-1.40)#5,954 |
| 95. | Stratmoor | 9.5% | 9.1%(+0.400)#95 | 10.9%(-1.40)#5,986 |
| 96. | Thornton | 9.6% | 9.1%(+0.500)#96 | 10.9%(-1.30)#6,030 |
| 97. | Arvada | 9.8% | 9.1%(+0.700)#97 | 10.9%(-1.10)#6,188 |
| 98. | Superior | 9.9% | 9.1%(+0.800)#98 | 10.9%(-1.000)#6,276 |
| 99. | Mountain Village | 9.9% | 9.1%(+0.800)#99 | 10.9%(-1.000)#6,304 |
| 100. | Greeley | 10.0% | 9.1%(+0.900)#100 | 10.9%(-0.900)#6,336 |
Common Questions
What are the Top 10 Cities with the Lowest Unemployment Rate Amomg Youth Under the Age of 25 in Colorado?
Top 10 Cities with the Lowest Unemployment Rate Amomg Youth Under the Age of 25 in Colorado are:
#1
0.20%
#2
0.70%
#3
1.0%
#4
1.0%
#5
1.1%
#6
1.8%
#7
2.0%
#8
2.5%
#9
2.6%
#10
2.9%
What city has the Lowest Unemployment Rate Amomg Youth Under the Age of 25 in Colorado?
Aspen has the Lowest Unemployment Rate Amomg Youth Under the Age of 25 in Colorado with 0.20%.
What is the Unemployment Rate Amomg Youth Under the Age of 25 in the State of Colorado?
Unemployment Rate Amomg Youth Under the Age of 25 in Colorado is 9.1%.
What is the Unemployment Rate Amomg Youth Under the Age of 25 in the United States?
Unemployment Rate Amomg Youth Under the Age of 25 in the United States is 10.9%.