Cities with the Lowest Unemployment Rate Amomg Youth Under the Age of 25 in Ohio
RELATED REPORTS & OPTIONS
Lowest Unemployment | Youth < 25
Ohio
Compare Cities
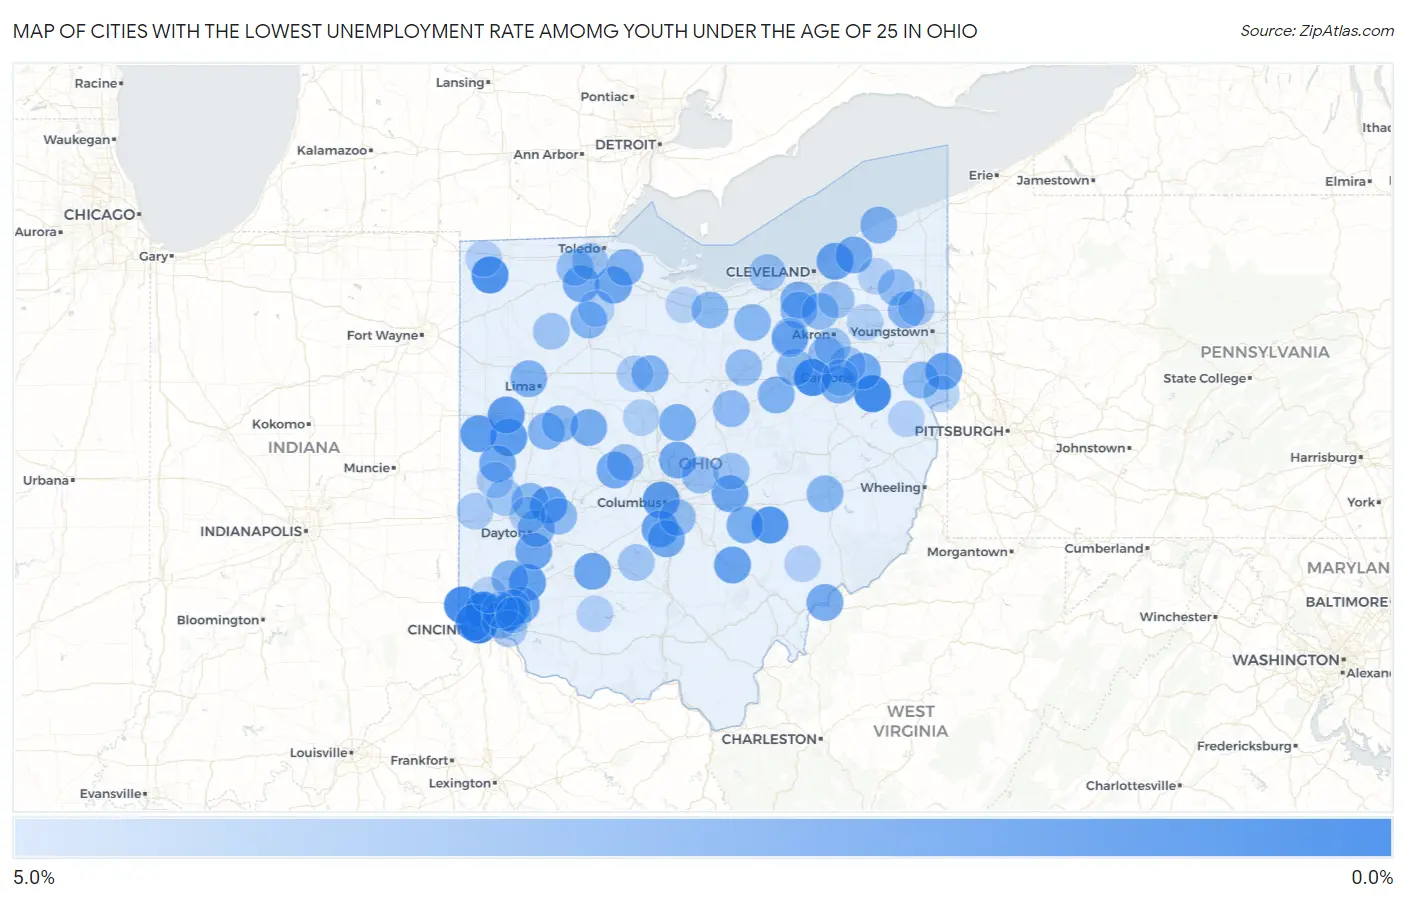
Map of Cities with the Lowest Unemployment Rate Amomg Youth Under the Age of 25 in Ohio
5.0%
0.0%
Cities with the Lowest Unemployment Rate Amomg Youth Under the Age of 25 in Ohio
| City | Youth Unemployment | vs State | vs National | |
| 1. | Covedale | 0.40% | 9.9%(-9.50)#1 | 10.9%(-10.5)#26 |
| 2. | Rossmoyne | 0.60% | 9.9%(-9.30)#2 | 10.9%(-10.3)#61 |
| 3. | Malvern | 0.70% | 9.9%(-9.20)#3 | 10.9%(-10.2)#74 |
| 4. | White Oak | 0.80% | 9.9%(-9.10)#4 | 10.9%(-10.1)#81 |
| 5. | Harrison | 0.80% | 9.9%(-9.10)#5 | 10.9%(-10.1)#83 |
| 6. | Dalton | 0.80% | 9.9%(-9.10)#6 | 10.9%(-10.1)#97 |
| 7. | Groesbeck | 1.0% | 9.9%(-8.90)#7 | 10.9%(-9.90)#128 |
| 8. | Bryan | 1.1% | 9.9%(-8.80)#8 | 10.9%(-9.80)#151 |
| 9. | Roseville | 1.3% | 9.9%(-8.60)#9 | 10.9%(-9.60)#205 |
| 10. | Grandview Heights | 1.5% | 9.9%(-8.40)#10 | 10.9%(-9.40)#248 |
| 11. | Minster | 1.5% | 9.9%(-8.40)#11 | 10.9%(-9.40)#259 |
| 12. | St Henry | 1.5% | 9.9%(-8.40)#12 | 10.9%(-9.40)#261 |
| 13. | St Marys | 1.6% | 9.9%(-8.30)#13 | 10.9%(-9.30)#281 |
| 14. | Lebanon | 1.7% | 9.9%(-8.20)#14 | 10.9%(-9.20)#306 |
| 15. | New Carlisle | 1.7% | 9.9%(-8.20)#15 | 10.9%(-9.20)#327 |
| 16. | Mack | 1.8% | 9.9%(-8.10)#16 | 10.9%(-9.10)#360 |
| 17. | Richmond Heights | 1.8% | 9.9%(-8.10)#17 | 10.9%(-9.10)#363 |
| 18. | Logan | 1.8% | 9.9%(-8.10)#18 | 10.9%(-9.10)#366 |
| 19. | East Palestine | 1.8% | 9.9%(-8.10)#19 | 10.9%(-9.10)#374 |
| 20. | Commercial Point | 1.8% | 9.9%(-8.10)#20 | 10.9%(-9.10)#379 |
| 21. | Centerville | 2.0% | 9.9%(-7.90)#21 | 10.9%(-8.90)#436 |
| 22. | Loveland | 2.0% | 9.9%(-7.90)#22 | 10.9%(-8.90)#443 |
| 23. | Heath | 2.0% | 9.9%(-7.90)#23 | 10.9%(-8.90)#447 |
| 24. | Sabina | 2.0% | 9.9%(-7.90)#24 | 10.9%(-8.90)#466 |
| 25. | Pemberville | 2.0% | 9.9%(-7.90)#25 | 10.9%(-8.90)#474 |
| 26. | Louisville | 2.1% | 9.9%(-7.80)#26 | 10.9%(-8.80)#493 |
| 27. | Sunbury | 2.1% | 9.9%(-7.80)#27 | 10.9%(-8.80)#499 |
| 28. | Versailles | 2.1% | 9.9%(-7.80)#28 | 10.9%(-8.80)#511 |
| 29. | South Bloomfield | 2.1% | 9.9%(-7.80)#29 | 10.9%(-8.80)#515 |
| 30. | Kirtland | 2.2% | 9.9%(-7.70)#30 | 10.9%(-8.70)#545 |
| 31. | Belpre | 2.2% | 9.9%(-7.70)#31 | 10.9%(-8.70)#546 |
| 32. | Milford Center | 2.2% | 9.9%(-7.70)#32 | 10.9%(-8.70)#572 |
| 33. | Tontogany | 2.2% | 9.9%(-7.70)#33 | 10.9%(-8.70)#576 |
| 34. | Strongsville | 2.3% | 9.9%(-7.60)#34 | 10.9%(-8.60)#578 |
| 35. | Rushsylvania | 2.3% | 9.9%(-7.60)#35 | 10.9%(-8.60)#635 |
| 36. | Richville | 2.4% | 9.9%(-7.50)#36 | 10.9%(-8.50)#666 |
| 37. | Cardington | 2.4% | 9.9%(-7.50)#37 | 10.9%(-8.50)#676 |
| 38. | Somerset | 2.4% | 9.9%(-7.50)#38 | 10.9%(-8.50)#683 |
| 39. | Riverside | 2.5% | 9.9%(-7.40)#39 | 10.9%(-8.40)#700 |
| 40. | Elida | 2.5% | 9.9%(-7.40)#40 | 10.9%(-8.40)#736 |
| 41. | Shreve | 2.5% | 9.9%(-7.40)#41 | 10.9%(-8.40)#744 |
| 42. | Monroe | 2.6% | 9.9%(-7.30)#42 | 10.9%(-8.30)#762 |
| 43. | North Baltimore | 2.6% | 9.9%(-7.30)#43 | 10.9%(-8.30)#790 |
| 44. | Genoa | 2.6% | 9.9%(-7.30)#44 | 10.9%(-8.30)#805 |
| 45. | Jackson Center | 2.6% | 9.9%(-7.30)#45 | 10.9%(-8.30)#813 |
| 46. | North Perry | 2.6% | 9.9%(-7.30)#46 | 10.9%(-8.30)#816 |
| 47. | Leavittsburg | 2.7% | 9.9%(-7.20)#47 | 10.9%(-8.20)#875 |
| 48. | Nevada | 2.7% | 9.9%(-7.20)#48 | 10.9%(-8.20)#883 |
| 49. | Norwalk | 2.8% | 9.9%(-7.10)#49 | 10.9%(-8.10)#898 |
| 50. | Tipp City | 2.8% | 9.9%(-7.10)#50 | 10.9%(-8.10)#908 |
| 51. | Cambridge | 2.8% | 9.9%(-7.10)#51 | 10.9%(-8.10)#909 |
| 52. | Wellington | 2.8% | 9.9%(-7.10)#52 | 10.9%(-8.10)#925 |
| 53. | Lisbon | 2.8% | 9.9%(-7.10)#53 | 10.9%(-8.10)#928 |
| 54. | Smithville | 2.8% | 9.9%(-7.10)#54 | 10.9%(-8.10)#940 |
| 55. | Lakeview | 2.8% | 9.9%(-7.10)#55 | 10.9%(-8.10)#942 |
| 56. | Brunswick | 2.9% | 9.9%(-7.00)#56 | 10.9%(-8.00)#954 |
| 57. | New Franklin | 3.0% | 9.9%(-6.90)#57 | 10.9%(-7.90)#1,019 |
| 58. | Enon | 3.0% | 9.9%(-6.90)#58 | 10.9%(-7.90)#1,042 |
| 59. | Roseland | 3.0% | 9.9%(-6.90)#59 | 10.9%(-7.90)#1,049 |
| 60. | Butler | 3.0% | 9.9%(-6.90)#60 | 10.9%(-7.90)#1,056 |
| 61. | Ashland | 3.1% | 9.9%(-6.80)#61 | 10.9%(-7.80)#1,077 |
| 62. | Norwood | 3.1% | 9.9%(-6.80)#62 | 10.9%(-7.80)#1,078 |
| 63. | Montgomery | 3.1% | 9.9%(-6.80)#63 | 10.9%(-7.80)#1,082 |
| 64. | Groveport | 3.1% | 9.9%(-6.80)#64 | 10.9%(-7.80)#1,093 |
| 65. | Johnstown | 3.1% | 9.9%(-6.80)#65 | 10.9%(-7.80)#1,098 |
| 66. | Whitehouse | 3.1% | 9.9%(-6.80)#66 | 10.9%(-7.80)#1,100 |
| 67. | Richfield | 3.1% | 9.9%(-6.80)#67 | 10.9%(-7.80)#1,106 |
| 68. | West Farmington | 3.1% | 9.9%(-6.80)#68 | 10.9%(-7.80)#1,137 |
| 69. | Marysville | 3.2% | 9.9%(-6.70)#69 | 10.9%(-7.70)#1,154 |
| 70. | Chippewa Lake | 3.2% | 9.9%(-6.70)#70 | 10.9%(-7.70)#1,216 |
| 71. | Gloria Glens Park | 3.2% | 9.9%(-6.70)#71 | 10.9%(-7.70)#1,221 |
| 72. | Maumee | 3.3% | 9.9%(-6.60)#72 | 10.9%(-7.60)#1,234 |
| 73. | Macedonia | 3.3% | 9.9%(-6.60)#73 | 10.9%(-7.60)#1,235 |
| 74. | Sheffield Lake | 3.3% | 9.9%(-6.60)#74 | 10.9%(-7.60)#1,241 |
| 75. | St Louisville | 3.3% | 9.9%(-6.60)#75 | 10.9%(-7.60)#1,281 |
| 76. | North Canton | 3.4% | 9.9%(-6.50)#76 | 10.9%(-7.50)#1,289 |
| 77. | West Leipsic | 3.4% | 9.9%(-6.50)#77 | 10.9%(-7.50)#1,347 |
| 78. | Portage Lakes | 3.5% | 9.9%(-6.40)#78 | 10.9%(-7.40)#1,365 |
| 79. | Morgandale | 3.5% | 9.9%(-6.40)#79 | 10.9%(-7.40)#1,393 |
| 80. | New Holland | 3.5% | 9.9%(-6.40)#80 | 10.9%(-7.40)#1,400 |
| 81. | Laura | 3.5% | 9.9%(-6.40)#81 | 10.9%(-7.40)#1,405 |
| 82. | Perry Heights | 3.6% | 9.9%(-6.30)#82 | 10.9%(-7.30)#1,435 |
| 83. | Turpin Hills | 3.6% | 9.9%(-6.30)#83 | 10.9%(-7.30)#1,441 |
| 84. | Upper Sandusky | 3.7% | 9.9%(-6.20)#84 | 10.9%(-7.20)#1,492 |
| 85. | Eldorado | 3.7% | 9.9%(-6.20)#85 | 10.9%(-7.20)#1,529 |
| 86. | Gettysburg | 3.7% | 9.9%(-6.20)#86 | 10.9%(-7.20)#1,531 |
| 87. | Vandalia | 3.8% | 9.9%(-6.10)#87 | 10.9%(-7.10)#1,551 |
| 88. | Calcutta | 3.8% | 9.9%(-6.10)#88 | 10.9%(-7.10)#1,579 |
| 89. | Jerry City | 3.9% | 9.9%(-6.00)#89 | 10.9%(-7.00)#1,665 |
| 90. | Green Camp | 3.9% | 9.9%(-6.00)#90 | 10.9%(-7.00)#1,668 |
| 91. | Ravenna | 4.0% | 9.9%(-5.90)#91 | 10.9%(-6.90)#1,688 |
| 92. | Hillsboro | 4.0% | 9.9%(-5.90)#92 | 10.9%(-6.90)#1,698 |
| 93. | Montpelier | 4.0% | 9.9%(-5.90)#93 | 10.9%(-6.90)#1,705 |
| 94. | Lockland | 4.0% | 9.9%(-5.90)#94 | 10.9%(-6.90)#1,709 |
| 95. | Burton | 4.0% | 9.9%(-5.90)#95 | 10.9%(-6.90)#1,724 |
| 96. | Stockport | 4.0% | 9.9%(-5.90)#96 | 10.9%(-6.90)#1,738 |
| 97. | Bergholz | 4.0% | 9.9%(-5.90)#97 | 10.9%(-6.90)#1,741 |
| 98. | Fairfield | 4.1% | 9.9%(-5.80)#98 | 10.9%(-6.80)#1,753 |
| 99. | Bellevue | 4.1% | 9.9%(-5.80)#99 | 10.9%(-6.80)#1,772 |
| 100. | The Village Of Indian Hill | 4.1% | 9.9%(-5.80)#100 | 10.9%(-6.80)#1,778 |
Common Questions
What are the Top 10 Cities with the Lowest Unemployment Rate Amomg Youth Under the Age of 25 in Ohio?
Top 10 Cities with the Lowest Unemployment Rate Amomg Youth Under the Age of 25 in Ohio are:
What city has the Lowest Unemployment Rate Amomg Youth Under the Age of 25 in Ohio?
Covedale has the Lowest Unemployment Rate Amomg Youth Under the Age of 25 in Ohio with 0.40%.
What is the Unemployment Rate Amomg Youth Under the Age of 25 in the State of Ohio?
Unemployment Rate Amomg Youth Under the Age of 25 in Ohio is 9.9%.
What is the Unemployment Rate Amomg Youth Under the Age of 25 in the United States?
Unemployment Rate Amomg Youth Under the Age of 25 in the United States is 10.9%.