Cities with the Lowest Unemployment Rate Amomg Youth Under the Age of 25 in Nebraska
RELATED REPORTS & OPTIONS
Lowest Unemployment | Youth < 25
Nebraska
Compare Cities
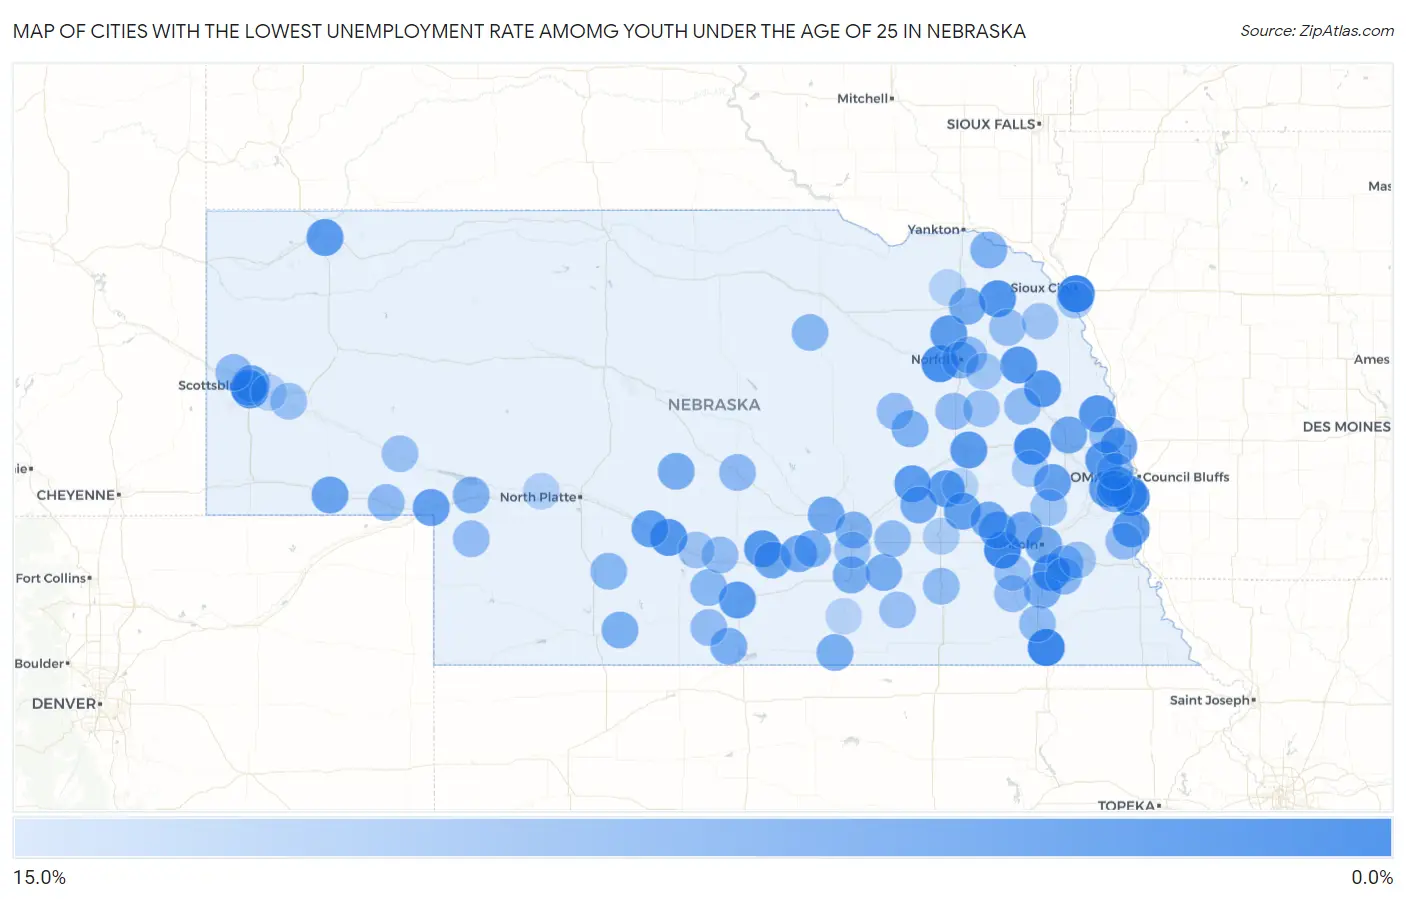
Map of Cities with the Lowest Unemployment Rate Amomg Youth Under the Age of 25 in Nebraska
15.0%
0.0%
Cities with the Lowest Unemployment Rate Amomg Youth Under the Age of 25 in Nebraska
| City | Youth Unemployment | vs State | vs National | |
| 1. | South Sioux City | 0.30% | 6.8%(-6.50)#1 | 10.9%(-10.6)#14 |
| 2. | Wymore | 0.70% | 6.8%(-6.10)#2 | 10.9%(-10.2)#75 |
| 3. | Milford | 0.90% | 6.8%(-5.90)#3 | 10.9%(-10.00)#108 |
| 4. | North Bend | 1.5% | 6.8%(-5.30)#4 | 10.9%(-9.40)#269 |
| 5. | Offutt Afb | 1.6% | 6.8%(-5.20)#5 | 10.9%(-9.30)#286 |
| 6. | Battle Creek | 1.8% | 6.8%(-5.00)#6 | 10.9%(-9.10)#389 |
| 7. | Hickman | 2.0% | 6.8%(-4.80)#7 | 10.9%(-8.90)#465 |
| 8. | Laurel | 2.7% | 6.8%(-4.10)#8 | 10.9%(-8.20)#879 |
| 9. | Herman | 2.9% | 6.8%(-3.90)#9 | 10.9%(-8.00)#1,010 |
| 10. | Gering | 3.0% | 6.8%(-3.80)#10 | 10.9%(-7.90)#1,023 |
| 11. | Cozad | 3.0% | 6.8%(-3.80)#11 | 10.9%(-7.90)#1,036 |
| 12. | Bennington | 3.0% | 6.8%(-3.80)#12 | 10.9%(-7.90)#1,044 |
| 13. | West Point | 3.1% | 6.8%(-3.70)#13 | 10.9%(-7.80)#1,108 |
| 14. | Wisner | 3.1% | 6.8%(-3.70)#14 | 10.9%(-7.80)#1,131 |
| 15. | Riverdale | 3.1% | 6.8%(-3.70)#15 | 10.9%(-7.80)#1,146 |
| 16. | Murray | 3.2% | 6.8%(-3.60)#16 | 10.9%(-7.70)#1,219 |
| 17. | Columbus | 3.3% | 6.8%(-3.50)#17 | 10.9%(-7.60)#1,228 |
| 18. | Osceola | 3.3% | 6.8%(-3.50)#18 | 10.9%(-7.60)#1,270 |
| 19. | Holdrege | 3.4% | 6.8%(-3.40)#19 | 10.9%(-7.50)#1,315 |
| 20. | Clarks | 3.4% | 6.8%(-3.40)#20 | 10.9%(-7.50)#1,345 |
| 21. | Chalco | 3.5% | 6.8%(-3.30)#21 | 10.9%(-7.40)#1,355 |
| 22. | Ralston | 3.5% | 6.8%(-3.30)#22 | 10.9%(-7.40)#1,364 |
| 23. | Chadron | 3.5% | 6.8%(-3.30)#23 | 10.9%(-7.40)#1,369 |
| 24. | Pierce | 3.7% | 6.8%(-3.10)#24 | 10.9%(-7.20)#1,511 |
| 25. | Gothenburg | 4.1% | 6.8%(-2.70)#25 | 10.9%(-6.80)#1,789 |
| 26. | Gresham | 4.1% | 6.8%(-2.70)#26 | 10.9%(-6.80)#1,813 |
| 27. | Big Springs | 4.3% | 6.8%(-2.50)#27 | 10.9%(-6.60)#1,944 |
| 28. | Bellevue | 4.4% | 6.8%(-2.40)#28 | 10.9%(-6.50)#1,952 |
| 29. | Fort Calhoun | 4.4% | 6.8%(-2.40)#29 | 10.9%(-6.50)#2,009 |
| 30. | Wahoo | 4.5% | 6.8%(-2.30)#30 | 10.9%(-6.40)#2,060 |
| 31. | Seward | 4.6% | 6.8%(-2.20)#31 | 10.9%(-6.30)#2,132 |
| 32. | Scottsbluff | 4.7% | 6.8%(-2.10)#32 | 10.9%(-6.20)#2,193 |
| 33. | Sidney | 4.7% | 6.8%(-2.10)#33 | 10.9%(-6.20)#2,209 |
| 34. | Kearney | 5.1% | 6.8%(-1.70)#34 | 10.9%(-5.80)#2,470 |
| 35. | Nickerson | 5.2% | 6.8%(-1.60)#35 | 10.9%(-5.70)#2,609 |
| 36. | Malcolm | 5.4% | 6.8%(-1.40)#36 | 10.9%(-5.50)#2,767 |
| 37. | Cairo | 5.5% | 6.8%(-1.30)#37 | 10.9%(-5.40)#2,830 |
| 38. | Staplehurst | 5.5% | 6.8%(-1.30)#38 | 10.9%(-5.40)#2,845 |
| 39. | Gibbon | 5.7% | 6.8%(-1.10)#39 | 10.9%(-5.20)#2,974 |
| 40. | Polk | 5.7% | 6.8%(-1.10)#40 | 10.9%(-5.20)#3,001 |
| 41. | Cortland | 5.8% | 6.8%(-1.00)#41 | 10.9%(-5.10)#3,071 |
| 42. | Lincoln | 5.9% | 6.8%(-0.900)#42 | 10.9%(-5.00)#3,086 |
| 43. | Hastings | 6.0% | 6.8%(-0.800)#43 | 10.9%(-4.90)#3,171 |
| 44. | Randolph | 6.0% | 6.8%(-0.800)#44 | 10.9%(-4.90)#3,238 |
| 45. | Terrytown | 6.0% | 6.8%(-0.800)#45 | 10.9%(-4.90)#3,251 |
| 46. | Callaway | 6.0% | 6.8%(-0.800)#46 | 10.9%(-4.90)#3,253 |
| 47. | Harvard | 6.1% | 6.8%(-0.700)#47 | 10.9%(-4.80)#3,320 |
| 48. | Orleans | 6.2% | 6.8%(-0.600)#48 | 10.9%(-4.70)#3,406 |
| 49. | Shelton | 6.3% | 6.8%(-0.500)#49 | 10.9%(-4.60)#3,477 |
| 50. | Red Cloud | 6.3% | 6.8%(-0.500)#50 | 10.9%(-4.60)#3,488 |
| 51. | Indianola | 6.4% | 6.8%(-0.400)#51 | 10.9%(-4.50)#3,569 |
| 52. | Grand Island | 6.6% | 6.8%(-0.200)#52 | 10.9%(-4.30)#3,655 |
| 53. | Norfolk | 6.6% | 6.8%(-0.200)#53 | 10.9%(-4.30)#3,661 |
| 54. | Wynot | 6.6% | 6.8%(-0.200)#54 | 10.9%(-4.30)#3,726 |
| 55. | St Edward | 6.7% | 6.8%(-0.100)#55 | 10.9%(-4.20)#3,794 |
| 56. | Papillion | 6.8% | 6.8%(=0.000)#56 | 10.9%(-4.10)#3,811 |
| 57. | Ogallala | 6.8% | 6.8%(=0.000)#57 | 10.9%(-4.10)#3,841 |
| 58. | La Vista | 7.3% | 6.8%(+0.500)#58 | 10.9%(-3.60)#4,202 |
| 59. | Bennet | 7.5% | 6.8%(+0.700)#59 | 10.9%(-3.40)#4,389 |
| 60. | Curtis | 7.6% | 6.8%(+0.800)#60 | 10.9%(-3.30)#4,467 |
| 61. | Bertrand | 7.6% | 6.8%(+0.800)#61 | 10.9%(-3.30)#4,474 |
| 62. | Chambers | 7.6% | 6.8%(+0.800)#62 | 10.9%(-3.30)#4,489 |
| 63. | Panama | 7.6% | 6.8%(+0.800)#63 | 10.9%(-3.30)#4,501 |
| 64. | Chappell | 8.0% | 6.8%(+1.20)#64 | 10.9%(-2.90)#4,791 |
| 65. | Ansley | 8.0% | 6.8%(+1.20)#65 | 10.9%(-2.90)#4,796 |
| 66. | Beatrice | 8.1% | 6.8%(+1.30)#66 | 10.9%(-2.80)#4,831 |
| 67. | Humphrey | 8.1% | 6.8%(+1.30)#67 | 10.9%(-2.80)#4,870 |
| 68. | Mitchell | 8.2% | 6.8%(+1.40)#68 | 10.9%(-2.70)#4,930 |
| 69. | Blair | 8.3% | 6.8%(+1.50)#69 | 10.9%(-2.60)#4,969 |
| 70. | Woodland Park | 8.3% | 6.8%(+1.50)#70 | 10.9%(-2.60)#4,992 |
| 71. | Dodge | 8.3% | 6.8%(+1.50)#71 | 10.9%(-2.60)#5,018 |
| 72. | Aurora | 8.4% | 6.8%(+1.60)#72 | 10.9%(-2.50)#5,080 |
| 73. | Geneva | 8.4% | 6.8%(+1.60)#73 | 10.9%(-2.50)#5,094 |
| 74. | Overton | 8.5% | 6.8%(+1.70)#74 | 10.9%(-2.40)#5,188 |
| 75. | Wilber | 8.6% | 6.8%(+1.80)#75 | 10.9%(-2.30)#5,260 |
| 76. | Albion | 8.6% | 6.8%(+1.80)#76 | 10.9%(-2.30)#5,263 |
| 77. | Grant | 8.6% | 6.8%(+1.80)#77 | 10.9%(-2.30)#5,267 |
| 78. | Oxford | 8.6% | 6.8%(+1.80)#78 | 10.9%(-2.30)#5,277 |
| 79. | Nehawka | 8.6% | 6.8%(+1.80)#79 | 10.9%(-2.30)#5,293 |
| 80. | Omaha | 8.7% | 6.8%(+1.90)#80 | 10.9%(-2.20)#5,296 |
| 81. | Wayne | 8.7% | 6.8%(+1.90)#81 | 10.9%(-2.20)#5,342 |
| 82. | Edgar | 8.8% | 6.8%(+2.00)#82 | 10.9%(-2.10)#5,462 |
| 83. | Crete | 8.9% | 6.8%(+2.10)#83 | 10.9%(-2.00)#5,506 |
| 84. | Oshkosh | 9.0% | 6.8%(+2.20)#84 | 10.9%(-1.90)#5,591 |
| 85. | Leigh | 9.0% | 6.8%(+2.20)#85 | 10.9%(-1.90)#5,616 |
| 86. | Bayard | 9.1% | 6.8%(+2.30)#86 | 10.9%(-1.80)#5,702 |
| 87. | Ceresco | 9.3% | 6.8%(+2.50)#87 | 10.9%(-1.60)#5,851 |
| 88. | Doniphan | 9.3% | 6.8%(+2.50)#88 | 10.9%(-1.60)#5,867 |
| 89. | Lexington | 9.4% | 6.8%(+2.60)#89 | 10.9%(-1.50)#5,909 |
| 90. | Emerson | 9.5% | 6.8%(+2.70)#90 | 10.9%(-1.40)#6,012 |
| 91. | Palmyra | 9.5% | 6.8%(+2.70)#91 | 10.9%(-1.40)#6,017 |
| 92. | Stanton | 9.7% | 6.8%(+2.90)#92 | 10.9%(-1.20)#6,167 |
| 93. | Dakota City | 9.8% | 6.8%(+3.00)#93 | 10.9%(-1.10)#6,228 |
| 94. | Prague | 10.1% | 6.8%(+3.30)#94 | 10.9%(-0.800)#6,494 |
| 95. | York | 10.6% | 6.8%(+3.80)#95 | 10.9%(-0.300)#6,856 |
| 96. | Sutherland | 11.1% | 6.8%(+4.30)#96 | 10.9%(+0.200)#7,190 |
| 97. | Minatare | 11.1% | 6.8%(+4.30)#97 | 10.9%(+0.200)#7,201 |
| 98. | Shelby | 11.4% | 6.8%(+4.60)#98 | 10.9%(+0.500)#7,415 |
| 99. | Wausa | 11.4% | 6.8%(+4.60)#99 | 10.9%(+0.500)#7,420 |
| 100. | Blue Hill | 11.5% | 6.8%(+4.70)#100 | 10.9%(+0.600)#7,481 |
Common Questions
What are the Top 10 Cities with the Lowest Unemployment Rate Amomg Youth Under the Age of 25 in Nebraska?
Top 10 Cities with the Lowest Unemployment Rate Amomg Youth Under the Age of 25 in Nebraska are:
#1
0.30%
#2
0.70%
#3
0.90%
#4
1.5%
#5
1.6%
#6
1.8%
#7
2.0%
#8
2.7%
#9
2.9%
#10
3.0%
What city has the Lowest Unemployment Rate Amomg Youth Under the Age of 25 in Nebraska?
South Sioux City has the Lowest Unemployment Rate Amomg Youth Under the Age of 25 in Nebraska with 0.30%.
What is the Unemployment Rate Amomg Youth Under the Age of 25 in the State of Nebraska?
Unemployment Rate Amomg Youth Under the Age of 25 in Nebraska is 6.8%.
What is the Unemployment Rate Amomg Youth Under the Age of 25 in the United States?
Unemployment Rate Amomg Youth Under the Age of 25 in the United States is 10.9%.