Cities with the Lowest Unemployment Rate Amomg Youth Under the Age of 25 in Wyoming

RELATED REPORTS & OPTIONS

Lowest Unemployment | Youth < 25
Population
Families and Households
Female Fertility
Female Fertility (Unmarried)
Race (Community Size)
Race (Percentage)
Ancestry (Community Size)
AfghanAfricanAlaska NativeAlaskan AthabascanAlbanianAleutAlsatianAmericanApacheArabArapahoArgentineanArmenianAssyrian / Chaldean / SyriacAustralianAustrianBahamianBangladeshiBarbadianBasqueBelgianBelizeanBermudanBhutaneseBlackfeetBolivianBrazilianBritishBritish West IndianBulgarianBurmeseCajunCambodianCanadianCape VerdeanCarpatho RusynCelticCentral AmericanCentral American IndianCherokeeCheyenneChickasawChileanChineseChippewaChoctawColombianColvilleComancheCosta RicanCreeCreekCroatianCrowCubanCypriotCzechCzechoslovakianDanishDelawareDominicanDutchDutch West IndianEastern EuropeanEcuadorianEgyptianEnglishEstonianEthiopianEuropeanFijianFilipinoFinnishFrenchFrench American IndianFrench CanadianGermanGerman RussianGhanaianGreekGuamanian / ChamorroGuatemalanGuyaneseHaitianHmongHonduranHopiHoumaHungarianIcelanderIndian (Asian)IndonesianInupiatIranianIraqiIrishIroquoisIsraeliItalianJamaicanJapaneseJordanianKenyanKiowaKoreanLaotianLatvianLebaneseLiberianLithuanianLumbeeLuxembourgerMacedonianMalaysianMalteseMarshalleseMenomineeMexicanMexican American IndianMongolianMoroccanNative HawaiianNavajoNepaleseNew ZealanderNicaraguanNigerianNorthern EuropeanNorwegianOkinawanOsageOttawaPaiutePakistaniPalestinianPanamanianParaguayanPennsylvania GermanPeruvianPimaPolishPortuguesePotawatomiPuebloPuerto RicanPuget Sound SalishRomanianRussianSalvadoranSamoanScandinavianScotch-IrishScottishSeminoleSenegaleseSerbianShoshoneSierra LeoneanSiouxSlavicSlovakSloveneSomaliSouth AfricanSouth AmericanSouth American IndianSoviet UnionSpaniardSpanishSpanish AmericanSpanish American IndianSri LankanSubsaharan AfricanSudaneseSwedishSwissSyrianTaiwaneseThaiTlingit-HaidaTohono O'OdhamTonganTrinidadian and TobagonianTsimshianTurkishU.S. Virgin IslanderUgandanUkrainianUruguayanUteVenezuelanVietnameseWelshWest IndianYakamaYaquiYugoslavianYumanYup'ikZimbabwean
Ancestry (Percentage)
AfghanAfricanAlaska NativeAlaskan AthabascanAlbanianAleutAlsatianAmericanApacheArabArapahoArgentineanArmenianAssyrian / Chaldean / SyriacAustralianAustrianBahamianBangladeshiBarbadianBasqueBelgianBelizeanBermudanBhutaneseBlackfeetBolivianBrazilianBritishBritish West IndianBulgarianBurmeseCajunCambodianCanadianCape VerdeanCarpatho RusynCelticCentral AmericanCentral American IndianCherokeeCheyenneChickasawChileanChineseChippewaChoctawColombianColvilleComancheCosta RicanCreeCreekCroatianCrowCubanCypriotCzechCzechoslovakianDanishDelawareDominicanDutchDutch West IndianEastern EuropeanEcuadorianEgyptianEnglishEstonianEthiopianEuropeanFijianFilipinoFinnishFrenchFrench American IndianFrench CanadianGermanGerman RussianGhanaianGreekGuamanian / ChamorroGuatemalanGuyaneseHaitianHmongHonduranHopiHoumaHungarianIcelanderIndian (Asian)IndonesianInupiatIranianIraqiIrishIroquoisIsraeliItalianJamaicanJapaneseJordanianKenyanKiowaKoreanLaotianLatvianLebaneseLiberianLithuanianLumbeeLuxembourgerMacedonianMalaysianMalteseMarshalleseMenomineeMexicanMexican American IndianMongolianMoroccanNative HawaiianNavajoNepaleseNew ZealanderNicaraguanNigerianNorthern EuropeanNorwegianOkinawanOsageOttawaPaiutePakistaniPalestinianPanamanianParaguayanPennsylvania GermanPeruvianPimaPolishPortuguesePotawatomiPuebloPuerto RicanPuget Sound SalishRomanianRussianSalvadoranSamoanScandinavianScotch-IrishScottishSeminoleSenegaleseSerbianShoshoneSierra LeoneanSiouxSlavicSlovakSloveneSomaliSouth AfricanSouth AmericanSouth American IndianSoviet UnionSpaniardSpanishSpanish AmericanSpanish American IndianSri LankanSubsaharan AfricanSudaneseSwedishSwissSyrianTaiwaneseThaiTlingit-HaidaTohono O'OdhamTonganTrinidadian and TobagonianTsimshianTurkishU.S. Virgin IslanderUgandanUkrainianUruguayanUteVenezuelanVietnameseWelshWest IndianYakamaYaquiYugoslavianYumanYup'ikZimbabwean
Immigrant Origin (Total)
AfghanistanAfricaAlbaniaArgentinaArmeniaAsiaAustraliaAustriaAzoresBahamasBangladeshBarbadosBelarusBelgiumBelizeBoliviaBosnia and HerzegovinaBrazilBulgariaBurma / MyanmarCabo VerdeCambodiaCameroonCanadaCaribbeanCentral AmericaChileChinaColombiaCongoCosta RicaCroatiaCubaCzechoslovakiaDenmarkDominicaDominican RepublicEastern AfricaEastern AsiaEastern EuropeEcuadorEgyptEl SalvadorEnglandEritreaEthiopiaEuropeFijiFranceGermanyGhanaGreeceGrenadaGuatemalaGuyanaHaitiHondurasHong KongHungaryIndiaIndonesiaIranIraqIrelandIsraelItalyJamaicaJapanJordanKazakhstanKenyaKoreaKuwaitLaosLatin AmericaLatviaLebanonLiberiaLithuaniaMalaysiaMexicoMicronesiaMiddle AfricaMoldovaMoroccoNepalNetherlandsNicaraguaNigeriaNorth MacedoniaNorthern AfricaNorthern EuropeNorwayOceaniaPakistanPanamaPeruPhilippinesPolandPortugalRomaniaRussiaSaudi ArabiaScotlandSenegalSerbiaSierra LeoneSingaporeSomaliaSouth AfricaSouth AmericaSouth Central AsiaSouth Eastern AsiaSouthern EuropeSpainSri LankaSt. Vincent and the GrenadinesSudanSwedenSwitzerlandSyriaTaiwanThailandTrinidad and TobagoTurkeyUgandaUkraineUruguayUzbekistanVenezuelaVietnamWest IndiesWestern AfricaWestern AsiaWestern EuropeYemenZaireZimbabwe
Immigrant Origin (Percentage)
AfghanistanAfricaAlbaniaArgentinaArmeniaAsiaAustraliaAustriaAzoresBahamasBangladeshBarbadosBelarusBelgiumBelizeBoliviaBosnia and HerzegovinaBrazilBulgariaBurma / MyanmarCabo VerdeCambodiaCameroonCanadaCaribbeanCentral AmericaChileChinaColombiaCongoCosta RicaCroatiaCubaCzechoslovakiaDenmarkDominicaDominican RepublicEastern AfricaEastern AsiaEastern EuropeEcuadorEgyptEl SalvadorEnglandEritreaEthiopiaEuropeFijiFranceGermanyGhanaGreeceGrenadaGuatemalaGuyanaHaitiHondurasHong KongHungaryIndiaIndonesiaIranIraqIrelandIsraelItalyJamaicaJapanJordanKazakhstanKenyaKoreaKuwaitLaosLatin AmericaLatviaLebanonLiberiaLithuaniaMalaysiaMexicoMicronesiaMiddle AfricaMoldovaMoroccoNepalNetherlandsNicaraguaNigeriaNorth MacedoniaNorthern AfricaNorthern EuropeNorwayOceaniaPakistanPanamaPeruPhilippinesPolandPortugalRomaniaRussiaSaudi ArabiaScotlandSenegalSerbiaSierra LeoneSingaporeSomaliaSouth AfricaSouth AmericaSouth Central AsiaSouth Eastern AsiaSouthern EuropeSpainSri LankaSt. Vincent and the GrenadinesSudanSwedenSwitzerlandSyriaTaiwanThailandTrinidad and TobagoTurkeyUgandaUkraineUruguayUzbekistanVenezuelaVietnamWest IndiesWestern AfricaWestern AsiaWestern EuropeYemenZaireZimbabwe
Income
Income (Families)
Income (Households)
Poverty
Poverty (Families)
Unemployment
Employment Occupations
Employment Industries
Employer Class
Commute Time
Commute Means
School Enrollment
Education by Degree Field
Occupancy
Finances
Physical Characteristics
Wyoming
Compare Cities
Comparison Subject

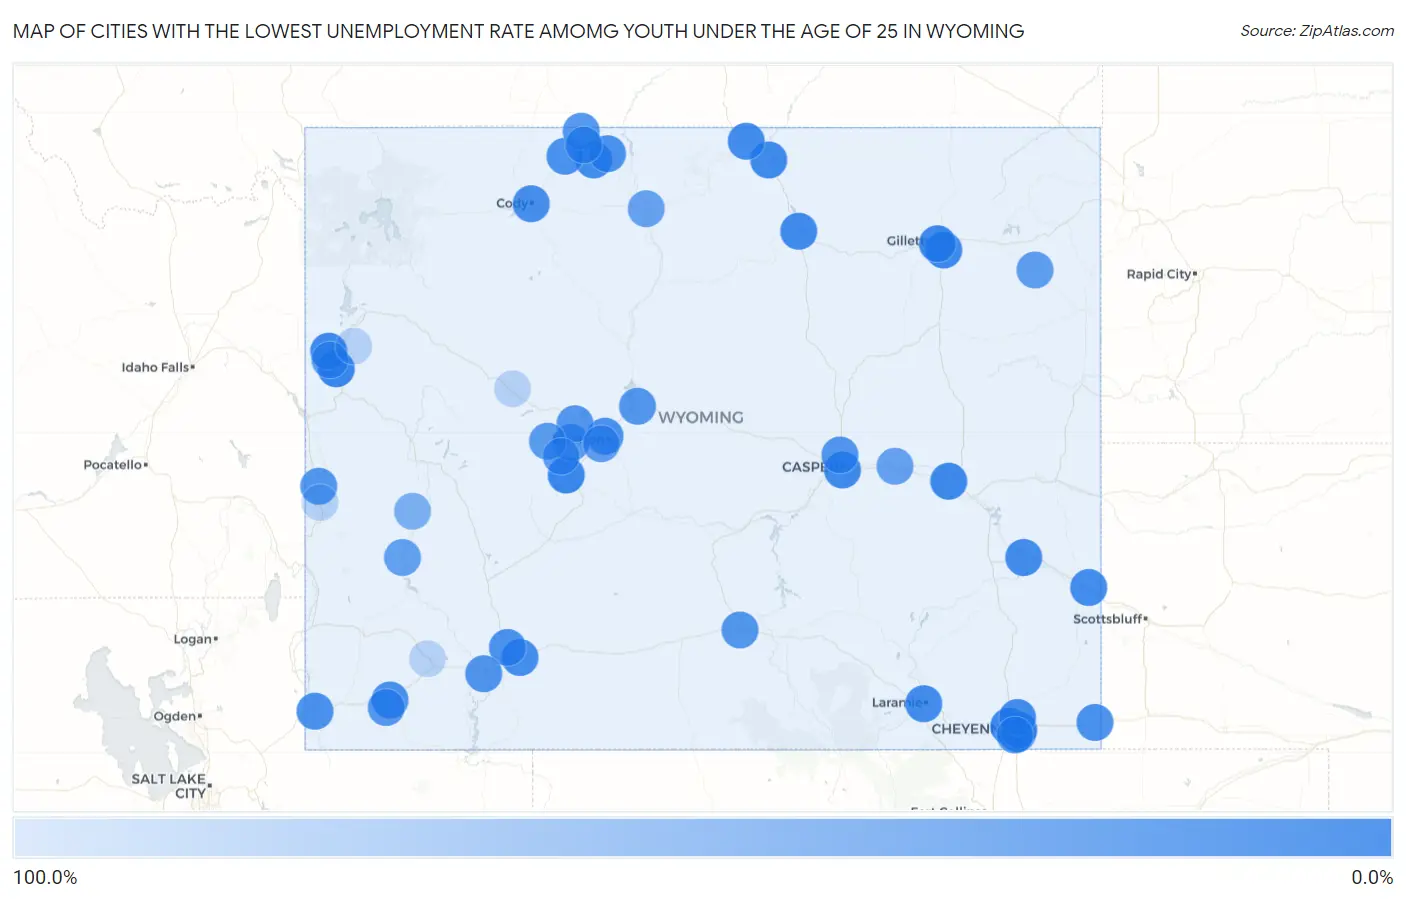
Map of Cities with the Lowest Unemployment Rate Amomg Youth Under the Age of 25 in Wyoming

100.0%
0.0%
Cities with the Lowest Unemployment Rate Amomg Youth Under the Age of 25 in Wyoming Map

Cities with the Lowest Unemployment Rate Amomg Youth Under the Age of 25 in Wyoming

City Youth Unemployment vs State vs National
1.Jackson0.20%8.8%(-8.60)#110.9%(-10.7)#5
2.Lander2.0%8.8%(-6.80)#210.9%(-8.90)#449
3.Fox Farm College3.6%8.8%(-5.20)#310.9%(-7.30)#1,447
4.Warren Afb4.5%8.8%(-4.30)#410.9%(-6.40)#2,067
5.Sleepy Hollow4.6%8.8%(-4.20)#510.9%(-6.30)#2,161
6.Teton Village4.8%8.8%(-4.00)#610.9%(-6.10)#2,319
7.Sheridan4.9%8.8%(-3.90)#710.9%(-6.00)#2,341
8.Gillette5.6%8.8%(-3.20)#810.9%(-5.30)#2,852
9.Douglas5.6%8.8%(-3.20)#910.9%(-5.30)#2,875
10.Casper6.5%8.8%(-2.30)#1010.9%(-4.40)#3,573
11.Cheyenne6.9%8.8%(-1.90)#1110.9%(-4.00)#3,896
12.Buffalo7.3%8.8%(-1.50)#1210.9%(-3.60)#4,224
13.Torrington7.9%8.8%(-0.900)#1310.9%(-3.00)#4,693
14.Laramie8.7%8.8%(-0.100)#1410.9%(-2.20)#5,313
15.Byron8.7%8.8%(-0.100)#1510.9%(-2.20)#5,371
16.La Grange8.8%8.8%(=0.000)#1610.9%(-2.10)#5,466
17.Ranchettes9.0%8.8%(+0.200)#1710.9%(-1.90)#5,562
18.Ranchester9.2%8.8%(+0.400)#1810.9%(-1.70)#5,782
19.Guernsey9.3%8.8%(+0.500)#1910.9%(-1.60)#5,866
20.Rock Springs10.9%8.8%(+2.10)#2010.9%(=0.000)#7,041
21.Cody12.5%8.8%(+3.70)#2110.9%(+1.60)#8,059
22.Riverton12.9%8.8%(+4.10)#2210.9%(+2.00)#8,303
23.North Rock Springs13.8%8.8%(+5.00)#2310.9%(+2.90)#8,880
24.Pine Bluffs13.8%8.8%(+5.00)#2410.9%(+2.90)#8,890
25.Lovell14.5%8.8%(+5.70)#2510.9%(+3.60)#9,277
26.Powell14.9%8.8%(+6.10)#2610.9%(+4.00)#9,453
27.Lyman14.9%8.8%(+6.10)#2710.9%(+4.00)#9,472
28.Evanston15.7%8.8%(+6.90)#2810.9%(+4.80)#9,822
29.Green River19.1%8.8%(+10.3)#2910.9%(+8.20)#11,170
30.Bar Nunn19.7%8.8%(+10.9)#3010.9%(+8.80)#11,366
31.Frannie20.0%8.8%(+11.2)#3110.9%(+9.10)#11,493
32.Deaver20.0%8.8%(+11.2)#3210.9%(+9.10)#11,502
33.Afton21.0%8.8%(+12.2)#3310.9%(+10.1)#11,740
34.Shoshoni21.7%8.8%(+12.9)#3410.9%(+10.8)#11,944
35.Rawlins21.9%8.8%(+13.1)#3510.9%(+11.0)#11,971
36.Ethete22.3%8.8%(+13.5)#3610.9%(+11.4)#12,104
37.Mountain View22.7%8.8%(+13.9)#3710.9%(+11.8)#12,184
38.Johnstown23.9%8.8%(+15.1)#3810.9%(+13.0)#12,484
39.Fort Washakie26.3%8.8%(+17.5)#3910.9%(+15.4)#12,943
40.South Greeley27.3%8.8%(+18.5)#4010.9%(+16.4)#13,134
41.Upton29.4%8.8%(+20.6)#4110.9%(+18.5)#13,425
42.Boulder Flats32.0%8.8%(+23.2)#4210.9%(+21.1)#13,746
43.Arapahoe32.4%8.8%(+23.6)#4310.9%(+21.5)#13,782
44.Moose Wilson Road33.8%8.8%(+25.0)#4410.9%(+22.9)#13,975
45.La Barge34.2%8.8%(+25.4)#4510.9%(+23.3)#14,014
46.Glenrock35.3%8.8%(+26.5)#4610.9%(+24.4)#14,112
47.Greybull37.5%8.8%(+28.7)#4710.9%(+26.6)#14,288
48.Marbleton53.7%8.8%(+44.9)#4810.9%(+42.8)#15,225
49.Smoot100.0%8.8%(+91.2)#4910.9%(+89.1)#15,943
50.Kelly100.0%8.8%(+91.2)#5010.9%(+89.1)#16,024
51.Granger100.0%8.8%(+91.2)#5110.9%(+89.1)#16,027
52.Crowheart100.0%8.8%(+91.2)#5210.9%(+89.1)#16,042

Common Questions

What are the Top 10 Cities with the Lowest Unemployment Rate Amomg Youth Under the Age of 25 in Wyoming?
Top 10 Cities with the Lowest Unemployment Rate Amomg Youth Under the Age of 25 in Wyoming are:
What city has the Lowest Unemployment Rate Amomg Youth Under the Age of 25 in Wyoming?
Jackson has the Lowest Unemployment Rate Amomg Youth Under the Age of 25 in Wyoming with 0.20%.
What is the Unemployment Rate Amomg Youth Under the Age of 25 in the State of Wyoming?
Unemployment Rate Amomg Youth Under the Age of 25 in Wyoming is 8.8%.
What is the Unemployment Rate Amomg Youth Under the Age of 25 in the United States?
Unemployment Rate Amomg Youth Under the Age of 25 in the United States is 10.9%.