Cities with the Lowest Poverty Level Among Single Fathers in New Mexico
RELATED REPORTS & OPTIONS
Lowest Poverty | Single Father
New Mexico
Compare Cities
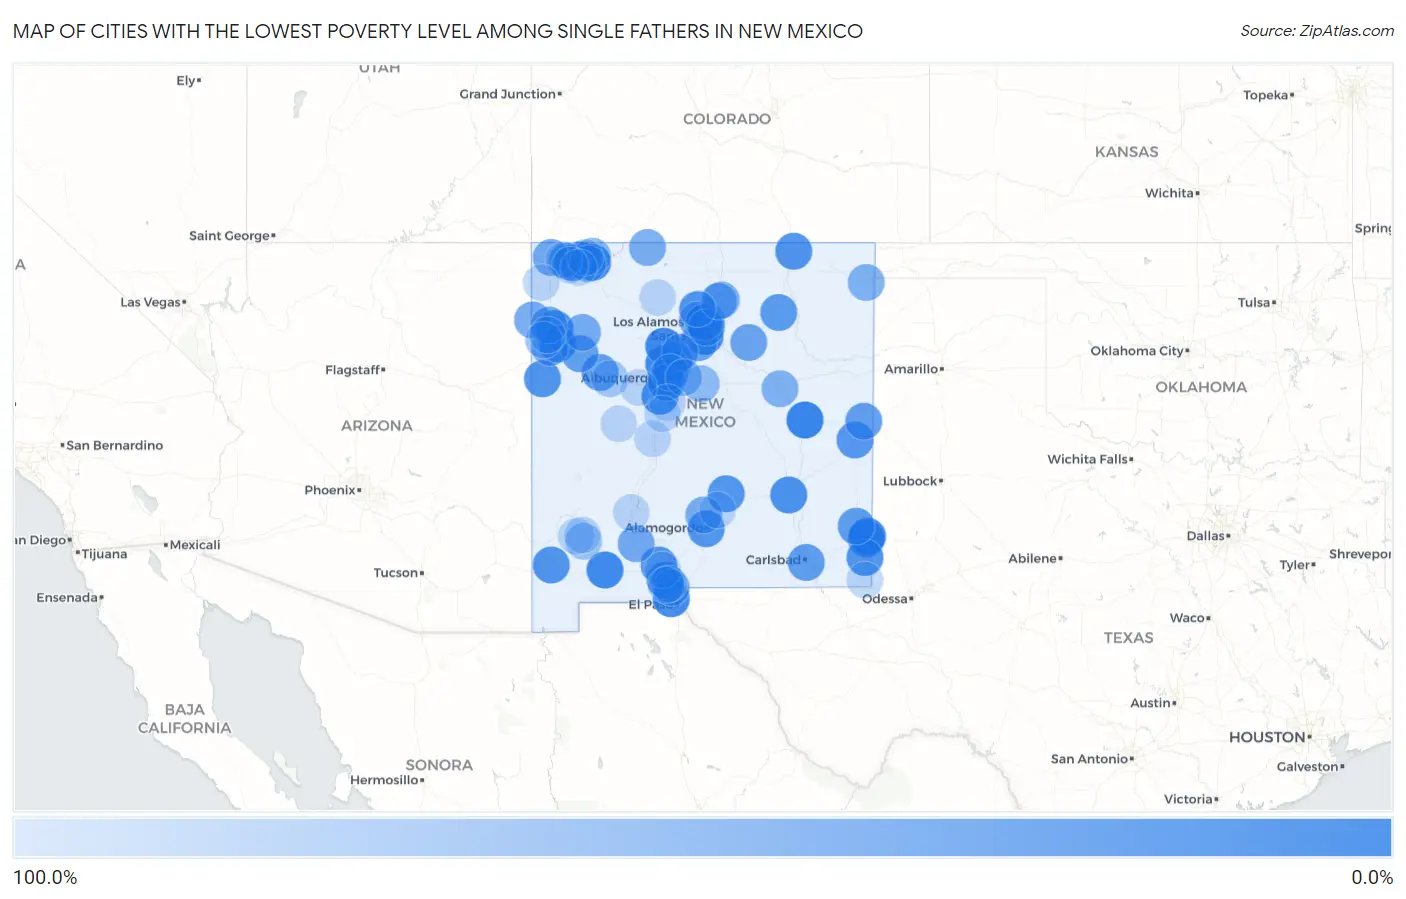
Map of Cities with the Lowest Poverty Level Among Single Fathers in New Mexico
100.0%
0.0%
Cities with the Lowest Poverty Level Among Single Fathers in New Mexico
| City | Single Father Poverty | vs State | vs National | |
| 1. | Bernalillo | 3.0% | 20.4%(-17.3)#1 | 13.7%(-10.7)#191 |
| 2. | Fort Sumner | 3.8% | 20.4%(-16.6)#2 | 13.7%(-9.91)#284 |
| 3. | Rio Rancho | 8.2% | 20.4%(-12.2)#3 | 13.7%(-5.55)#927 |
| 4. | Farmington | 8.2% | 20.4%(-12.2)#4 | 13.7%(-5.53)#928 |
| 5. | Santa Fe | 8.6% | 20.4%(-11.8)#5 | 13.7%(-5.16)#984 |
| 6. | Deming | 8.9% | 20.4%(-11.4)#6 | 13.7%(-4.77)#1,060 |
| 7. | Zia Pueblo | 9.4% | 20.4%(-11.0)#7 | 13.7%(-4.34)#1,122 |
| 8. | Bloomfield | 10.0% | 20.4%(-10.4)#8 | 13.7%(-3.71)#1,211 |
| 9. | Crouch Mesa | 10.6% | 20.4%(-9.79)#9 | 13.7%(-3.14)#1,313 |
| 10. | Sunland Park | 11.0% | 20.4%(-9.34)#10 | 13.7%(-2.68)#1,389 |
| 11. | La Mesa | 11.5% | 20.4%(-8.90)#11 | 13.7%(-2.24)#1,465 |
| 12. | Brimhall Nizhoni | 12.0% | 20.4%(-8.37)#12 | 13.7%(-1.71)#1,540 |
| 13. | Nambe | 14.3% | 20.4%(-6.08)#13 | 13.7%(+0.573)#1,909 |
| 14. | Hobbs | 14.3% | 20.4%(-6.03)#14 | 13.7%(+0.631)#1,936 |
| 15. | North Hobbs | 15.0% | 20.4%(-5.37)#15 | 13.7%(+1.29)#2,010 |
| 16. | Albuquerque | 15.6% | 20.4%(-4.77)#16 | 13.7%(+1.89)#2,093 |
| 17. | Church Rock | 17.4% | 20.4%(-2.98)#17 | 13.7%(+3.68)#2,365 |
| 18. | Los Lunas | 17.6% | 20.4%(-2.72)#18 | 13.7%(+3.93)#2,395 |
| 19. | Roswell | 18.1% | 20.4%(-2.29)#19 | 13.7%(+4.37)#2,447 |
| 20. | Pojoaque | 18.6% | 20.4%(-1.80)#20 | 13.7%(+4.86)#2,520 |
| 21. | San Jose Cdp Rio Arriba County | 19.0% | 20.4%(-1.32)#21 | 13.7%(+5.34)#2,591 |
| 22. | South Valley | 19.7% | 20.4%(-0.684)#22 | 13.7%(+5.97)#2,663 |
| 23. | Penasco | 20.0% | 20.4%(-0.370)#23 | 13.7%(+6.29)#2,741 |
| 24. | Raton | 20.1% | 20.4%(-0.232)#24 | 13.7%(+6.43)#2,770 |
| 25. | Lordsburg | 21.2% | 20.4%(+0.842)#25 | 13.7%(+7.50)#2,883 |
| 26. | Zuni Pueblo | 21.4% | 20.4%(+1.06)#26 | 13.7%(+7.72)#2,903 |
| 27. | Eunice | 21.5% | 20.4%(+1.12)#27 | 13.7%(+7.78)#2,923 |
| 28. | Alamogordo | 22.2% | 20.4%(+1.79)#28 | 13.7%(+8.45)#2,995 |
| 29. | Ruidoso | 24.1% | 20.4%(+3.75)#29 | 13.7%(+10.4)#3,207 |
| 30. | Las Cruces | 25.3% | 20.4%(+4.88)#30 | 13.7%(+11.5)#3,341 |
| 31. | Portales | 25.9% | 20.4%(+5.49)#31 | 13.7%(+12.1)#3,388 |
| 32. | Wagon Mound | 28.6% | 20.4%(+8.20)#32 | 13.7%(+14.9)#3,640 |
| 33. | Nenahnezad | 29.0% | 20.4%(+8.66)#33 | 13.7%(+15.3)#3,673 |
| 34. | Lovington | 31.4% | 20.4%(+11.1)#34 | 13.7%(+17.7)#3,886 |
| 35. | Carlsbad | 31.8% | 20.4%(+11.5)#35 | 13.7%(+18.1)#3,920 |
| 36. | Hernandez | 33.3% | 20.4%(+13.0)#36 | 13.7%(+19.6)#4,042 |
| 37. | Clovis | 33.7% | 20.4%(+13.4)#37 | 13.7%(+20.0)#4,140 |
| 38. | Grants | 34.4% | 20.4%(+14.1)#38 | 13.7%(+20.7)#4,182 |
| 39. | Thoreau | 35.7% | 20.4%(+15.3)#39 | 13.7%(+22.0)#4,273 |
| 40. | Espanola | 39.1% | 20.4%(+18.7)#40 | 13.7%(+25.4)#4,504 |
| 41. | La Cienega | 39.3% | 20.4%(+18.9)#41 | 13.7%(+25.6)#4,515 |
| 42. | Upper Fruitland | 40.0% | 20.4%(+19.6)#42 | 13.7%(+26.3)#4,566 |
| 43. | Las Vegas | 40.5% | 20.4%(+20.1)#43 | 13.7%(+26.8)#4,624 |
| 44. | Anthony | 43.6% | 20.4%(+23.2)#44 | 13.7%(+29.9)#4,796 |
| 45. | Gallup | 44.3% | 20.4%(+24.0)#45 | 13.7%(+30.6)#4,827 |
| 46. | Shiprock | 46.7% | 20.4%(+26.3)#46 | 13.7%(+33.0)#4,936 |
| 47. | Navajo | 46.9% | 20.4%(+26.5)#47 | 13.7%(+33.2)#4,945 |
| 48. | Hatch | 47.1% | 20.4%(+26.7)#48 | 13.7%(+33.3)#4,954 |
| 49. | Angustura | 48.6% | 20.4%(+28.3)#49 | 13.7%(+34.9)#5,013 |
| 50. | Crownpoint | 50.0% | 20.4%(+29.6)#50 | 13.7%(+36.3)#5,065 |
| 51. | San Felipe Pueblo | 50.0% | 20.4%(+29.6)#51 | 13.7%(+36.3)#5,086 |
| 52. | San Ildefonso Pueblo | 50.0% | 20.4%(+29.6)#52 | 13.7%(+36.3)#5,130 |
| 53. | Tohatchi | 50.0% | 20.4%(+29.6)#53 | 13.7%(+36.3)#5,135 |
| 54. | Rio Lucio | 50.0% | 20.4%(+29.6)#54 | 13.7%(+36.3)#5,139 |
| 55. | Cuyamungue | 50.0% | 20.4%(+29.6)#55 | 13.7%(+36.3)#5,152 |
| 56. | Tesuque Pueblo | 50.0% | 20.4%(+29.6)#56 | 13.7%(+36.3)#5,163 |
| 57. | Tularosa | 51.1% | 20.4%(+30.7)#57 | 13.7%(+37.4)#5,246 |
| 58. | Dulce | 51.6% | 20.4%(+31.2)#58 | 13.7%(+37.9)#5,263 |
| 59. | Tano Road | 52.4% | 20.4%(+32.0)#59 | 13.7%(+38.7)#5,295 |
| 60. | North Valley | 54.5% | 20.4%(+34.1)#60 | 13.7%(+40.8)#5,379 |
| 61. | Pena Blanca | 56.2% | 20.4%(+35.9)#61 | 13.7%(+42.5)#5,460 |
| 62. | Clayton | 56.5% | 20.4%(+36.2)#62 | 13.7%(+42.8)#5,466 |
| 63. | Santa Rosa | 58.3% | 20.4%(+38.0)#63 | 13.7%(+44.6)#5,541 |
| 64. | Chamisal | 60.0% | 20.4%(+39.6)#64 | 13.7%(+46.3)#5,631 |
| 65. | Aztec | 60.7% | 20.4%(+40.3)#65 | 13.7%(+47.0)#5,650 |
| 66. | Sundance | 62.5% | 20.4%(+42.1)#66 | 13.7%(+48.8)#5,717 |
| 67. | Moriarty | 68.4% | 20.4%(+48.1)#67 | 13.7%(+54.7)#5,912 |
| 68. | Tijeras | 70.0% | 20.4%(+49.6)#68 | 13.7%(+56.3)#5,949 |
| 69. | Lee Acres | 71.4% | 20.4%(+51.1)#69 | 13.7%(+57.7)#5,976 |
| 70. | Pinedale | 72.7% | 20.4%(+52.4)#70 | 13.7%(+59.0)#6,027 |
| 71. | Rock Springs | 75.0% | 20.4%(+54.6)#71 | 13.7%(+61.3)#6,078 |
| 72. | Iyanbito | 76.0% | 20.4%(+55.6)#72 | 13.7%(+62.3)#6,115 |
| 73. | Hurley | 78.8% | 20.4%(+58.4)#73 | 13.7%(+65.1)#6,152 |
| 74. | Mccartys Village | 83.3% | 20.4%(+63.0)#74 | 13.7%(+69.6)#6,241 |
| 75. | Silver City | 100.0% | 20.4%(+79.6)#75 | 13.7%(+86.3)#6,372 |
| 76. | University Park | 100.0% | 20.4%(+79.6)#76 | 13.7%(+86.3)#6,546 |
| 77. | Flora Vista | 100.0% | 20.4%(+79.6)#77 | 13.7%(+86.3)#6,586 |
| 78. | Jal | 100.0% | 20.4%(+79.6)#78 | 13.7%(+86.3)#6,596 |
| 79. | Picacho Hills | 100.0% | 20.4%(+79.6)#79 | 13.7%(+86.3)#6,644 |
| 80. | Las Maravillas | 100.0% | 20.4%(+79.6)#80 | 13.7%(+86.3)#6,648 |
| 81. | Santa Clara | 100.0% | 20.4%(+79.6)#81 | 13.7%(+86.3)#6,658 |
| 82. | Waterflow | 100.0% | 20.4%(+79.6)#82 | 13.7%(+86.3)#6,735 |
| 83. | Berino | 100.0% | 20.4%(+79.6)#83 | 13.7%(+86.3)#6,759 |
| 84. | El Duende | 100.0% | 20.4%(+79.6)#84 | 13.7%(+86.3)#6,796 |
| 85. | Alamo | 100.0% | 20.4%(+79.6)#85 | 13.7%(+86.3)#6,807 |
| 86. | Twin Lakes | 100.0% | 20.4%(+79.6)#86 | 13.7%(+86.3)#6,855 |
| 87. | Mescalero | 100.0% | 20.4%(+79.6)#87 | 13.7%(+86.3)#6,879 |
| 88. | Williamsburg | 100.0% | 20.4%(+79.6)#88 | 13.7%(+86.3)#6,911 |
| 89. | Chamberino | 100.0% | 20.4%(+79.6)#89 | 13.7%(+86.3)#6,957 |
| 90. | Prewitt | 100.0% | 20.4%(+79.6)#90 | 13.7%(+86.3)#6,975 |
| 91. | Napi Headquarters | 100.0% | 20.4%(+79.6)#91 | 13.7%(+86.3)#7,003 |
| 92. | Polvadera | 100.0% | 20.4%(+79.6)#92 | 13.7%(+86.3)#7,039 |
| 93. | Placitas Cdp Dona Ana County | 100.0% | 20.4%(+79.6)#93 | 13.7%(+86.3)#7,070 |
| 94. | Torreon Cdp Sandoval County | 100.0% | 20.4%(+79.6)#94 | 13.7%(+86.3)#7,089 |
| 95. | Totah Vista | 100.0% | 20.4%(+79.6)#95 | 13.7%(+86.3)#7,111 |
| 96. | Ojo Amarillo | 100.0% | 20.4%(+79.6)#96 | 13.7%(+86.3)#7,140 |
| 97. | Highland Meadows | 100.0% | 20.4%(+79.6)#97 | 13.7%(+86.3)#7,142 |
| 98. | Sanostee | 100.0% | 20.4%(+79.6)#98 | 13.7%(+86.3)#7,264 |
| 99. | Gallina | 100.0% | 20.4%(+79.6)#99 | 13.7%(+86.3)#7,273 |
| 100. | Casa Colorada | 100.0% | 20.4%(+79.6)#100 | 13.7%(+86.3)#7,288 |
Common Questions
What are the Top 10 Cities with the Lowest Poverty Level Among Single Fathers in New Mexico?
Top 10 Cities with the Lowest Poverty Level Among Single Fathers in New Mexico are:
#1
3.0%
#2
3.8%
#3
8.2%
#4
8.2%
#5
8.6%
#6
8.9%
#7
9.4%
#8
10.0%
#9
11.0%
#10
11.5%
What city has the Lowest Poverty Level Among Single Fathers in New Mexico?
Bernalillo has the Lowest Poverty Level Among Single Fathers in New Mexico with 3.0%.
What is the Poverty Level Among Single Fathers in the State of New Mexico?
Poverty Level Among Single Fathers in New Mexico is 20.4%.
What is the Poverty Level Among Single Fathers in the United States?
Poverty Level Among Single Fathers in the United States is 13.7%.