Cities with the Lowest Poverty Level Among Single Fathers in Pennsylvania
RELATED REPORTS & OPTIONS
Lowest Poverty | Single Father
Pennsylvania
Compare Cities
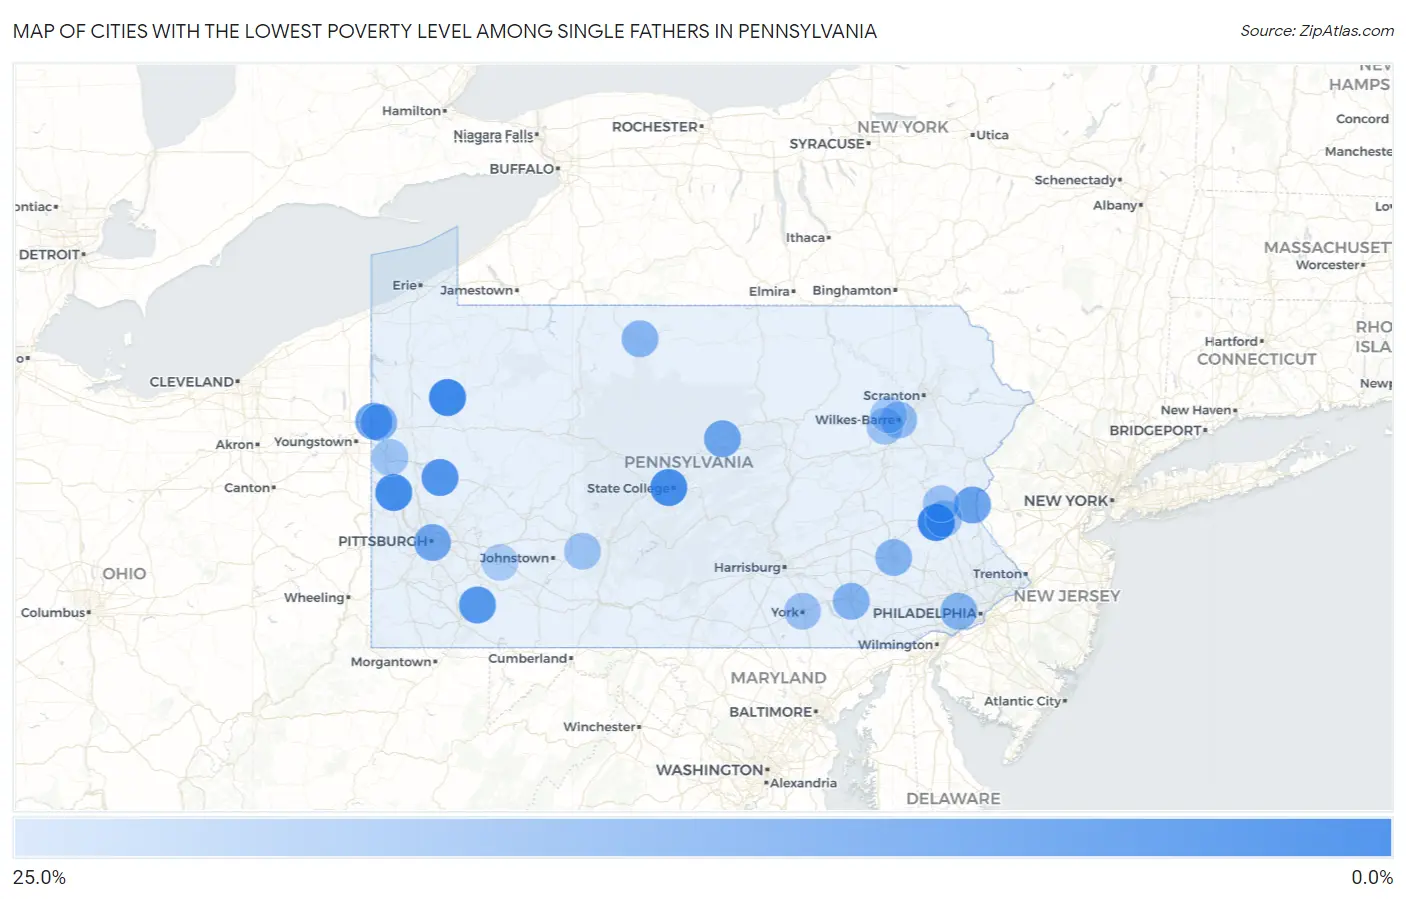
Map of Cities with the Lowest Poverty Level Among Single Fathers in Pennsylvania
25.0%
0.0%
Cities with the Lowest Poverty Level Among Single Fathers in Pennsylvania
| City | Single Father Poverty | vs State | vs National | |
| 1. | Wescosville | 1.7% | 14.3%(-12.6)#1 | 13.7%(-12.0)#57 |
| 2. | West Mifflin Borough | 1.8% | 14.3%(-12.5)#2 | 13.7%(-11.9)#70 |
| 3. | Bristol Borough | 2.2% | 14.3%(-12.2)#3 | 13.7%(-11.6)#99 |
| 4. | Plum Borough | 2.2% | 14.3%(-12.1)#4 | 13.7%(-11.5)#106 |
| 5. | Franklin | 2.5% | 14.3%(-11.8)#5 | 13.7%(-11.2)#131 |
| 6. | Sayre Borough | 3.3% | 14.3%(-11.0)#6 | 13.7%(-10.4)#233 |
| 7. | Norristown Borough | 3.5% | 14.3%(-10.9)#7 | 13.7%(-10.2)#240 |
| 8. | Beaver Falls | 3.7% | 14.3%(-10.7)#8 | 13.7%(-10.1)#261 |
| 9. | Park Forest Village | 4.0% | 14.3%(-10.3)#9 | 13.7%(-9.71)#301 |
| 10. | Hanover Borough | 4.0% | 14.3%(-10.3)#10 | 13.7%(-9.66)#306 |
| 11. | Parkesburg Borough | 4.4% | 14.3%(-9.92)#11 | 13.7%(-9.29)#362 |
| 12. | Homeacre Lyndora | 5.6% | 14.3%(-8.78)#12 | 13.7%(-8.16)#511 |
| 13. | Palmyra Borough | 5.9% | 14.3%(-8.45)#13 | 13.7%(-7.83)#559 |
| 14. | Baldwin Borough | 6.0% | 14.3%(-8.33)#14 | 13.7%(-7.71)#576 |
| 15. | Connellsville | 6.4% | 14.3%(-7.97)#15 | 13.7%(-7.34)#626 |
| 16. | Camp Hill Borough | 6.5% | 14.3%(-7.89)#16 | 13.7%(-7.26)#637 |
| 17. | Mount Union Borough | 6.8% | 14.3%(-7.56)#17 | 13.7%(-6.93)#687 |
| 18. | Brookhaven Borough | 6.9% | 14.3%(-7.39)#18 | 13.7%(-6.76)#709 |
| 19. | Muncy Borough | 7.1% | 14.3%(-7.19)#19 | 13.7%(-6.57)#738 |
| 20. | Coaldale Borough Schuylkill County | 7.1% | 14.3%(-7.19)#20 | 13.7%(-6.57)#740 |
| 21. | Marcus Hook Borough | 7.1% | 14.3%(-7.19)#21 | 13.7%(-6.57)#741 |
| 22. | Dale Borough | 7.4% | 14.3%(-6.93)#22 | 13.7%(-6.30)#790 |
| 23. | New Brighton Borough | 7.4% | 14.3%(-6.91)#23 | 13.7%(-6.28)#794 |
| 24. | New Eagle Borough | 7.6% | 14.3%(-6.76)#24 | 13.7%(-6.14)#812 |
| 25. | Brookville Borough | 7.7% | 14.3%(-6.64)#25 | 13.7%(-6.02)#838 |
| 26. | Sewickley Borough | 7.7% | 14.3%(-6.64)#26 | 13.7%(-6.02)#839 |
| 27. | Lanesboro Borough | 7.8% | 14.3%(-6.49)#27 | 13.7%(-5.87)#882 |
| 28. | Milton Borough | 8.1% | 14.3%(-6.25)#28 | 13.7%(-5.63)#921 |
| 29. | Pottstown Borough | 8.2% | 14.3%(-6.15)#29 | 13.7%(-5.53)#929 |
| 30. | Kingston Borough | 8.3% | 14.3%(-6.00)#30 | 13.7%(-5.38)#947 |
| 31. | Sharon | 8.6% | 14.3%(-5.72)#31 | 13.7%(-5.09)#1,005 |
| 32. | Jonestown Borough | 8.6% | 14.3%(-5.72)#32 | 13.7%(-5.09)#1,006 |
| 33. | Easton | 9.0% | 14.3%(-5.38)#33 | 13.7%(-4.75)#1,063 |
| 34. | Ferndale Borough | 9.7% | 14.3%(-4.66)#34 | 13.7%(-4.03)#1,167 |
| 35. | Pennsburg Borough | 9.9% | 14.3%(-4.43)#35 | 13.7%(-3.80)#1,201 |
| 36. | Castanea | 10.0% | 14.3%(-4.34)#36 | 13.7%(-3.71)#1,224 |
| 37. | Saxton Borough | 10.0% | 14.3%(-4.34)#37 | 13.7%(-3.71)#1,227 |
| 38. | Jermyn Borough | 10.2% | 14.3%(-4.11)#38 | 13.7%(-3.49)#1,264 |
| 39. | Pittsburgh | 10.4% | 14.3%(-3.95)#39 | 13.7%(-3.33)#1,282 |
| 40. | Quakertown Borough | 10.5% | 14.3%(-3.81)#40 | 13.7%(-3.19)#1,297 |
| 41. | Fleetwood Borough | 10.5% | 14.3%(-3.81)#41 | 13.7%(-3.19)#1,300 |
| 42. | Burnham Borough | 10.9% | 14.3%(-3.43)#42 | 13.7%(-2.80)#1,370 |
| 43. | Vandergrift Borough | 11.1% | 14.3%(-3.23)#43 | 13.7%(-2.60)#1,406 |
| 44. | Avoca Borough | 11.1% | 14.3%(-3.23)#44 | 13.7%(-2.60)#1,408 |
| 45. | Atglen Borough | 11.1% | 14.3%(-3.23)#45 | 13.7%(-2.60)#1,419 |
| 46. | Platea Borough | 11.1% | 14.3%(-3.23)#46 | 13.7%(-2.60)#1,425 |
| 47. | Berwick Borough | 11.5% | 14.3%(-2.86)#47 | 13.7%(-2.24)#1,459 |
| 48. | Lykens Borough | 11.8% | 14.3%(-2.57)#48 | 13.7%(-1.95)#1,496 |
| 49. | Avonmore Borough | 11.8% | 14.3%(-2.57)#49 | 13.7%(-1.95)#1,500 |
| 50. | Laureldale Borough | 11.8% | 14.3%(-2.51)#50 | 13.7%(-1.88)#1,510 |
| 51. | Grove City Borough | 11.9% | 14.3%(-2.47)#51 | 13.7%(-1.85)#1,516 |
| 52. | Sugarcreek Borough | 11.9% | 14.3%(-2.43)#52 | 13.7%(-1.81)#1,519 |
| 53. | Homer City Borough | 12.0% | 14.3%(-2.34)#53 | 13.7%(-1.71)#1,538 |
| 54. | Middletown Borough | 12.3% | 14.3%(-2.07)#54 | 13.7%(-1.45)#1,581 |
| 55. | Hermitage | 12.4% | 14.3%(-1.92)#55 | 13.7%(-1.29)#1,604 |
| 56. | Catawissa Borough | 12.5% | 14.3%(-1.84)#56 | 13.7%(-1.21)#1,625 |
| 57. | Pen Argyl Borough | 12.9% | 14.3%(-1.40)#57 | 13.7%(-0.771)#1,689 |
| 58. | Applewold Borough | 13.0% | 14.3%(-1.29)#58 | 13.7%(-0.669)#1,713 |
| 59. | Lancaster | 13.1% | 14.3%(-1.22)#59 | 13.7%(-0.598)#1,718 |
| 60. | Mount Pleasant Borough | 13.2% | 14.3%(-1.13)#60 | 13.7%(-0.505)#1,735 |
| 61. | Hulmeville Borough | 13.3% | 14.3%(-1.00)#61 | 13.7%(-0.379)#1,759 |
| 62. | Broomall | 13.4% | 14.3%(-0.904)#62 | 13.7%(-0.280)#1,773 |
| 63. | Williamstown Borough | 13.5% | 14.3%(-0.824)#63 | 13.7%(-0.199)#1,780 |
| 64. | Reading | 13.6% | 14.3%(-0.771)#64 | 13.7%(-0.146)#1,787 |
| 65. | Newville Borough | 13.6% | 14.3%(-0.701)#65 | 13.7%(-0.076)#1,806 |
| 66. | Roulette | 13.6% | 14.3%(-0.701)#66 | 13.7%(-0.076)#1,809 |
| 67. | Glassport Borough | 14.1% | 14.3%(-0.243)#67 | 13.7%(+0.382)#1,874 |
| 68. | Big Run Borough | 14.3% | 14.3%(-0.051)#68 | 13.7%(+0.573)#1,922 |
| 69. | Lorain Borough | 14.3% | 14.3%(-0.051)#69 | 13.7%(+0.573)#1,923 |
| 70. | Whitehall Borough | 14.7% | 14.3%(+0.342)#70 | 13.7%(+0.967)#1,980 |
| 71. | Northumberland Borough | 14.9% | 14.3%(+0.557)#71 | 13.7%(+1.18)#1,998 |
| 72. | Wilkes Barre | 15.4% | 14.3%(+1.02)#72 | 13.7%(+1.64)#2,057 |
| 73. | Curwensville Borough | 15.6% | 14.3%(+1.22)#73 | 13.7%(+1.84)#2,088 |
| 74. | Pitcairn Borough | 15.7% | 14.3%(+1.39)#74 | 13.7%(+2.02)#2,114 |
| 75. | Marysville Borough | 15.8% | 14.3%(+1.45)#75 | 13.7%(+2.08)#2,125 |
| 76. | York | 16.3% | 14.3%(+1.99)#76 | 13.7%(+2.61)#2,193 |
| 77. | Allentown | 16.5% | 14.3%(+2.15)#77 | 13.7%(+2.77)#2,212 |
| 78. | Rochester Borough | 16.7% | 14.3%(+2.33)#78 | 13.7%(+2.95)#2,243 |
| 79. | Cementon | 16.7% | 14.3%(+2.33)#79 | 13.7%(+2.95)#2,257 |
| 80. | Liverpool Borough | 16.7% | 14.3%(+2.33)#80 | 13.7%(+2.95)#2,267 |
| 81. | New Castle | 16.9% | 14.3%(+2.57)#81 | 13.7%(+3.19)#2,314 |
| 82. | Spring Hill | 16.9% | 14.3%(+2.61)#82 | 13.7%(+3.24)#2,319 |
| 83. | Nanticoke | 17.3% | 14.3%(+2.97)#83 | 13.7%(+3.60)#2,355 |
| 84. | Waymart Borough | 17.6% | 14.3%(+3.31)#84 | 13.7%(+3.93)#2,400 |
| 85. | Wernersville Borough | 17.9% | 14.3%(+3.52)#85 | 13.7%(+4.14)#2,424 |
| 86. | Archbald Borough | 18.0% | 14.3%(+3.64)#86 | 13.7%(+4.27)#2,435 |
| 87. | Ridley Park Borough | 18.0% | 14.3%(+3.64)#87 | 13.7%(+4.27)#2,436 |
| 88. | Chase | 18.2% | 14.3%(+3.84)#88 | 13.7%(+4.47)#2,473 |
| 89. | Red Lion Borough | 18.6% | 14.3%(+4.22)#89 | 13.7%(+4.84)#2,519 |
| 90. | Shickshinny Borough | 18.8% | 14.3%(+4.41)#90 | 13.7%(+5.04)#2,556 |
| 91. | Clearfield Borough | 19.0% | 14.3%(+4.64)#91 | 13.7%(+5.27)#2,576 |
| 92. | Houston Borough | 19.0% | 14.3%(+4.71)#92 | 13.7%(+5.34)#2,590 |
| 93. | Lawson Heights | 19.2% | 14.3%(+4.89)#93 | 13.7%(+5.52)#2,611 |
| 94. | Wheatland Borough | 19.2% | 14.3%(+4.89)#94 | 13.7%(+5.52)#2,614 |
| 95. | Leesport Borough | 20.0% | 14.3%(+5.66)#95 | 13.7%(+6.29)#2,709 |
| 96. | Cleona Borough | 20.0% | 14.3%(+5.66)#96 | 13.7%(+6.29)#2,715 |
| 97. | Waterford Borough | 20.0% | 14.3%(+5.66)#97 | 13.7%(+6.29)#2,720 |
| 98. | Knoxville Borough | 20.0% | 14.3%(+5.66)#98 | 13.7%(+6.29)#2,732 |
| 99. | Paxtang Borough | 20.6% | 14.3%(+6.25)#99 | 13.7%(+6.88)#2,810 |
| 100. | East Vandergrift Borough | 20.7% | 14.3%(+6.35)#100 | 13.7%(+6.98)#2,821 |
Common Questions
What are the Top 10 Cities with the Lowest Poverty Level Among Single Fathers in Pennsylvania?
Top 10 Cities with the Lowest Poverty Level Among Single Fathers in Pennsylvania are:
#1
1.7%
#2
2.5%
#3
3.7%
#4
4.0%
#5
5.6%
#6
6.4%
#7
8.6%
#8
9.0%
#9
10.0%
#10
10.4%
What city has the Lowest Poverty Level Among Single Fathers in Pennsylvania?
Wescosville has the Lowest Poverty Level Among Single Fathers in Pennsylvania with 1.7%.
What is the Poverty Level Among Single Fathers in the State of Pennsylvania?
Poverty Level Among Single Fathers in Pennsylvania is 14.3%.
What is the Poverty Level Among Single Fathers in the United States?
Poverty Level Among Single Fathers in the United States is 13.7%.