Cities with the Lowest Poverty Level Among Single Fathers in Maryland
RELATED REPORTS & OPTIONS
Lowest Poverty | Single Father
Maryland
Compare Cities
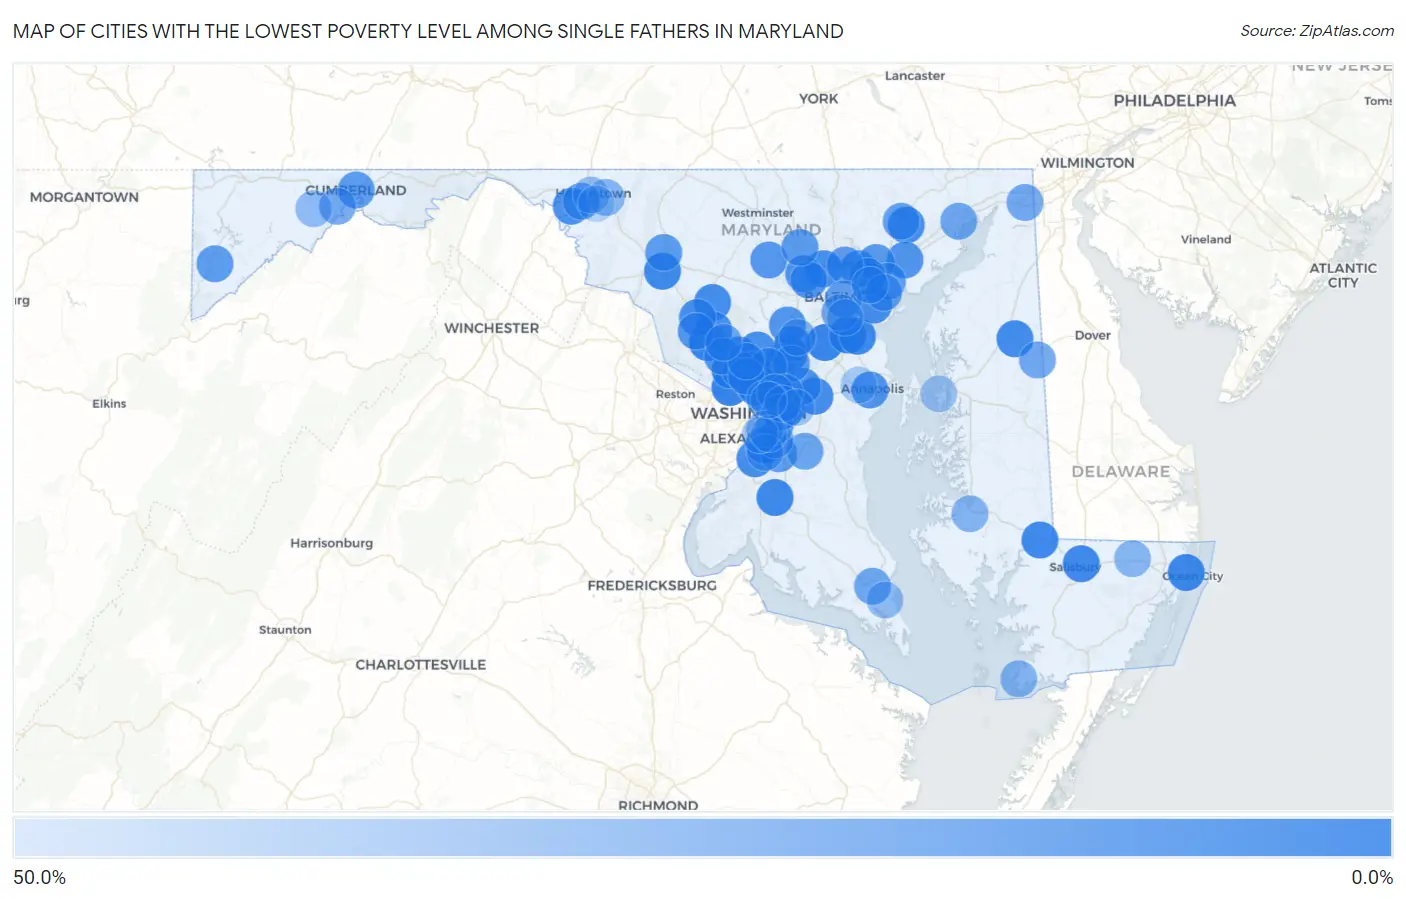
Map of Cities with the Lowest Poverty Level Among Single Fathers in Maryland
50.0%
0.0%
Cities with the Lowest Poverty Level Among Single Fathers in Maryland
| City | Single Father Poverty | vs State | vs National | |
| 1. | Gaithersburg | 1.2% | 9.8%(-8.62)#1 | 13.7%(-12.5)#23 |
| 2. | Severn | 1.4% | 9.8%(-8.35)#2 | 13.7%(-12.3)#41 |
| 3. | Bethesda | 1.5% | 9.8%(-8.28)#3 | 13.7%(-12.2)#46 |
| 4. | East Riverdale | 1.9% | 9.8%(-7.89)#4 | 13.7%(-11.8)#75 |
| 5. | Glen Burnie | 2.3% | 9.8%(-7.51)#5 | 13.7%(-11.4)#108 |
| 6. | North Bethesda | 2.3% | 9.8%(-7.51)#6 | 13.7%(-11.4)#109 |
| 7. | Waldorf | 3.2% | 9.8%(-6.53)#7 | 13.7%(-10.5)#219 |
| 8. | Silver Spring | 3.4% | 9.8%(-6.40)#8 | 13.7%(-10.3)#234 |
| 9. | West Ocean City | 3.6% | 9.8%(-6.18)#9 | 13.7%(-10.1)#255 |
| 10. | Ballenger Creek | 3.7% | 9.8%(-6.11)#10 | 13.7%(-10.0)#264 |
| 11. | Mardela Springs | 4.3% | 9.8%(-5.43)#11 | 13.7%(-9.36)#352 |
| 12. | Pasadena | 4.7% | 9.8%(-5.09)#12 | 13.7%(-9.02)#399 |
| 13. | Salisbury | 4.7% | 9.8%(-5.04)#13 | 13.7%(-8.98)#404 |
| 14. | Aspen Hill | 5.1% | 9.8%(-4.65)#14 | 13.7%(-8.58)#456 |
| 15. | Wheaton | 5.2% | 9.8%(-4.59)#15 | 13.7%(-8.53)#465 |
| 16. | Barclay | 5.6% | 9.8%(-4.22)#16 | 13.7%(-8.16)#520 |
| 17. | Bel Air | 5.9% | 9.8%(-3.90)#17 | 13.7%(-7.83)#558 |
| 18. | Beltsville | 6.0% | 9.8%(-3.79)#18 | 13.7%(-7.72)#573 |
| 19. | Pikesville | 6.2% | 9.8%(-3.53)#19 | 13.7%(-7.46)#607 |
| 20. | Damascus | 6.3% | 9.8%(-3.47)#20 | 13.7%(-7.41)#617 |
| 21. | Fort Washington | 6.4% | 9.8%(-3.43)#21 | 13.7%(-7.36)#623 |
| 22. | Dundalk | 6.9% | 9.8%(-2.89)#22 | 13.7%(-6.82)#700 |
| 23. | Laurel | 7.1% | 9.8%(-2.68)#23 | 13.7%(-6.62)#729 |
| 24. | Bowie | 7.1% | 9.8%(-2.64)#24 | 13.7%(-6.57)#735 |
| 25. | Montgomery Village | 7.3% | 9.8%(-2.47)#25 | 13.7%(-6.40)#771 |
| 26. | Clarksburg | 7.4% | 9.8%(-2.34)#26 | 13.7%(-6.27)#796 |
| 27. | Cloverly | 7.6% | 9.8%(-2.18)#27 | 13.7%(-6.12)#817 |
| 28. | Kemp Mill | 7.7% | 9.8%(-2.09)#28 | 13.7%(-6.02)#835 |
| 29. | Glenn Dale | 8.3% | 9.8%(-1.45)#29 | 13.7%(-5.38)#946 |
| 30. | Williamsport | 8.6% | 9.8%(-1.21)#30 | 13.7%(-5.14)#993 |
| 31. | Oxon Hill | 9.0% | 9.8%(-0.824)#31 | 13.7%(-4.76)#1,061 |
| 32. | Randallstown | 9.0% | 9.8%(-0.805)#32 | 13.7%(-4.74)#1,066 |
| 33. | Annapolis | 9.7% | 9.8%(-0.036)#33 | 13.7%(-3.97)#1,178 |
| 34. | Chillum | 9.8% | 9.8%(+0.059)#34 | 13.7%(-3.87)#1,194 |
| 35. | Joppatowne | 10.6% | 9.8%(+0.773)#35 | 13.7%(-3.16)#1,312 |
| 36. | Parkville | 10.7% | 9.8%(+0.899)#36 | 13.7%(-3.03)#1,334 |
| 37. | North Kensington | 11.3% | 9.8%(+1.51)#37 | 13.7%(-2.42)#1,440 |
| 38. | Columbia | 11.8% | 9.8%(+1.99)#38 | 13.7%(-1.94)#1,504 |
| 39. | Milford Mill | 11.9% | 9.8%(+2.14)#39 | 13.7%(-1.80)#1,523 |
| 40. | Langley Park | 12.4% | 9.8%(+2.59)#40 | 13.7%(-1.35)#1,594 |
| 41. | North Laurel | 12.5% | 9.8%(+2.72)#41 | 13.7%(-1.21)#1,609 |
| 42. | Rockville | 12.6% | 9.8%(+2.81)#42 | 13.7%(-1.12)#1,648 |
| 43. | Peppermill Village | 12.8% | 9.8%(+3.01)#43 | 13.7%(-0.922)#1,671 |
| 44. | Eldersburg | 13.0% | 9.8%(+3.26)#44 | 13.7%(-0.669)#1,705 |
| 45. | Germantown | 13.4% | 9.8%(+3.61)#45 | 13.7%(-0.327)#1,770 |
| 46. | Takoma Park | 13.8% | 9.8%(+4.06)#46 | 13.7%(+0.127)#1,841 |
| 47. | Perry Hall | 14.5% | 9.8%(+4.77)#47 | 13.7%(+0.833)#1,960 |
| 48. | Cumberland | 14.6% | 9.8%(+4.85)#48 | 13.7%(+0.912)#1,969 |
| 49. | Middle River | 14.7% | 9.8%(+4.91)#49 | 13.7%(+0.980)#1,981 |
| 50. | Mountain Lake Park | 15.0% | 9.8%(+5.22)#50 | 13.7%(+1.29)#2,013 |
| 51. | Overlea | 15.1% | 9.8%(+5.35)#51 | 13.7%(+1.41)#2,030 |
| 52. | Frederick | 15.3% | 9.8%(+5.56)#52 | 13.7%(+1.62)#2,056 |
| 53. | Reisterstown | 15.4% | 9.8%(+5.61)#53 | 13.7%(+1.67)#2,061 |
| 54. | South Laurel | 15.7% | 9.8%(+5.93)#54 | 13.7%(+1.99)#2,110 |
| 55. | Clinton | 16.0% | 9.8%(+6.20)#55 | 13.7%(+2.27)#2,152 |
| 56. | Calverton | 16.0% | 9.8%(+6.25)#56 | 13.7%(+2.31)#2,156 |
| 57. | Towson | 16.5% | 9.8%(+6.68)#57 | 13.7%(+2.74)#2,206 |
| 58. | Forest Glen | 17.0% | 9.8%(+7.24)#58 | 13.7%(+3.31)#2,326 |
| 59. | Halfway | 17.2% | 9.8%(+7.44)#59 | 13.7%(+3.50)#2,344 |
| 60. | Summerfield | 17.3% | 9.8%(+7.50)#60 | 13.7%(+3.57)#2,352 |
| 61. | Baltimore | 17.8% | 9.8%(+8.03)#61 | 13.7%(+4.10)#2,419 |
| 62. | Woodlawn Cdp Baltimore County | 18.3% | 9.8%(+8.56)#62 | 13.7%(+4.63)#2,497 |
| 63. | Bel Air North | 19.0% | 9.8%(+9.24)#63 | 13.7%(+5.31)#2,577 |
| 64. | Essex | 19.4% | 9.8%(+9.64)#64 | 13.7%(+5.70)#2,628 |
| 65. | Marlton | 21.2% | 9.8%(+11.4)#65 | 13.7%(+7.50)#2,878 |
| 66. | Glenmont | 21.6% | 9.8%(+11.9)#66 | 13.7%(+7.92)#2,947 |
| 67. | Camp Springs | 21.8% | 9.8%(+12.0)#67 | 13.7%(+8.06)#2,958 |
| 68. | New Carrollton | 21.8% | 9.8%(+12.0)#68 | 13.7%(+8.08)#2,962 |
| 69. | California | 21.9% | 9.8%(+12.1)#69 | 13.7%(+8.18)#2,973 |
| 70. | Havre De Grace | 22.0% | 9.8%(+12.2)#70 | 13.7%(+8.27)#2,976 |
| 71. | Redland | 22.3% | 9.8%(+12.5)#71 | 13.7%(+8.59)#3,033 |
| 72. | Baltimore Highlands | 22.4% | 9.8%(+12.6)#72 | 13.7%(+8.68)#3,038 |
| 73. | Henderson | 23.1% | 9.8%(+13.3)#73 | 13.7%(+9.36)#3,116 |
| 74. | Elkton | 23.3% | 9.8%(+13.5)#74 | 13.7%(+9.60)#3,133 |
| 75. | Cresaptown | 23.5% | 9.8%(+13.8)#75 | 13.7%(+9.82)#3,153 |
| 76. | Mount Rainier | 25.0% | 9.8%(+15.2)#76 | 13.7%(+11.3)#3,264 |
| 77. | Riverdale Park | 25.1% | 9.8%(+15.3)#77 | 13.7%(+11.4)#3,336 |
| 78. | Flower Hill | 25.2% | 9.8%(+15.5)#78 | 13.7%(+11.5)#3,340 |
| 79. | Suitland | 26.9% | 9.8%(+17.1)#79 | 13.7%(+13.2)#3,480 |
| 80. | Seat Pleasant | 27.5% | 9.8%(+17.7)#80 | 13.7%(+13.8)#3,535 |
| 81. | Rosedale | 27.9% | 9.8%(+18.1)#81 | 13.7%(+14.2)#3,576 |
| 82. | Brooklyn Park | 28.5% | 9.8%(+18.7)#82 | 13.7%(+14.7)#3,616 |
| 83. | Savage | 29.5% | 9.8%(+19.8)#83 | 13.7%(+15.8)#3,713 |
| 84. | Hillcrest Heights | 29.6% | 9.8%(+19.8)#84 | 13.7%(+15.9)#3,715 |
| 85. | Landover | 29.8% | 9.8%(+20.0)#85 | 13.7%(+16.1)#3,733 |
| 86. | Crisfield | 30.2% | 9.8%(+20.5)#86 | 13.7%(+16.5)#3,784 |
| 87. | Cambridge | 30.6% | 9.8%(+20.8)#87 | 13.7%(+16.9)#3,815 |
| 88. | Friendly | 31.1% | 9.8%(+21.3)#88 | 13.7%(+17.4)#3,861 |
| 89. | Robinwood | 31.2% | 9.8%(+21.4)#89 | 13.7%(+17.5)#3,868 |
| 90. | Willards | 31.8% | 9.8%(+22.0)#90 | 13.7%(+18.1)#3,917 |
| 91. | Midland | 35.1% | 9.8%(+25.4)#91 | 13.7%(+21.4)#4,238 |
| 92. | Lexington Park | 35.2% | 9.8%(+25.5)#92 | 13.7%(+21.5)#4,243 |
| 93. | Hagerstown | 36.8% | 9.8%(+27.0)#93 | 13.7%(+23.1)#4,355 |
| 94. | Grasonville | 39.5% | 9.8%(+29.7)#94 | 13.7%(+25.8)#4,528 |
| 95. | Lake Arbor | 40.0% | 9.8%(+30.2)#95 | 13.7%(+26.3)#4,546 |
| 96. | Glassmanor | 40.7% | 9.8%(+31.0)#96 | 13.7%(+27.0)#4,636 |
| 97. | Parole | 44.4% | 9.8%(+34.7)#97 | 13.7%(+30.7)#4,830 |
| 98. | Marlow Heights | 50.0% | 9.8%(+40.2)#98 | 13.7%(+36.3)#5,056 |
| 99. | Cottage City | 50.0% | 9.8%(+40.2)#99 | 13.7%(+36.3)#5,100 |
| 100. | Funkstown | 50.0% | 9.8%(+40.2)#100 | 13.7%(+36.3)#5,120 |
Common Questions
What are the Top 10 Cities with the Lowest Poverty Level Among Single Fathers in Maryland?
Top 10 Cities with the Lowest Poverty Level Among Single Fathers in Maryland are:
#1
1.2%
#2
1.4%
#3
1.5%
#4
1.9%
#5
2.3%
#6
2.3%
#7
3.2%
#8
3.4%
#9
3.6%
#10
3.7%
What city has the Lowest Poverty Level Among Single Fathers in Maryland?
Gaithersburg has the Lowest Poverty Level Among Single Fathers in Maryland with 1.2%.
What is the Poverty Level Among Single Fathers in the State of Maryland?
Poverty Level Among Single Fathers in Maryland is 9.8%.
What is the Poverty Level Among Single Fathers in the United States?
Poverty Level Among Single Fathers in the United States is 13.7%.