Cities with the Lowest Poverty Level Among Single Fathers in Iowa
RELATED REPORTS & OPTIONS
Lowest Poverty | Single Father
Iowa
Compare Cities
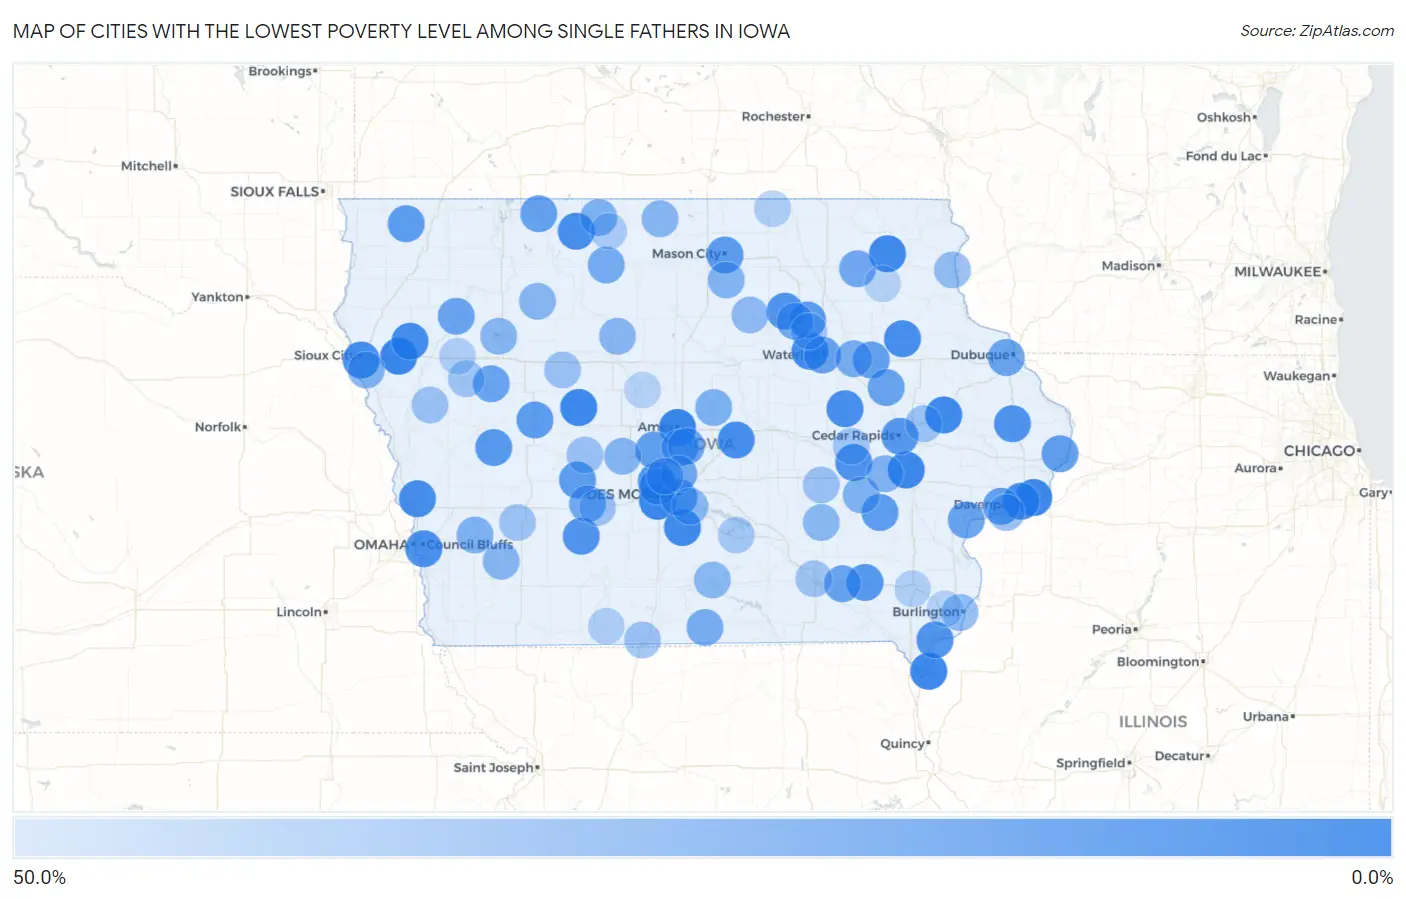
Map of Cities with the Lowest Poverty Level Among Single Fathers in Iowa
50.0%
0.0%
Cities with the Lowest Poverty Level Among Single Fathers in Iowa
| City | Single Father Poverty | vs State | vs National | |
| 1. | Moville | 5.1% | 12.2%(-7.03)#1 | 13.7%(-8.58)#460 |
| 2. | Ames | 5.3% | 12.2%(-6.90)#2 | 13.7%(-8.45)#469 |
| 3. | West Des Moines | 5.9% | 12.2%(-6.29)#3 | 13.7%(-7.85)#557 |
| 4. | Churdan | 6.2% | 12.2%(-5.91)#4 | 13.7%(-7.46)#614 |
| 5. | Keokuk | 6.6% | 12.2%(-5.58)#5 | 13.7%(-7.13)#653 |
| 6. | Bettendorf | 6.7% | 12.2%(-5.49)#6 | 13.7%(-7.05)#661 |
| 7. | North Liberty | 6.8% | 12.2%(-5.33)#7 | 13.7%(-6.88)#693 |
| 8. | Anamosa | 7.7% | 12.2%(-4.47)#8 | 13.7%(-6.02)#837 |
| 9. | Ossian | 7.7% | 12.2%(-4.47)#9 | 13.7%(-6.02)#847 |
| 10. | Indianola | 8.4% | 12.2%(-3.76)#10 | 13.7%(-5.32)#962 |
| 11. | Cedar Falls | 8.5% | 12.2%(-3.64)#11 | 13.7%(-5.19)#980 |
| 12. | Kingsley | 9.1% | 12.2%(-3.07)#12 | 13.7%(-4.62)#1,087 |
| 13. | Sioux City | 10.0% | 12.2%(-2.20)#13 | 13.7%(-3.75)#1,206 |
| 14. | Lamont | 10.0% | 12.2%(-2.16)#14 | 13.7%(-3.71)#1,230 |
| 15. | Ringsted | 10.0% | 12.2%(-2.16)#15 | 13.7%(-3.71)#1,231 |
| 16. | Garrison | 10.0% | 12.2%(-2.16)#16 | 13.7%(-3.71)#1,232 |
| 17. | Missouri Valley | 10.2% | 12.2%(-1.95)#17 | 13.7%(-3.51)#1,260 |
| 18. | Davenport | 10.5% | 12.2%(-1.67)#18 | 13.7%(-3.22)#1,295 |
| 19. | Melbourne | 10.5% | 12.2%(-1.63)#19 | 13.7%(-3.19)#1,306 |
| 20. | Council Bluffs | 11.8% | 12.2%(-0.384)#20 | 13.7%(-1.94)#1,505 |
| 21. | Maquoketa | 12.4% | 12.2%(+0.213)#21 | 13.7%(-1.34)#1,595 |
| 22. | Marengo | 12.8% | 12.2%(+0.662)#22 | 13.7%(-0.892)#1,678 |
| 23. | Fort Madison | 13.0% | 12.2%(+0.885)#23 | 13.7%(-0.669)#1,707 |
| 24. | Clarksville | 13.5% | 12.2%(+1.36)#24 | 13.7%(-0.199)#1,779 |
| 25. | Greenfield | 13.6% | 12.2%(+1.48)#25 | 13.7%(-0.076)#1,804 |
| 26. | Grimes | 13.7% | 12.2%(+1.55)#26 | 13.7%(-0.003)#1,819 |
| 27. | Urbandale | 15.7% | 12.2%(+3.58)#27 | 13.7%(+2.02)#2,115 |
| 28. | Fairfield | 16.1% | 12.2%(+3.93)#28 | 13.7%(+2.37)#2,165 |
| 29. | Cedar Rapids | 16.5% | 12.2%(+4.31)#29 | 13.7%(+2.76)#2,208 |
| 30. | Manilla | 16.7% | 12.2%(+4.51)#30 | 13.7%(+2.95)#2,272 |
| 31. | Waverly | 16.9% | 12.2%(+4.76)#31 | 13.7%(+3.21)#2,316 |
| 32. | Des Moines | 17.5% | 12.2%(+5.39)#32 | 13.7%(+3.83)#2,387 |
| 33. | Carroll | 17.6% | 12.2%(+5.41)#33 | 13.7%(+3.86)#2,389 |
| 34. | George | 17.6% | 12.2%(+5.49)#34 | 13.7%(+3.93)#2,401 |
| 35. | Guthrie Center | 17.8% | 12.2%(+5.62)#35 | 13.7%(+4.07)#2,413 |
| 36. | Mason City | 18.0% | 12.2%(+5.87)#36 | 13.7%(+4.32)#2,441 |
| 37. | Wellman | 18.2% | 12.2%(+6.02)#37 | 13.7%(+4.47)#2,465 |
| 38. | Clinton | 19.4% | 12.2%(+7.24)#38 | 13.7%(+5.69)#2,627 |
| 39. | Independence | 20.0% | 12.2%(+7.84)#39 | 13.7%(+6.29)#2,699 |
| 40. | Blue Grass | 20.0% | 12.2%(+7.84)#40 | 13.7%(+6.29)#2,714 |
| 41. | Madrid | 20.5% | 12.2%(+8.30)#41 | 13.7%(+6.74)#2,795 |
| 42. | Huxley | 21.1% | 12.2%(+8.89)#42 | 13.7%(+7.34)#2,862 |
| 43. | Estherville | 21.3% | 12.2%(+9.12)#43 | 13.7%(+7.56)#2,888 |
| 44. | Waterloo | 21.7% | 12.2%(+9.53)#44 | 13.7%(+7.97)#2,949 |
| 45. | Odebolt | 22.2% | 12.2%(+10.1)#45 | 13.7%(+8.51)#3,009 |
| 46. | Walker | 22.2% | 12.2%(+10.1)#46 | 13.7%(+8.51)#3,011 |
| 47. | Batavia | 22.2% | 12.2%(+10.1)#47 | 13.7%(+8.51)#3,017 |
| 48. | Muscatine | 22.4% | 12.2%(+10.2)#48 | 13.7%(+8.65)#3,036 |
| 49. | Cherokee | 22.5% | 12.2%(+10.3)#49 | 13.7%(+8.79)#3,044 |
| 50. | Cambridge | 22.7% | 12.2%(+10.6)#50 | 13.7%(+9.01)#3,070 |
| 51. | Dubuque | 22.8% | 12.2%(+10.6)#51 | 13.7%(+9.08)#3,077 |
| 52. | Ankeny | 24.3% | 12.2%(+12.2)#52 | 13.7%(+10.6)#3,224 |
| 53. | Johnston | 25.0% | 12.2%(+12.8)#53 | 13.7%(+11.3)#3,261 |
| 54. | Shell Rock | 25.0% | 12.2%(+12.8)#54 | 13.7%(+11.3)#3,286 |
| 55. | Menlo | 25.0% | 12.2%(+12.8)#55 | 13.7%(+11.3)#3,320 |
| 56. | Waucoma | 25.0% | 12.2%(+12.8)#56 | 13.7%(+11.3)#3,323 |
| 57. | Algona | 26.5% | 12.2%(+14.3)#57 | 13.7%(+12.8)#3,442 |
| 58. | Allerton | 27.3% | 12.2%(+15.1)#58 | 13.7%(+13.6)#3,520 |
| 59. | Jesup | 28.6% | 12.2%(+16.4)#59 | 13.7%(+14.9)#3,623 |
| 60. | Swea City | 30.0% | 12.2%(+17.8)#60 | 13.7%(+16.3)#3,759 |
| 61. | Zearing | 30.0% | 12.2%(+17.8)#61 | 13.7%(+16.3)#3,760 |
| 62. | Parnell | 30.0% | 12.2%(+17.8)#62 | 13.7%(+16.3)#3,769 |
| 63. | Oakland | 30.2% | 12.2%(+18.1)#63 | 13.7%(+16.5)#3,785 |
| 64. | Sergeant Bluff | 31.0% | 12.2%(+18.9)#64 | 13.7%(+17.3)#3,854 |
| 65. | Oxford | 31.2% | 12.2%(+19.1)#65 | 13.7%(+17.5)#3,877 |
| 66. | Rockwell | 32.3% | 12.2%(+20.1)#66 | 13.7%(+18.5)#3,949 |
| 67. | Perry | 33.0% | 12.2%(+20.9)#67 | 13.7%(+19.3)#3,988 |
| 68. | Laurens | 33.3% | 12.2%(+21.2)#68 | 13.7%(+19.6)#4,029 |
| 69. | Lakeside | 33.3% | 12.2%(+21.2)#69 | 13.7%(+19.6)#4,056 |
| 70. | Badger | 33.3% | 12.2%(+21.2)#70 | 13.7%(+19.6)#4,079 |
| 71. | Elliott | 33.3% | 12.2%(+21.2)#71 | 13.7%(+19.6)#4,080 |
| 72. | Thompson | 33.3% | 12.2%(+21.2)#72 | 13.7%(+19.6)#4,083 |
| 73. | Carlisle | 34.2% | 12.2%(+22.1)#73 | 13.7%(+20.5)#4,166 |
| 74. | Chariton | 34.4% | 12.2%(+22.2)#74 | 13.7%(+20.7)#4,177 |
| 75. | What Cheer | 34.6% | 12.2%(+22.5)#75 | 13.7%(+20.9)#4,200 |
| 76. | Burlington | 35.4% | 12.2%(+23.3)#76 | 13.7%(+21.7)#4,257 |
| 77. | Dumont | 35.7% | 12.2%(+23.6)#77 | 13.7%(+22.0)#4,280 |
| 78. | Buffalo | 36.8% | 12.2%(+24.7)#78 | 13.7%(+23.1)#4,361 |
| 79. | Marquette | 37.5% | 12.2%(+25.3)#79 | 13.7%(+23.8)#4,414 |
| 80. | Rockwell City | 40.0% | 12.2%(+27.8)#80 | 13.7%(+26.3)#4,558 |
| 81. | Lamoni | 40.0% | 12.2%(+27.8)#81 | 13.7%(+26.3)#4,560 |
| 82. | Stuart | 40.0% | 12.2%(+27.8)#82 | 13.7%(+26.3)#4,562 |
| 83. | Springville | 40.0% | 12.2%(+27.8)#83 | 13.7%(+26.3)#4,569 |
| 84. | Mapleton | 40.0% | 12.2%(+27.8)#84 | 13.7%(+26.3)#4,573 |
| 85. | Bagley | 40.0% | 12.2%(+27.8)#85 | 13.7%(+26.3)#4,604 |
| 86. | Guernsey | 40.0% | 12.2%(+27.8)#86 | 13.7%(+26.3)#4,611 |
| 87. | Atlantic | 41.0% | 12.2%(+28.9)#87 | 13.7%(+27.3)#4,647 |
| 88. | Ida Grove | 41.7% | 12.2%(+29.5)#88 | 13.7%(+28.0)#4,677 |
| 89. | Ottumwa | 41.9% | 12.2%(+29.7)#89 | 13.7%(+28.1)#4,690 |
| 90. | Janesville | 42.9% | 12.2%(+30.7)#90 | 13.7%(+29.1)#4,753 |
| 91. | Blairstown | 42.9% | 12.2%(+30.7)#91 | 13.7%(+29.1)#4,758 |
| 92. | Knoxville | 43.9% | 12.2%(+31.8)#92 | 13.7%(+30.2)#4,812 |
| 93. | Bancroft | 45.5% | 12.2%(+33.3)#93 | 13.7%(+31.7)#4,888 |
| 94. | Mount Ayr | 46.7% | 12.2%(+34.5)#94 | 13.7%(+33.0)#4,938 |
| 95. | Holstein | 47.1% | 12.2%(+34.9)#95 | 13.7%(+33.3)#4,955 |
| 96. | Stacyville | 47.1% | 12.2%(+34.9)#96 | 13.7%(+33.3)#4,960 |
| 97. | Mount Pleasant | 47.7% | 12.2%(+35.5)#97 | 13.7%(+34.0)#4,980 |
| 98. | West Union | 50.0% | 12.2%(+37.8)#98 | 13.7%(+36.3)#5,072 |
| 99. | Stratford | 50.0% | 12.2%(+37.8)#99 | 13.7%(+36.3)#5,122 |
| 100. | Middletown | 50.0% | 12.2%(+37.8)#100 | 13.7%(+36.3)#5,178 |
Common Questions
What are the Top 10 Cities with the Lowest Poverty Level Among Single Fathers in Iowa?
Top 10 Cities with the Lowest Poverty Level Among Single Fathers in Iowa are:
#1
5.1%
#2
5.3%
#3
5.9%
#4
6.2%
#5
6.6%
#6
6.7%
#7
6.8%
#8
7.7%
#9
7.7%
#10
8.4%
What city has the Lowest Poverty Level Among Single Fathers in Iowa?
Moville has the Lowest Poverty Level Among Single Fathers in Iowa with 5.1%.
What is the Poverty Level Among Single Fathers in the State of Iowa?
Poverty Level Among Single Fathers in Iowa is 12.2%.
What is the Poverty Level Among Single Fathers in the United States?
Poverty Level Among Single Fathers in the United States is 13.7%.