Cities with the Lowest Poverty Level Among Single Fathers in Kansas
RELATED REPORTS & OPTIONS
Lowest Poverty | Single Father
Kansas
Compare Cities
Map of Cities with the Lowest Poverty Level Among Single Fathers in Kansas
80.0%
0.0%
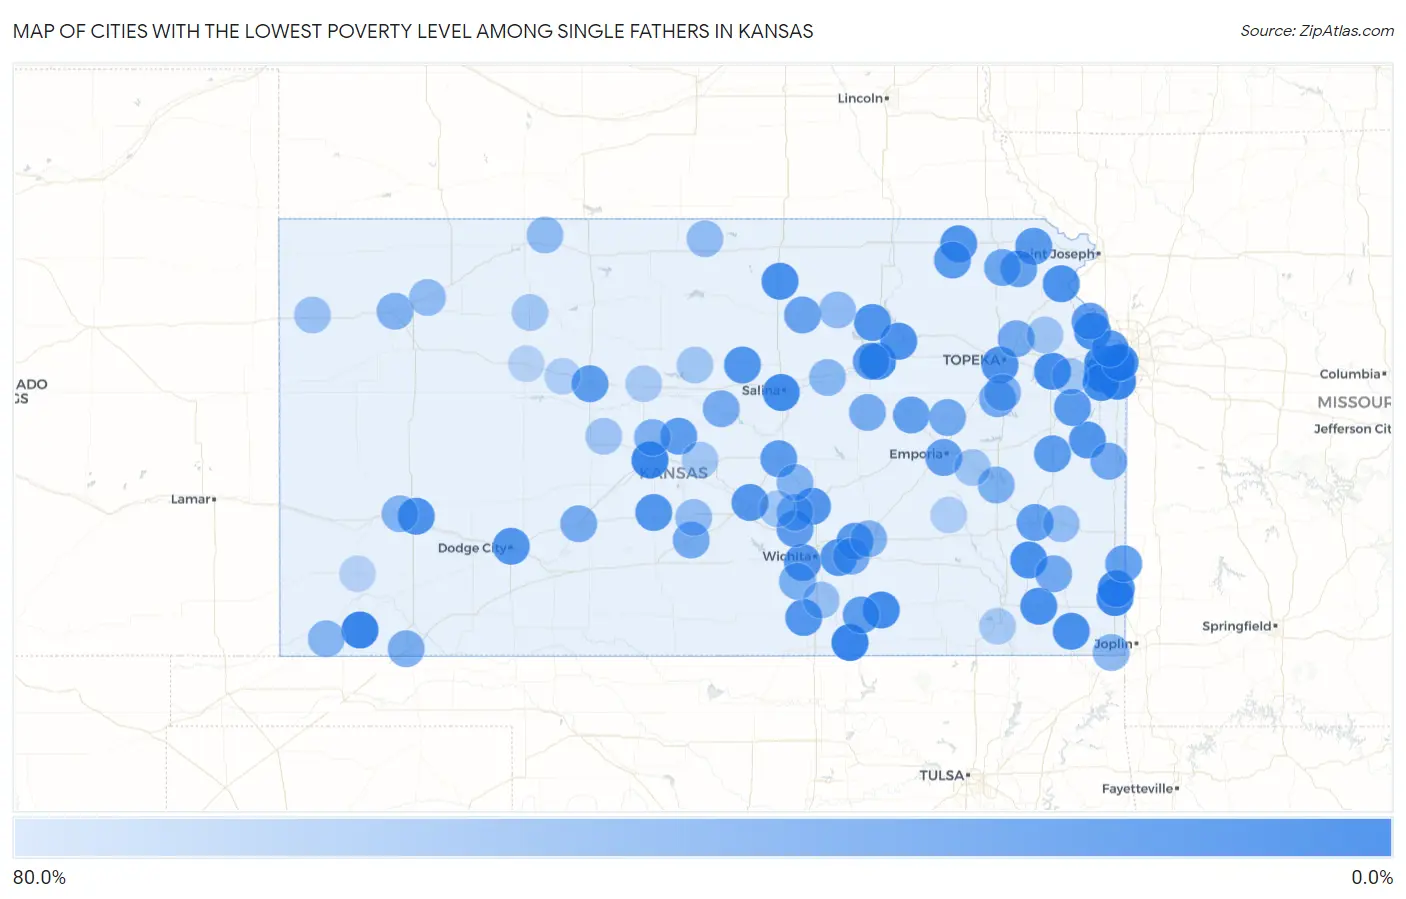
Cities with the Lowest Poverty Level Among Single Fathers in Kansas
| City | Single Father Poverty | vs State | vs National | |
| 1. | Hugoton | 2.2% | 12.8% (-10.6)#1 | 13.7% (-11.6)#100 |
| 2. | Arkansas City | 2.3% | 12.8% (-10.5)#2 | 13.7% (-11.4)#113 |
| 3. | Lenexa | 2.6% | 12.8% (-10.1)#3 | 13.7% (-11.1)#149 |
| 4. | Overland Park | 3.2% | 12.8% (-9.55)#4 | 13.7% (-10.5)#218 |
| 5. | Pittsburg | 4.0% | 12.8% (-8.79)#5 | 13.7% (-9.72)#299 |
| 6. | Great Bend | 4.1% | 12.8% (-8.68)#6 | 13.7% (-9.61)#317 |
| 7. | Merriam | 4.2% | 12.8% (-8.58)#7 | 13.7% (-9.52)#332 |
| 8. | Shawnee | 7.3% | 12.8% (-5.48)#8 | 13.7% (-6.42)#768 |
| 9. | Salina | 7.3% | 12.8% (-5.47)#9 | 13.7% (-6.40)#770 |
| 10. | Grandview Plaza | 7.3% | 12.8% (-5.46)#10 | 13.7% (-6.40)#774 |
| 11. | Burden | 8.3% | 12.8% (-4.44)#11 | 13.7% (-5.38)#955 |
| 12. | Lawrence | 8.6% | 12.8% (-4.22)#12 | 13.7% (-5.15)#986 |
| 13. | Olathe | 9.2% | 12.8% (-3.54)#13 | 13.7% (-4.48)#1,106 |
| 14. | Frontenac | 10.0% | 12.8% (-2.77)#14 | 13.7% (-3.71)#1,214 |
| 15. | Mission | 10.1% | 12.8% (-2.72)#15 | 13.7% (-3.66)#1,237 |
| 16. | Oswego | 11.1% | 12.8% (-1.66)#16 | 13.7% (-2.60)#1,413 |
| 17. | Concordia | 11.5% | 12.8% (-1.30)#17 | 13.7% (-2.24)#1,462 |
| 18. | Chanute | 11.9% | 12.8% (-0.903)#18 | 13.7% (-1.84)#1,517 |
| 19. | Lansing | 12.5% | 12.8% (-0.275)#19 | 13.7% (-1.21)#1,612 |
| 20. | Parsons | 12.5% | 12.8% (-0.275)#20 | 13.7% (-1.21)#1,613 |
| 21. | Manhattan | 13.0% | 12.8% (+0.181)#21 | 13.7% (-0.756)#1,692 |
| 22. | Garden City | 13.1% | 12.8% (+0.329)#22 | 13.7% (-0.609)#1,716 |
| 23. | Atchison | 13.9% | 12.8% (+1.11)#23 | 13.7% (+0.176)#1,844 |
| 24. | Topeka | 14.9% | 12.8% (+2.17)#24 | 13.7% (+1.24)#2,005 |
| 25. | Riley | 15.4% | 12.8% (+2.61)#25 | 13.7% (+1.67)#2,073 |
| 26. | Seneca | 15.8% | 12.8% (+3.01)#26 | 13.7% (+2.08)#2,126 |
| 27. | Osawatomie | 15.9% | 12.8% (+3.17)#27 | 13.7% (+2.23)#2,147 |
| 28. | Andover | 16.3% | 12.8% (+3.50)#28 | 13.7% (+2.57)#2,183 |
| 29. | Wellington | 16.4% | 12.8% (+3.59)#29 | 13.7% (+2.65)#2,198 |
| 30. | Dodge City | 16.4% | 12.8% (+3.63)#30 | 13.7% (+2.69)#2,201 |
| 31. | St John | 16.7% | 12.8% (+3.89)#31 | 13.7% (+2.95)#2,263 |
| 32. | Beverly | 16.7% | 12.8% (+3.89)#32 | 13.7% (+2.95)#2,292 |
| 33. | Wichita | 17.5% | 12.8% (+4.71)#33 | 13.7% (+3.77)#2,380 |
| 34. | Newton | 18.1% | 12.8% (+5.31)#34 | 13.7% (+4.37)#2,448 |
| 35. | Hutchinson | 18.1% | 12.8% (+5.34)#35 | 13.7% (+4.41)#2,449 |
| 36. | Towanda | 20.0% | 12.8% (+7.23)#36 | 13.7% (+6.29)#2,717 |
| 37. | Centralia | 20.0% | 12.8% (+7.23)#37 | 13.7% (+6.29)#2,753 |
| 38. | Robinson | 20.0% | 12.8% (+7.23)#38 | 13.7% (+6.29)#2,764 |
| 39. | Wellsville | 20.4% | 12.8% (+7.60)#39 | 13.7% (+6.66)#2,790 |
| 40. | Kansas City | 20.5% | 12.8% (+7.73)#40 | 13.7% (+6.79)#2,799 |
| 41. | Mcpherson | 21.1% | 12.8% (+8.28)#41 | 13.7% (+7.34)#2,861 |
| 42. | Richmond | 22.2% | 12.8% (+9.45)#42 | 13.7% (+8.51)#3,022 |
| 43. | Claflin | 22.2% | 12.8% (+9.45)#43 | 13.7% (+8.51)#3,025 |
| 44. | Junction City | 22.3% | 12.8% (+9.48)#44 | 13.7% (+8.54)#3,029 |
| 45. | Hays | 22.4% | 12.8% (+9.59)#45 | 13.7% (+8.66)#3,037 |
| 46. | Winfield | 22.8% | 12.8% (+10.0)#46 | 13.7% (+9.07)#3,074 |
| 47. | Bentley | 23.1% | 12.8% (+10.3)#47 | 13.7% (+9.36)#3,114 |
| 48. | Leavenworth | 24.1% | 12.8% (+11.3)#48 | 13.7% (+10.4)#3,202 |
| 49. | Arcadia | 24.3% | 12.8% (+11.5)#49 | 13.7% (+10.6)#3,227 |
| 50. | Iola | 24.8% | 12.8% (+12.0)#50 | 13.7% (+11.0)#3,249 |
| 51. | Emporia | 25.7% | 12.8% (+13.0)#51 | 13.7% (+12.0)#3,379 |
| 52. | Council Grove | 26.7% | 12.8% (+13.9)#52 | 13.7% (+13.0)#3,458 |
| 53. | Horton | 27.3% | 12.8% (+14.5)#53 | 13.7% (+13.6)#3,508 |
| 54. | Miltonvale | 28.6% | 12.8% (+15.8)#54 | 13.7% (+14.9)#3,645 |
| 55. | Kickapoo Site 5 | 30.8% | 12.8% (+18.0)#55 | 13.7% (+17.1)#3,838 |
| 56. | La Cygne | 32.6% | 12.8% (+19.8)#56 | 13.7% (+18.8)#3,966 |
| 57. | Erie | 33.3% | 12.8% (+20.6)#57 | 13.7% (+19.6)#4,021 |
| 58. | Scranton | 33.3% | 12.8% (+20.6)#58 | 13.7% (+19.6)#4,044 |
| 59. | Turon | 33.3% | 12.8% (+20.6)#59 | 13.7% (+19.6)#4,108 |
| 60. | Allen | 33.3% | 12.8% (+20.6)#60 | 13.7% (+19.6)#4,110 |
| 61. | Meriden | 35.0% | 12.8% (+22.2)#61 | 13.7% (+21.3)#4,231 |
| 62. | Kanopolis | 35.7% | 12.8% (+22.9)#62 | 13.7% (+22.0)#4,281 |
| 63. | Augusta | 35.9% | 12.8% (+23.1)#63 | 13.7% (+22.2)#4,288 |
| 64. | Kinsley | 36.0% | 12.8% (+23.2)#64 | 13.7% (+22.3)#4,302 |
| 65. | Herington | 36.4% | 12.8% (+23.6)#65 | 13.7% (+22.7)#4,326 |
| 66. | Liberal | 36.9% | 12.8% (+24.1)#66 | 13.7% (+23.2)#4,366 |
| 67. | Clearwater | 38.1% | 12.8% (+25.3)#67 | 13.7% (+24.4)#4,449 |
| 68. | Halstead | 38.1% | 12.8% (+25.3)#68 | 13.7% (+24.4)#4,451 |
| 69. | Burlington | 39.4% | 12.8% (+26.6)#69 | 13.7% (+25.7)#4,521 |
| 70. | Hoisington | 40.0% | 12.8% (+27.2)#70 | 13.7% (+26.3)#4,557 |
| 71. | Carbondale | 40.0% | 12.8% (+27.2)#71 | 13.7% (+26.3)#4,567 |
| 72. | Colby | 42.0% | 12.8% (+29.2)#72 | 13.7% (+28.3)#4,699 |
| 73. | El Dorado | 42.7% | 12.8% (+29.9)#73 | 13.7% (+29.0)#4,731 |
| 74. | Holcomb | 42.9% | 12.8% (+30.1)#74 | 13.7% (+29.1)#4,741 |
| 75. | Moundridge | 42.9% | 12.8% (+30.1)#75 | 13.7% (+29.1)#4,747 |
| 76. | Baxter Springs | 43.9% | 12.8% (+31.1)#76 | 13.7% (+30.1)#4,811 |
| 77. | Rolla | 45.5% | 12.8% (+32.7)#77 | 13.7% (+31.7)#4,887 |
| 78. | Abilene | 46.3% | 12.8% (+33.6)#78 | 13.7% (+32.6)#4,927 |
| 79. | Clay Center | 49.1% | 12.8% (+36.3)#79 | 13.7% (+35.3)#5,025 |
| 80. | Moran | 50.0% | 12.8% (+37.2)#80 | 13.7% (+36.3)#5,161 |
| 81. | Almena | 50.0% | 12.8% (+37.2)#81 | 13.7% (+36.3)#5,174 |
| 82. | Sylvia | 50.0% | 12.8% (+37.2)#82 | 13.7% (+36.3)#5,213 |
| 83. | Rexford | 50.0% | 12.8% (+37.2)#83 | 13.7% (+36.3)#5,216 |
| 84. | Burr Oak | 50.0% | 12.8% (+37.2)#84 | 13.7% (+36.3)#5,221 |
| 85. | Belle Plaine | 53.3% | 12.8% (+40.6)#85 | 13.7% (+39.6)#5,334 |
| 86. | Goodland | 55.3% | 12.8% (+42.5)#86 | 13.7% (+41.6)#5,419 |
| 87. | Oskaloosa | 57.1% | 12.8% (+44.4)#87 | 13.7% (+43.4)#5,495 |
| 88. | Hartford | 57.1% | 12.8% (+44.4)#88 | 13.7% (+43.4)#5,510 |
| 89. | Bison | 57.1% | 12.8% (+44.4)#89 | 13.7% (+43.4)#5,519 |
| 90. | Eudora | 59.0% | 12.8% (+46.2)#90 | 13.7% (+45.3)#5,572 |
| 91. | Hill City | 59.3% | 12.8% (+46.5)#91 | 13.7% (+45.5)#5,583 |
| 92. | Chase | 59.3% | 12.8% (+46.5)#92 | 13.7% (+45.5)#5,585 |
| 93. | Burrton | 60.0% | 12.8% (+47.2)#93 | 13.7% (+46.3)#5,611 |
| 94. | Sylvan Grove | 60.0% | 12.8% (+47.2)#94 | 13.7% (+46.3)#5,635 |
| 95. | Independence | 61.8% | 12.8% (+49.0)#95 | 13.7% (+48.1)#5,691 |
| 96. | Russell | 62.9% | 12.8% (+50.1)#96 | 13.7% (+49.2)#5,724 |
| 97. | Ellis | 66.7% | 12.8% (+53.9)#97 | 13.7% (+53.0)#5,815 |
| 98. | Hamilton | 66.7% | 12.8% (+53.9)#98 | 13.7% (+53.0)#5,871 |
| 99. | Wakeeney | 69.6% | 12.8% (+56.8)#99 | 13.7% (+55.9)#5,936 |
| 100. | Ulysses | 69.7% | 12.8% (+56.9)#100 | 13.7% (+56.0)#5,938 |
Common Questions
What are the Top 10 Cities with the Lowest Poverty Level Among Single Fathers in Kansas?
Top 10 Cities with the Lowest Poverty Level Among Single Fathers in Kansas are:
#1
2.2%
#2
2.3%
#3
2.6%
#4
3.2%
#5
4.0%
#6
4.1%
#7
4.2%
#8
7.3%
#9
7.3%
#10
7.3%
What city has the Lowest Poverty Level Among Single Fathers in Kansas?
Hugoton has the Lowest Poverty Level Among Single Fathers in Kansas with 2.2%.
What is the Poverty Level Among Single Fathers in the State of Kansas?
Poverty Level Among Single Fathers in Kansas is 12.8%.
What is the Poverty Level Among Single Fathers in the United States?
Poverty Level Among Single Fathers in the United States is 13.7%.