Cities with the Lowest Poverty Level Among Single Fathers in North Carolina
RELATED REPORTS & OPTIONS
Lowest Poverty | Single Father
North Carolina
Compare Cities
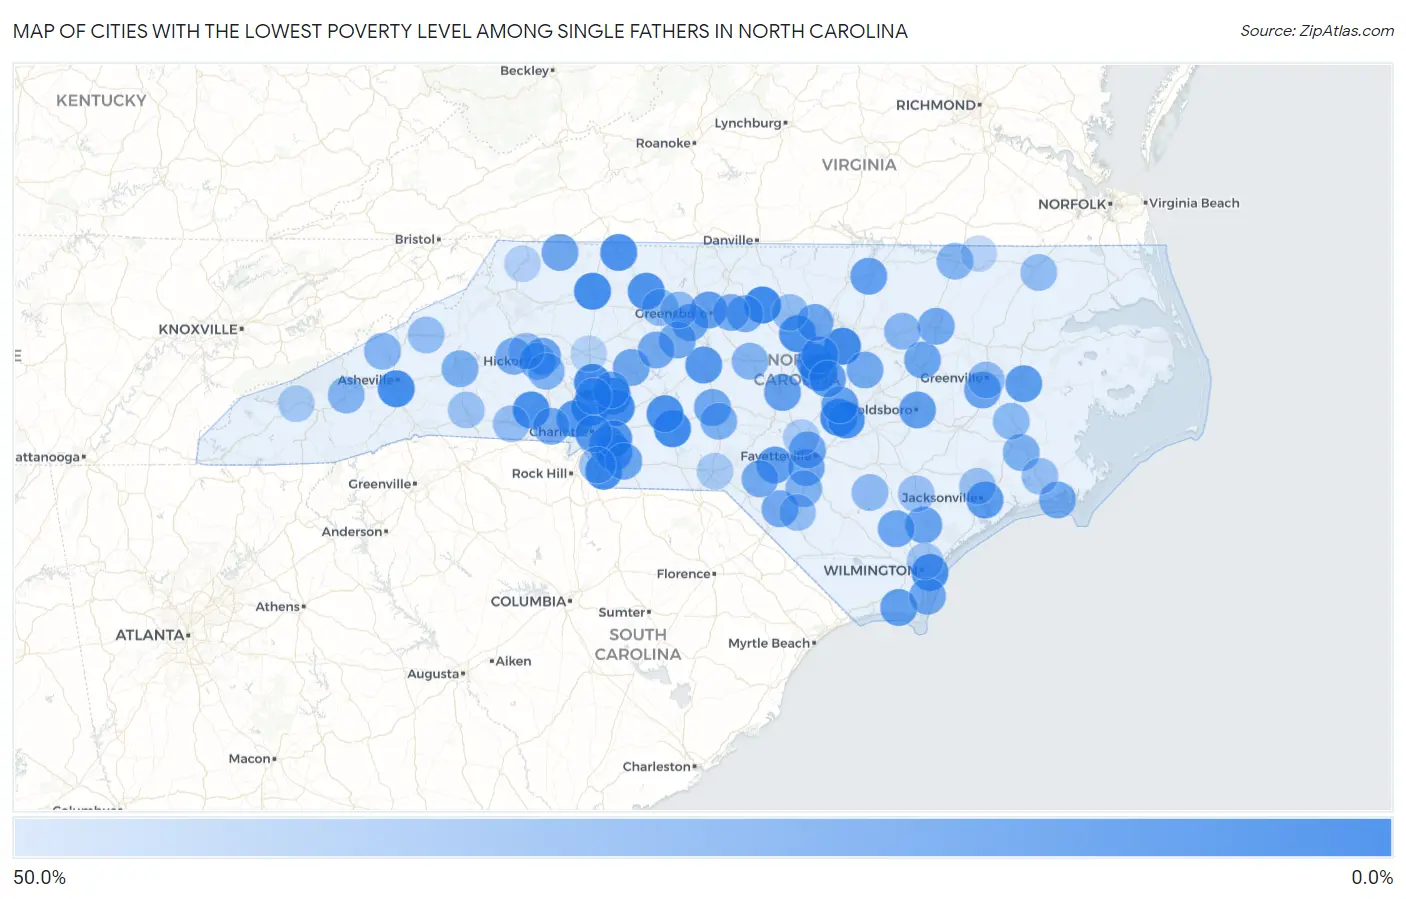
Map of Cities with the Lowest Poverty Level Among Single Fathers in North Carolina
50.0%
0.0%
Cities with the Lowest Poverty Level Among Single Fathers in North Carolina
| City | Single Father Poverty | vs State | vs National | |
| 1. | Huntersville | 0.33% | 16.3%(-16.0)#1 | 13.7%(-13.4)#2 |
| 2. | Green Level | 3.0% | 16.3%(-13.3)#2 | 13.7%(-10.7)#192 |
| 3. | Erwin | 3.3% | 16.3%(-13.0)#3 | 13.7%(-10.4)#232 |
| 4. | Kannapolis | 3.5% | 16.3%(-12.9)#4 | 13.7%(-10.2)#241 |
| 5. | Norwood | 3.6% | 16.3%(-12.7)#5 | 13.7%(-10.1)#257 |
| 6. | Holly Springs | 3.7% | 16.3%(-12.7)#6 | 13.7%(-10.0)#269 |
| 7. | Raleigh | 3.7% | 16.3%(-12.6)#7 | 13.7%(-9.98)#275 |
| 8. | Mooresville | 4.0% | 16.3%(-12.4)#8 | 13.7%(-9.75)#297 |
| 9. | Asheville | 4.5% | 16.3%(-11.9)#9 | 13.7%(-9.23)#370 |
| 10. | Jonesville | 4.5% | 16.3%(-11.8)#10 | 13.7%(-9.17)#379 |
| 11. | Concord | 5.4% | 16.3%(-10.9)#11 | 13.7%(-8.28)#498 |
| 12. | Waxhaw | 6.3% | 16.3%(-10.0)#12 | 13.7%(-7.39)#618 |
| 13. | Apex | 6.4% | 16.3%(-9.93)#13 | 13.7%(-7.30)#633 |
| 14. | Cherryville | 6.5% | 16.3%(-9.80)#14 | 13.7%(-7.17)#649 |
| 15. | Tobaccoville | 7.1% | 16.3%(-9.20)#15 | 13.7%(-6.57)#737 |
| 16. | Dunn | 7.2% | 16.3%(-9.10)#16 | 13.7%(-6.47)#758 |
| 17. | Matthews | 7.4% | 16.3%(-8.97)#17 | 13.7%(-6.34)#782 |
| 18. | Chapel Hill | 7.5% | 16.3%(-8.86)#18 | 13.7%(-6.23)#803 |
| 19. | Mount Airy | 7.6% | 16.3%(-8.75)#19 | 13.7%(-6.12)#818 |
| 20. | Albemarle | 7.6% | 16.3%(-8.73)#20 | 13.7%(-6.10)#821 |
| 21. | Wilmington | 7.9% | 16.3%(-8.45)#21 | 13.7%(-5.82)#889 |
| 22. | Mount Holly | 9.4% | 16.3%(-6.94)#22 | 13.7%(-4.31)#1,127 |
| 23. | Indian Trail | 9.8% | 16.3%(-6.51)#23 | 13.7%(-3.88)#1,192 |
| 24. | Cary | 10.3% | 16.3%(-6.04)#24 | 13.7%(-3.41)#1,274 |
| 25. | Asheboro | 10.7% | 16.3%(-5.60)#25 | 13.7%(-2.97)#1,344 |
| 26. | Mint Hill | 11.0% | 16.3%(-5.30)#26 | 13.7%(-2.67)#1,392 |
| 27. | Charlotte | 11.8% | 16.3%(-4.53)#27 | 13.7%(-1.90)#1,507 |
| 28. | Jacksonville | 11.8% | 16.3%(-4.50)#28 | 13.7%(-1.87)#1,511 |
| 29. | Washington | 13.1% | 16.3%(-3.25)#29 | 13.7%(-0.617)#1,715 |
| 30. | Greensboro | 13.6% | 16.3%(-2.71)#30 | 13.7%(-0.081)#1,796 |
| 31. | Raeford | 13.6% | 16.3%(-2.71)#31 | 13.7%(-0.076)#1,802 |
| 32. | Emma | 13.8% | 16.3%(-2.59)#32 | 13.7%(+0.038)#1,829 |
| 33. | Anderson Creek | 14.0% | 16.3%(-2.36)#33 | 13.7%(+0.266)#1,861 |
| 34. | Oak Island | 14.0% | 16.3%(-2.31)#34 | 13.7%(+0.323)#1,866 |
| 35. | Goldsboro | 14.2% | 16.3%(-2.11)#35 | 13.7%(+0.520)#1,884 |
| 36. | Coats | 14.3% | 16.3%(-2.06)#36 | 13.7%(+0.573)#1,908 |
| 37. | Henderson | 15.0% | 16.3%(-1.36)#37 | 13.7%(+1.27)#2,008 |
| 38. | Sanford | 15.5% | 16.3%(-0.834)#38 | 13.7%(+1.80)#2,083 |
| 39. | Fuquay Varina | 16.0% | 16.3%(-0.385)#39 | 13.7%(+2.25)#2,148 |
| 40. | Burgaw | 16.1% | 16.3%(-0.271)#40 | 13.7%(+2.36)#2,163 |
| 41. | Winterville | 16.7% | 16.3%(+0.324)#41 | 13.7%(+2.95)#2,233 |
| 42. | St Stephens | 16.9% | 16.3%(+0.541)#42 | 13.7%(+3.17)#2,311 |
| 43. | High Point | 17.2% | 16.3%(+0.812)#43 | 13.7%(+3.44)#2,338 |
| 44. | Monroe | 17.6% | 16.3%(+1.26)#44 | 13.7%(+3.89)#2,394 |
| 45. | Atkinson | 17.6% | 16.3%(+1.30)#45 | 13.7%(+3.93)#2,406 |
| 46. | Durham | 17.9% | 16.3%(+1.59)#46 | 13.7%(+4.22)#2,428 |
| 47. | Wilson | 18.0% | 16.3%(+1.64)#47 | 13.7%(+4.27)#2,434 |
| 48. | Sparta | 18.2% | 16.3%(+1.84)#48 | 13.7%(+4.47)#2,464 |
| 49. | Star | 18.2% | 16.3%(+1.84)#49 | 13.7%(+4.47)#2,471 |
| 50. | Salisbury | 18.4% | 16.3%(+2.06)#50 | 13.7%(+4.69)#2,502 |
| 51. | Hope Mills | 18.6% | 16.3%(+2.25)#51 | 13.7%(+4.88)#2,523 |
| 52. | Fayetteville | 19.1% | 16.3%(+2.73)#52 | 13.7%(+5.36)#2,596 |
| 53. | Pembroke | 19.2% | 16.3%(+2.89)#53 | 13.7%(+5.52)#2,609 |
| 54. | Rocky Mount | 19.5% | 16.3%(+3.16)#54 | 13.7%(+5.79)#2,640 |
| 55. | Burlington | 19.7% | 16.3%(+3.37)#55 | 13.7%(+6.00)#2,667 |
| 56. | Thomasville | 19.8% | 16.3%(+3.41)#56 | 13.7%(+6.04)#2,671 |
| 57. | Carolina Beach | 19.8% | 16.3%(+3.41)#57 | 13.7%(+6.04)#2,672 |
| 58. | Lexington | 19.8% | 16.3%(+3.46)#58 | 13.7%(+6.09)#2,678 |
| 59. | Clayton | 19.9% | 16.3%(+3.58)#59 | 13.7%(+6.21)#2,688 |
| 60. | Wagram | 20.0% | 16.3%(+3.66)#60 | 13.7%(+6.29)#2,729 |
| 61. | Enochville | 20.4% | 16.3%(+4.03)#61 | 13.7%(+6.66)#2,789 |
| 62. | Morehead City | 20.7% | 16.3%(+4.35)#62 | 13.7%(+6.98)#2,816 |
| 63. | Gastonia | 20.7% | 16.3%(+4.40)#63 | 13.7%(+7.03)#2,829 |
| 64. | Rutherford College | 21.6% | 16.3%(+5.23)#64 | 13.7%(+7.86)#2,936 |
| 65. | Sedalia | 22.2% | 16.3%(+5.88)#65 | 13.7%(+8.51)#3,020 |
| 66. | Marion | 22.8% | 16.3%(+6.46)#66 | 13.7%(+9.09)#3,079 |
| 67. | Davidson | 22.9% | 16.3%(+6.51)#67 | 13.7%(+9.14)#3,080 |
| 68. | New Bern | 23.1% | 16.3%(+6.72)#68 | 13.7%(+9.35)#3,091 |
| 69. | Candor | 23.1% | 16.3%(+6.73)#69 | 13.7%(+9.36)#3,107 |
| 70. | Hickory | 23.3% | 16.3%(+6.92)#70 | 13.7%(+9.55)#3,129 |
| 71. | St Pauls | 25.0% | 16.3%(+8.66)#71 | 13.7%(+11.3)#3,275 |
| 72. | Newton | 25.1% | 16.3%(+8.79)#72 | 13.7%(+11.4)#3,337 |
| 73. | Waynesville | 25.7% | 16.3%(+9.33)#73 | 13.7%(+12.0)#3,377 |
| 74. | Siler City | 25.7% | 16.3%(+9.37)#74 | 13.7%(+12.0)#3,378 |
| 75. | Roanoke Rapids | 26.4% | 16.3%(+10.0)#75 | 13.7%(+12.7)#3,435 |
| 76. | Marshall | 26.7% | 16.3%(+10.3)#76 | 13.7%(+13.0)#3,465 |
| 77. | Spring Hope | 26.9% | 16.3%(+10.6)#77 | 13.7%(+13.2)#3,486 |
| 78. | Vanceboro | 27.9% | 16.3%(+11.6)#78 | 13.7%(+14.2)#3,575 |
| 79. | Winston Salem | 28.3% | 16.3%(+12.0)#79 | 13.7%(+14.6)#3,610 |
| 80. | Garland | 28.6% | 16.3%(+12.2)#80 | 13.7%(+14.9)#3,628 |
| 81. | Greenville | 28.9% | 16.3%(+12.6)#81 | 13.7%(+15.2)#3,664 |
| 82. | Kernersville | 29.2% | 16.3%(+12.9)#82 | 13.7%(+15.5)#3,691 |
| 83. | Marvin | 30.0% | 16.3%(+13.7)#83 | 13.7%(+16.3)#3,742 |
| 84. | Hillsborough | 30.3% | 16.3%(+14.0)#84 | 13.7%(+16.6)#3,789 |
| 85. | Cofield | 30.4% | 16.3%(+14.1)#85 | 13.7%(+16.7)#3,804 |
| 86. | Granite Falls | 30.8% | 16.3%(+14.4)#86 | 13.7%(+17.1)#3,827 |
| 87. | Shelby | 30.8% | 16.3%(+14.4)#87 | 13.7%(+17.1)#3,839 |
| 88. | Lumberton | 30.9% | 16.3%(+14.6)#88 | 13.7%(+17.2)#3,848 |
| 89. | Burnsville | 31.1% | 16.3%(+14.8)#89 | 13.7%(+17.4)#3,865 |
| 90. | Havelock | 31.7% | 16.3%(+15.4)#90 | 13.7%(+18.0)#3,908 |
| 91. | Half Moon | 32.1% | 16.3%(+15.8)#91 | 13.7%(+18.4)#3,939 |
| 92. | Teachey | 32.5% | 16.3%(+16.2)#92 | 13.7%(+18.8)#3,965 |
| 93. | Ruth | 33.3% | 16.3%(+17.0)#93 | 13.7%(+19.6)#4,066 |
| 94. | Wrightsboro | 34.7% | 16.3%(+18.4)#94 | 13.7%(+21.0)#4,202 |
| 95. | Bryson City | 36.4% | 16.3%(+20.0)#95 | 13.7%(+22.7)#4,328 |
| 96. | Rockingham | 37.1% | 16.3%(+20.8)#96 | 13.7%(+23.4)#4,380 |
| 97. | Spring Lake | 37.9% | 16.3%(+21.6)#97 | 13.7%(+24.2)#4,438 |
| 98. | Jefferson | 40.8% | 16.3%(+24.5)#98 | 13.7%(+27.1)#4,640 |
| 99. | Statesville | 41.4% | 16.3%(+25.0)#99 | 13.7%(+27.7)#4,667 |
| 100. | Seaboard | 42.1% | 16.3%(+25.8)#100 | 13.7%(+28.4)#4,707 |
Common Questions
What are the Top 10 Cities with the Lowest Poverty Level Among Single Fathers in North Carolina?
Top 10 Cities with the Lowest Poverty Level Among Single Fathers in North Carolina are:
#1
0.33%
#2
3.0%
#3
3.3%
#4
3.5%
#5
3.6%
#6
3.7%
#7
3.7%
#8
4.0%
#9
4.5%
#10
4.5%
What city has the Lowest Poverty Level Among Single Fathers in North Carolina?
Huntersville has the Lowest Poverty Level Among Single Fathers in North Carolina with 0.33%.
What is the Poverty Level Among Single Fathers in the State of North Carolina?
Poverty Level Among Single Fathers in North Carolina is 16.3%.
What is the Poverty Level Among Single Fathers in the United States?
Poverty Level Among Single Fathers in the United States is 13.7%.