Cities with the Lowest Poverty Level Among Single Fathers in Virginia
RELATED REPORTS & OPTIONS
Lowest Poverty | Single Father
Virginia
Compare Cities
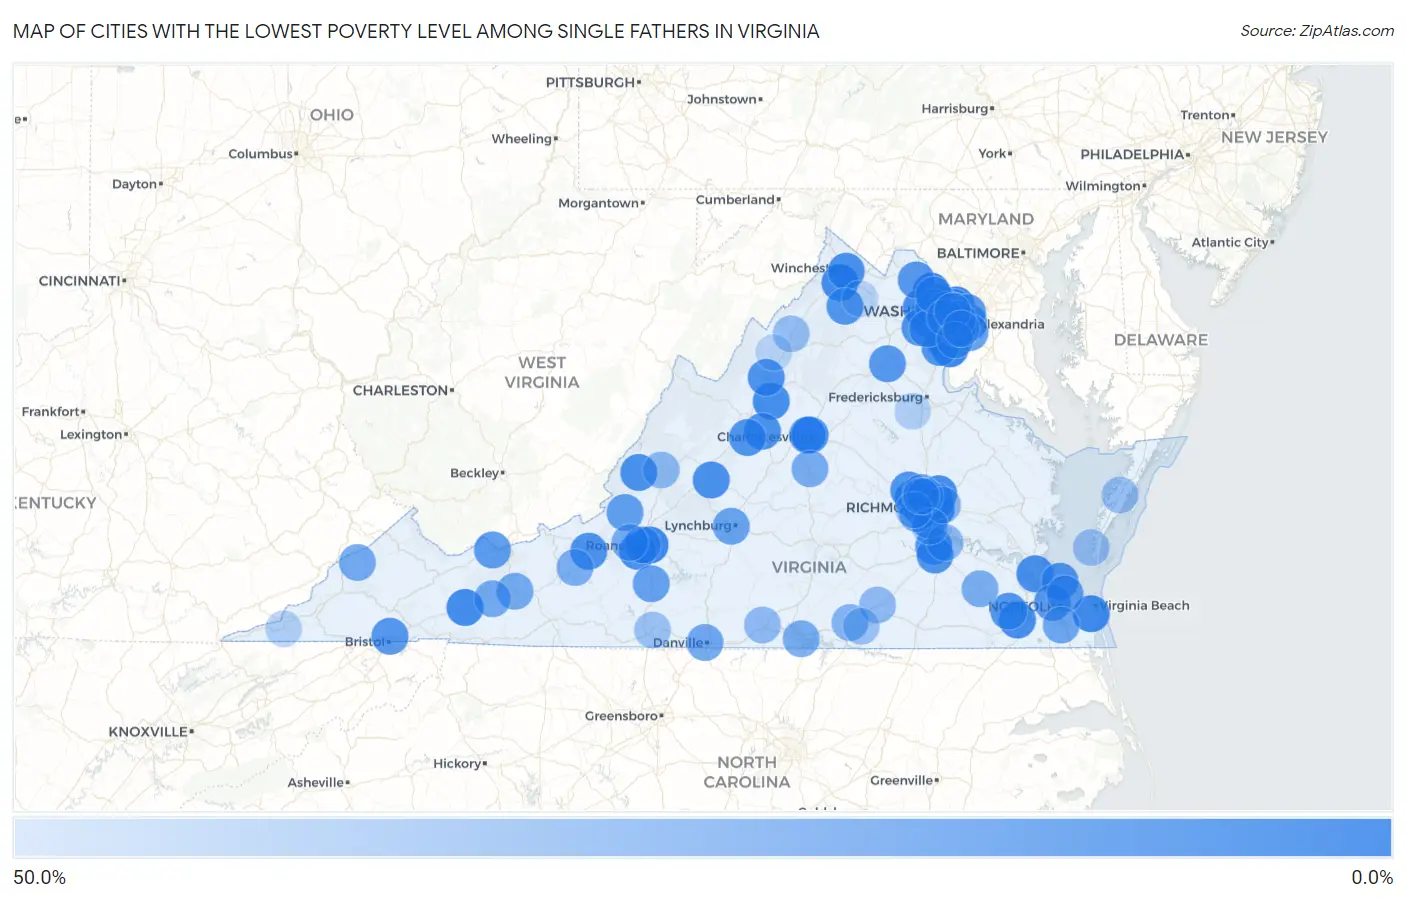
Map of Cities with the Lowest Poverty Level Among Single Fathers in Virginia
50.0%
0.0%
Cities with the Lowest Poverty Level Among Single Fathers in Virginia
| City | Single Father Poverty | vs State | vs National | |
| 1. | Dulles Town Center | 0.76% | 10.5%(-9.69)#1 | 13.7%(-13.0)#8 |
| 2. | Vinton | 2.0% | 10.5%(-8.46)#2 | 13.7%(-11.7)#83 |
| 3. | Charlottesville | 2.4% | 10.5%(-8.04)#3 | 13.7%(-11.3)#126 |
| 4. | Mclean | 2.5% | 10.5%(-7.97)#4 | 13.7%(-11.2)#130 |
| 5. | Woodbridge | 2.7% | 10.5%(-7.78)#5 | 13.7%(-11.0)#153 |
| 6. | Centreville | 2.7% | 10.5%(-7.78)#6 | 13.7%(-11.0)#155 |
| 7. | Virginia Beach | 3.8% | 10.5%(-6.69)#7 | 13.7%(-9.95)#279 |
| 8. | Tuckahoe | 4.5% | 10.5%(-5.95)#8 | 13.7%(-9.21)#372 |
| 9. | Stephens City | 4.7% | 10.5%(-5.80)#9 | 13.7%(-9.06)#393 |
| 10. | Marion | 4.9% | 10.5%(-5.55)#10 | 13.7%(-8.81)#428 |
| 11. | Tysons | 5.1% | 10.5%(-5.36)#11 | 13.7%(-8.62)#453 |
| 12. | Mechanicsville | 5.2% | 10.5%(-5.20)#12 | 13.7%(-8.46)#468 |
| 13. | Grottoes | 5.9% | 10.5%(-4.57)#13 | 13.7%(-7.83)#560 |
| 14. | Suffolk | 6.6% | 10.5%(-3.83)#14 | 13.7%(-7.09)#658 |
| 15. | South Riding | 6.6% | 10.5%(-3.81)#15 | 13.7%(-7.07)#659 |
| 16. | Newport News | 7.5% | 10.5%(-2.91)#16 | 13.7%(-6.17)#807 |
| 17. | Covington | 7.6% | 10.5%(-2.84)#17 | 13.7%(-6.10)#823 |
| 18. | Montrose | 7.8% | 10.5%(-2.61)#18 | 13.7%(-5.87)#880 |
| 19. | Cave Spring | 8.0% | 10.5%(-2.41)#19 | 13.7%(-5.67)#914 |
| 20. | Buena Vista | 8.1% | 10.5%(-2.37)#20 | 13.7%(-5.63)#919 |
| 21. | Winchester | 8.3% | 10.5%(-2.20)#21 | 13.7%(-5.46)#940 |
| 22. | Reston | 8.3% | 10.5%(-2.18)#22 | 13.7%(-5.44)#944 |
| 23. | Idylwood | 8.5% | 10.5%(-1.94)#23 | 13.7%(-5.20)#977 |
| 24. | Colonial Heights | 8.6% | 10.5%(-1.84)#24 | 13.7%(-5.10)#1,002 |
| 25. | Harrisonburg | 8.6% | 10.5%(-1.82)#25 | 13.7%(-5.08)#1,007 |
| 26. | Blacksburg | 8.7% | 10.5%(-1.71)#26 | 13.7%(-4.97)#1,025 |
| 27. | Waynesboro | 8.8% | 10.5%(-1.68)#27 | 13.7%(-4.95)#1,029 |
| 28. | Lake Ridge | 8.9% | 10.5%(-1.53)#28 | 13.7%(-4.79)#1,053 |
| 29. | Hampton | 9.3% | 10.5%(-1.12)#29 | 13.7%(-4.39)#1,116 |
| 30. | Bull Run | 9.5% | 10.5%(-0.911)#30 | 13.7%(-4.17)#1,150 |
| 31. | Alexandria | 10.0% | 10.5%(-0.442)#31 | 13.7%(-3.70)#1,233 |
| 32. | Front Royal | 10.0% | 10.5%(-0.414)#32 | 13.7%(-3.68)#1,236 |
| 33. | Short Pump | 10.2% | 10.5%(-0.257)#33 | 13.7%(-3.52)#1,257 |
| 34. | Petersburg | 10.3% | 10.5%(-0.194)#34 | 13.7%(-3.46)#1,266 |
| 35. | Stuarts Draft | 10.3% | 10.5%(-0.194)#35 | 13.7%(-3.46)#1,267 |
| 36. | West Falls Church | 10.4% | 10.5%(-0.021)#36 | 13.7%(-3.28)#1,287 |
| 37. | Vienna | 11.0% | 10.5%(+0.558)#37 | 13.7%(-2.70)#1,385 |
| 38. | Dale City | 11.3% | 10.5%(+0.868)#38 | 13.7%(-2.39)#1,441 |
| 39. | Windsor | 11.5% | 10.5%(+1.09)#39 | 13.7%(-2.17)#1,470 |
| 40. | Richmond | 11.6% | 10.5%(+1.10)#40 | 13.7%(-2.16)#1,476 |
| 41. | Lincolnia | 11.6% | 10.5%(+1.14)#41 | 13.7%(-2.12)#1,480 |
| 42. | Bristol | 12.1% | 10.5%(+1.70)#42 | 13.7%(-1.56)#1,558 |
| 43. | Remington | 12.5% | 10.5%(+2.05)#43 | 13.7%(-1.21)#1,634 |
| 44. | Leesburg | 12.6% | 10.5%(+2.15)#44 | 13.7%(-1.11)#1,650 |
| 45. | Franklin Farm | 12.7% | 10.5%(+2.23)#45 | 13.7%(-1.04)#1,661 |
| 46. | Midlothian | 13.3% | 10.5%(+2.83)#46 | 13.7%(-0.431)#1,742 |
| 47. | Bensley | 13.3% | 10.5%(+2.88)#47 | 13.7%(-0.379)#1,752 |
| 48. | Arlington | 14.0% | 10.5%(+3.53)#48 | 13.7%(+0.269)#1,862 |
| 49. | Bluefield | 14.3% | 10.5%(+3.83)#49 | 13.7%(+0.573)#1,899 |
| 50. | Oakton | 14.7% | 10.5%(+4.21)#50 | 13.7%(+0.950)#1,976 |
| 51. | Portsmouth | 15.3% | 10.5%(+4.84)#51 | 13.7%(+1.57)#2,049 |
| 52. | East Highland Park | 15.4% | 10.5%(+4.91)#52 | 13.7%(+1.64)#2,058 |
| 53. | Norfolk | 16.1% | 10.5%(+5.65)#53 | 13.7%(+2.39)#2,167 |
| 54. | University Of Virginia | 16.1% | 10.5%(+5.68)#54 | 13.7%(+2.42)#2,168 |
| 55. | Hybla Valley | 16.4% | 10.5%(+5.98)#55 | 13.7%(+2.72)#2,205 |
| 56. | New Castle | 16.7% | 10.5%(+6.22)#56 | 13.7%(+2.95)#2,288 |
| 57. | Manassas Park | 17.4% | 10.5%(+7.00)#57 | 13.7%(+3.74)#2,375 |
| 58. | Roanoke | 18.0% | 10.5%(+7.53)#58 | 13.7%(+4.27)#2,437 |
| 59. | Rocky Mount | 18.1% | 10.5%(+7.62)#59 | 13.7%(+4.36)#2,446 |
| 60. | Springfield | 18.2% | 10.5%(+7.78)#60 | 13.7%(+4.52)#2,485 |
| 61. | Annandale | 18.6% | 10.5%(+8.15)#61 | 13.7%(+4.89)#2,524 |
| 62. | Sterling | 18.9% | 10.5%(+8.47)#62 | 13.7%(+5.21)#2,569 |
| 63. | Lynchburg | 19.6% | 10.5%(+9.11)#63 | 13.7%(+5.85)#2,652 |
| 64. | Fairfax | 19.6% | 10.5%(+9.11)#64 | 13.7%(+5.85)#2,653 |
| 65. | Manchester | 19.8% | 10.5%(+9.33)#65 | 13.7%(+6.07)#2,677 |
| 66. | Chesapeake | 20.7% | 10.5%(+10.3)#66 | 13.7%(+7.01)#2,825 |
| 67. | Woodlawn Cdp Fairfax County | 20.8% | 10.5%(+10.4)#67 | 13.7%(+7.09)#2,837 |
| 68. | Dunn Loring | 20.8% | 10.5%(+10.4)#68 | 13.7%(+7.12)#2,841 |
| 69. | Danville | 21.5% | 10.5%(+11.0)#69 | 13.7%(+7.77)#2,922 |
| 70. | Laurel | 22.1% | 10.5%(+11.7)#70 | 13.7%(+8.39)#2,988 |
| 71. | Wytheville | 23.0% | 10.5%(+12.5)#71 | 13.7%(+9.24)#3,086 |
| 72. | Rural Retreat | 23.1% | 10.5%(+12.6)#72 | 13.7%(+9.36)#3,103 |
| 73. | Clintwood | 23.1% | 10.5%(+12.6)#73 | 13.7%(+9.36)#3,105 |
| 74. | Salem | 23.7% | 10.5%(+13.2)#74 | 13.7%(+9.95)#3,170 |
| 75. | Lorton | 24.4% | 10.5%(+13.9)#75 | 13.7%(+10.7)#3,228 |
| 76. | Clarksville | 25.0% | 10.5%(+14.5)#76 | 13.7%(+11.3)#3,285 |
| 77. | Scottsville | 25.0% | 10.5%(+14.5)#77 | 13.7%(+11.3)#3,307 |
| 78. | Wakefield | 25.9% | 10.5%(+15.5)#78 | 13.7%(+12.2)#3,395 |
| 79. | Radford | 26.0% | 10.5%(+15.5)#79 | 13.7%(+12.3)#3,402 |
| 80. | Franconia | 27.8% | 10.5%(+17.4)#80 | 13.7%(+14.1)#3,569 |
| 81. | Hutchison | 29.3% | 10.5%(+18.9)#81 | 13.7%(+15.6)#3,698 |
| 82. | South Hill | 29.7% | 10.5%(+19.3)#82 | 13.7%(+16.0)#3,726 |
| 83. | Highland Springs | 30.9% | 10.5%(+20.4)#83 | 13.7%(+17.2)#3,845 |
| 84. | Hopewell | 32.9% | 10.5%(+22.5)#84 | 13.7%(+19.2)#3,981 |
| 85. | South Boston | 33.3% | 10.5%(+22.9)#85 | 13.7%(+19.6)#3,997 |
| 86. | Iron Gate | 33.3% | 10.5%(+22.9)#86 | 13.7%(+19.6)#4,095 |
| 87. | Alberta | 33.3% | 10.5%(+22.9)#87 | 13.7%(+19.6)#4,106 |
| 88. | Mount Jackson | 35.7% | 10.5%(+25.3)#88 | 13.7%(+22.0)#4,275 |
| 89. | Lakeside | 36.4% | 10.5%(+25.9)#89 | 13.7%(+22.7)#4,320 |
| 90. | Cape Charles | 37.5% | 10.5%(+27.0)#90 | 13.7%(+23.8)#4,409 |
| 91. | Keller | 37.5% | 10.5%(+27.0)#91 | 13.7%(+23.8)#4,421 |
| 92. | Brodnax | 38.0% | 10.5%(+27.5)#92 | 13.7%(+24.3)#4,444 |
| 93. | Martinsville | 38.8% | 10.5%(+28.3)#93 | 13.7%(+25.1)#4,484 |
| 94. | Bellwood | 38.9% | 10.5%(+28.4)#94 | 13.7%(+25.2)#4,489 |
| 95. | Bon Air | 41.5% | 10.5%(+31.0)#95 | 13.7%(+27.8)#4,672 |
| 96. | Dumbarton | 41.7% | 10.5%(+31.2)#96 | 13.7%(+28.0)#4,673 |
| 97. | Jonesville | 46.2% | 10.5%(+35.7)#97 | 13.7%(+32.4)#4,914 |
| 98. | Spotsylvania Courthouse | 46.4% | 10.5%(+36.0)#98 | 13.7%(+32.7)#4,929 |
| 99. | Broadway | 48.6% | 10.5%(+38.2)#99 | 13.7%(+34.9)#5,012 |
| 100. | Shenandoah Farms | 48.8% | 10.5%(+38.3)#100 | 13.7%(+35.1)#5,016 |
Common Questions
What are the Top 10 Cities with the Lowest Poverty Level Among Single Fathers in Virginia?
Top 10 Cities with the Lowest Poverty Level Among Single Fathers in Virginia are:
#1
0.76%
#2
2.0%
#3
2.4%
#4
2.5%
#5
2.7%
#6
2.7%
#7
3.8%
#8
4.5%
#9
4.7%
#10
4.9%
What city has the Lowest Poverty Level Among Single Fathers in Virginia?
Dulles Town Center has the Lowest Poverty Level Among Single Fathers in Virginia with 0.76%.
What is the Poverty Level Among Single Fathers in the State of Virginia?
Poverty Level Among Single Fathers in Virginia is 10.5%.
What is the Poverty Level Among Single Fathers in the United States?
Poverty Level Among Single Fathers in the United States is 13.7%.