Cities with the Lowest Poverty Level Among Single Fathers in Illinois
RELATED REPORTS & OPTIONS
Lowest Poverty | Single Father
Illinois
Compare Cities
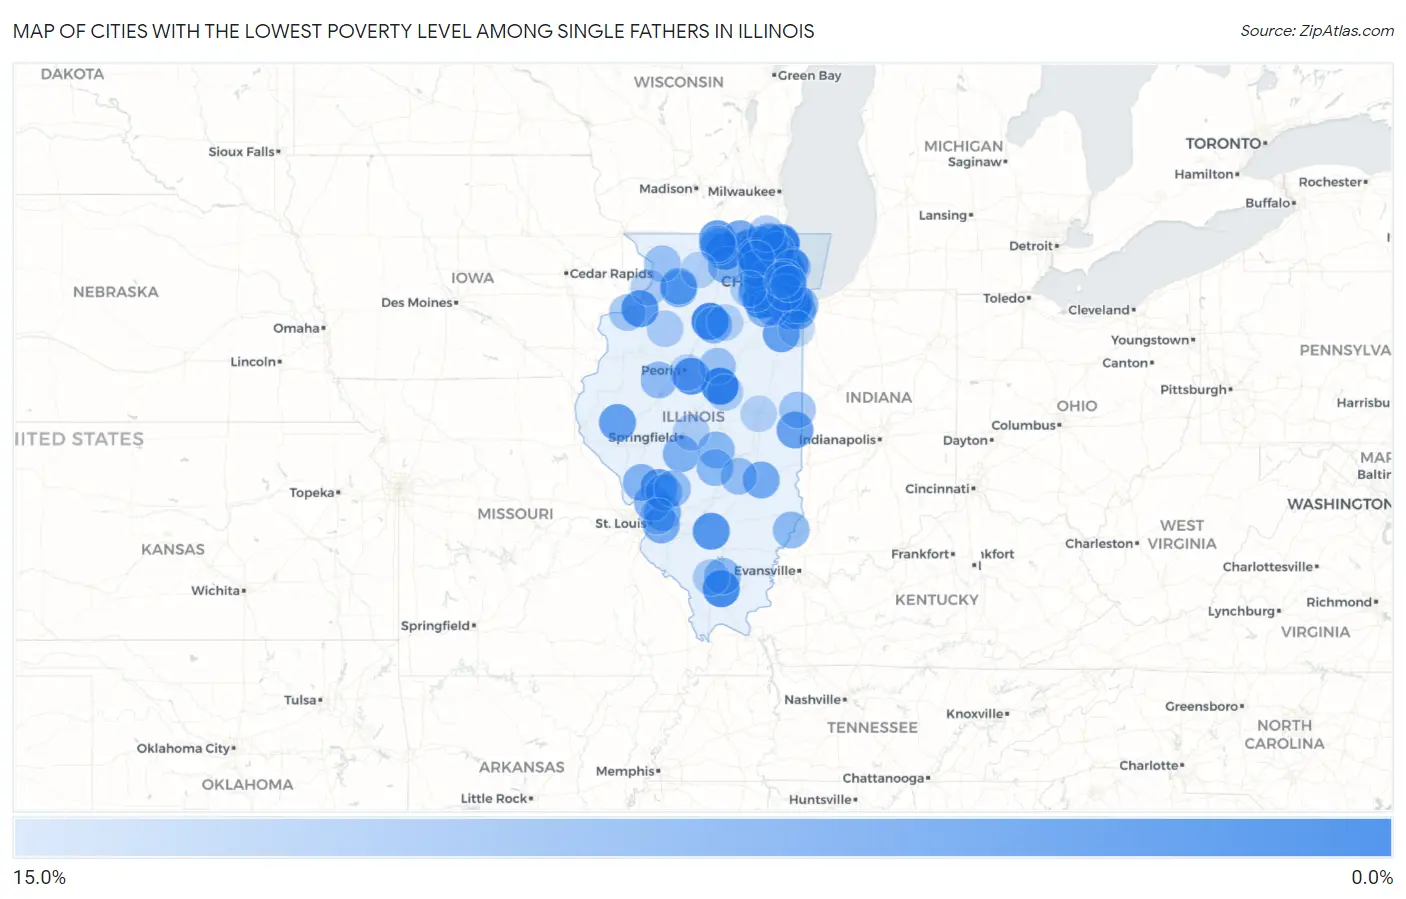
Map of Cities with the Lowest Poverty Level Among Single Fathers in Illinois
15.0%
0.0%
Cities with the Lowest Poverty Level Among Single Fathers in Illinois
| City | Single Father Poverty | vs State | vs National | |
| 1. | Bloomington | 1.1% | 13.4%(-12.3)#1 | 13.7%(-12.7)#20 |
| 2. | Carpentersville | 1.4% | 13.4%(-11.9)#2 | 13.7%(-12.3)#43 |
| 3. | Romeoville | 1.7% | 13.4%(-11.7)#3 | 13.7%(-12.0)#59 |
| 4. | Peru | 1.9% | 13.4%(-11.5)#4 | 13.7%(-11.9)#73 |
| 5. | Oak Forest | 1.9% | 13.4%(-11.5)#5 | 13.7%(-11.8)#77 |
| 6. | Bensenville | 2.0% | 13.4%(-11.4)#6 | 13.7%(-11.7)#81 |
| 7. | Plainfield | 2.3% | 13.4%(-11.0)#7 | 13.7%(-11.4)#117 |
| 8. | Marion | 2.5% | 13.4%(-10.9)#8 | 13.7%(-11.2)#136 |
| 9. | Bolingbrook | 2.6% | 13.4%(-10.8)#9 | 13.7%(-11.1)#145 |
| 10. | Belvidere | 2.7% | 13.4%(-10.7)#10 | 13.7%(-11.0)#156 |
| 11. | Oak Park | 3.5% | 13.4%(-9.89)#11 | 13.7%(-10.2)#244 |
| 12. | Crystal Lake | 3.6% | 13.4%(-9.82)#12 | 13.7%(-10.1)#250 |
| 13. | Woodstock | 3.8% | 13.4%(-9.54)#13 | 13.7%(-9.87)#289 |
| 14. | Lombard | 4.2% | 13.4%(-9.16)#14 | 13.7%(-9.49)#334 |
| 15. | Waukegan | 4.3% | 13.4%(-9.10)#15 | 13.7%(-9.42)#340 |
| 16. | East Moline | 4.3% | 13.4%(-9.10)#16 | 13.7%(-9.42)#341 |
| 17. | Centralia | 4.3% | 13.4%(-9.09)#17 | 13.7%(-9.41)#343 |
| 18. | Morton | 4.3% | 13.4%(-9.08)#18 | 13.7%(-9.40)#345 |
| 19. | Park Ridge | 4.4% | 13.4%(-8.95)#19 | 13.7%(-9.27)#364 |
| 20. | Niles | 4.5% | 13.4%(-8.87)#20 | 13.7%(-9.20)#375 |
| 21. | Hazel Crest | 4.8% | 13.4%(-8.63)#21 | 13.7%(-8.95)#406 |
| 22. | Woodridge | 4.9% | 13.4%(-8.51)#22 | 13.7%(-8.83)#423 |
| 23. | Melrose Park | 4.9% | 13.4%(-8.47)#23 | 13.7%(-8.80)#429 |
| 24. | Lisle | 5.0% | 13.4%(-8.39)#24 | 13.7%(-8.71)#442 |
| 25. | Westmont | 5.1% | 13.4%(-8.31)#25 | 13.7%(-8.63)#451 |
| 26. | Mchenry | 5.3% | 13.4%(-8.11)#26 | 13.7%(-8.43)#471 |
| 27. | Shipman | 5.6% | 13.4%(-7.83)#27 | 13.7%(-8.16)#519 |
| 28. | Roscoe | 5.7% | 13.4%(-7.73)#28 | 13.7%(-8.05)#528 |
| 29. | Bourbonnais | 5.7% | 13.4%(-7.68)#29 | 13.7%(-8.00)#532 |
| 30. | Park City | 5.8% | 13.4%(-7.61)#30 | 13.7%(-7.93)#544 |
| 31. | Mount Sterling | 5.8% | 13.4%(-7.59)#31 | 13.7%(-7.92)#549 |
| 32. | Wilmette | 6.1% | 13.4%(-7.29)#32 | 13.7%(-7.61)#586 |
| 33. | Ridge Farm | 6.2% | 13.4%(-7.14)#33 | 13.7%(-7.46)#612 |
| 34. | Buffalo Grove | 6.6% | 13.4%(-6.79)#34 | 13.7%(-7.11)#657 |
| 35. | Richton Park | 6.8% | 13.4%(-6.63)#35 | 13.7%(-6.96)#682 |
| 36. | Naperville | 7.0% | 13.4%(-6.41)#36 | 13.7%(-6.74)#712 |
| 37. | Harvard | 7.1% | 13.4%(-6.25)#37 | 13.7%(-6.57)#736 |
| 38. | West Chicago | 7.2% | 13.4%(-6.21)#38 | 13.7%(-6.54)#745 |
| 39. | Elmhurst | 7.3% | 13.4%(-6.12)#39 | 13.7%(-6.44)#761 |
| 40. | Steger | 7.3% | 13.4%(-6.05)#40 | 13.7%(-6.37)#777 |
| 41. | Lake In The Hills | 7.3% | 13.4%(-6.04)#41 | 13.7%(-6.37)#778 |
| 42. | Harvey | 7.6% | 13.4%(-5.80)#42 | 13.7%(-6.13)#813 |
| 43. | Glen Carbon | 7.6% | 13.4%(-5.80)#43 | 13.7%(-6.13)#814 |
| 44. | Jewett | 7.7% | 13.4%(-5.70)#44 | 13.7%(-6.02)#849 |
| 45. | Glendale Heights | 8.0% | 13.4%(-5.35)#45 | 13.7%(-5.67)#913 |
| 46. | Fairview Heights | 8.1% | 13.4%(-5.27)#46 | 13.7%(-5.59)#924 |
| 47. | Homewood | 8.2% | 13.4%(-5.17)#47 | 13.7%(-5.49)#935 |
| 48. | Rock Falls | 8.6% | 13.4%(-4.84)#48 | 13.7%(-5.16)#985 |
| 49. | Kirkland | 8.6% | 13.4%(-4.82)#49 | 13.7%(-5.14)#994 |
| 50. | Northlake | 8.7% | 13.4%(-4.73)#50 | 13.7%(-5.05)#1,013 |
| 51. | Divernon | 8.7% | 13.4%(-4.69)#51 | 13.7%(-5.02)#1,019 |
| 52. | Alton | 8.8% | 13.4%(-4.61)#52 | 13.7%(-4.93)#1,031 |
| 53. | Oak Lawn | 8.9% | 13.4%(-4.48)#53 | 13.7%(-4.81)#1,050 |
| 54. | Kane | 9.1% | 13.4%(-4.30)#54 | 13.7%(-4.62)#1,093 |
| 55. | Carol Stream | 9.3% | 13.4%(-4.09)#55 | 13.7%(-4.41)#1,112 |
| 56. | Sterling | 9.3% | 13.4%(-4.06)#56 | 13.7%(-4.38)#1,117 |
| 57. | Oglesby | 9.4% | 13.4%(-4.02)#57 | 13.7%(-4.34)#1,120 |
| 58. | Berwyn | 9.4% | 13.4%(-3.96)#58 | 13.7%(-4.28)#1,129 |
| 59. | Moweaqua | 9.8% | 13.4%(-3.59)#59 | 13.7%(-3.91)#1,190 |
| 60. | Aurora | 9.9% | 13.4%(-3.46)#60 | 13.7%(-3.78)#1,203 |
| 61. | Joliet | 10.0% | 13.4%(-3.42)#61 | 13.7%(-3.74)#1,207 |
| 62. | Bunker Hill | 10.0% | 13.4%(-3.39)#62 | 13.7%(-3.71)#1,221 |
| 63. | Allendale | 10.0% | 13.4%(-3.39)#63 | 13.7%(-3.71)#1,229 |
| 64. | Pana | 10.1% | 13.4%(-3.31)#64 | 13.7%(-3.63)#1,243 |
| 65. | West Frankfort | 10.1% | 13.4%(-3.26)#65 | 13.7%(-3.59)#1,248 |
| 66. | Round Lake Heights | 10.3% | 13.4%(-3.13)#66 | 13.7%(-3.46)#1,268 |
| 67. | Canton | 10.5% | 13.4%(-2.93)#67 | 13.7%(-3.25)#1,290 |
| 68. | Elgin | 10.6% | 13.4%(-2.80)#68 | 13.7%(-3.12)#1,317 |
| 69. | Libertyville | 10.8% | 13.4%(-2.58)#69 | 13.7%(-2.90)#1,353 |
| 70. | Lansing | 10.9% | 13.4%(-2.52)#70 | 13.7%(-2.84)#1,367 |
| 71. | Round Lake Beach | 11.0% | 13.4%(-2.41)#71 | 13.7%(-2.73)#1,383 |
| 72. | Benld | 11.1% | 13.4%(-2.28)#72 | 13.7%(-2.60)#1,414 |
| 73. | Stewardson | 11.1% | 13.4%(-2.28)#73 | 13.7%(-2.60)#1,421 |
| 74. | Loves Park | 11.2% | 13.4%(-2.16)#74 | 13.7%(-2.48)#1,437 |
| 75. | El Paso | 11.6% | 13.4%(-1.76)#75 | 13.7%(-2.08)#1,484 |
| 76. | Mount Carroll | 11.8% | 13.4%(-1.63)#76 | 13.7%(-1.95)#1,497 |
| 77. | Evanston | 12.0% | 13.4%(-1.40)#77 | 13.7%(-1.72)#1,531 |
| 78. | Elmwood Park | 12.0% | 13.4%(-1.39)#78 | 13.7%(-1.71)#1,533 |
| 79. | Danville | 12.0% | 13.4%(-1.38)#79 | 13.7%(-1.70)#1,541 |
| 80. | Machesney Park | 12.1% | 13.4%(-1.31)#80 | 13.7%(-1.63)#1,550 |
| 81. | Ingalls Park | 12.1% | 13.4%(-1.30)#81 | 13.7%(-1.62)#1,552 |
| 82. | Rock Island | 12.1% | 13.4%(-1.25)#82 | 13.7%(-1.57)#1,557 |
| 83. | Channel Lake | 12.8% | 13.4%(-0.624)#83 | 13.7%(-0.946)#1,668 |
| 84. | Boulder Hill | 12.8% | 13.4%(-0.546)#84 | 13.7%(-0.868)#1,682 |
| 85. | Royalton | 13.0% | 13.4%(-0.347)#85 | 13.7%(-0.669)#1,710 |
| 86. | Algonquin | 13.3% | 13.4%(-0.129)#86 | 13.7%(-0.452)#1,741 |
| 87. | Hickory Hills | 13.3% | 13.4%(-0.057)#87 | 13.7%(-0.379)#1,748 |
| 88. | Kewanee | 13.3% | 13.4%(-0.057)#88 | 13.7%(-0.379)#1,749 |
| 89. | Downs | 13.3% | 13.4%(-0.057)#89 | 13.7%(-0.379)#1,758 |
| 90. | Albany | 13.3% | 13.4%(-0.057)#90 | 13.7%(-0.379)#1,762 |
| 91. | Dawson | 13.3% | 13.4%(-0.057)#91 | 13.7%(-0.379)#1,763 |
| 92. | Sugar Grove | 13.6% | 13.4%(+0.169)#92 | 13.7%(-0.153)#1,785 |
| 93. | Bellwood | 13.7% | 13.4%(+0.335)#93 | 13.7%(+0.013)#1,822 |
| 94. | Oregon | 13.9% | 13.4%(+0.534)#94 | 13.7%(+0.212)#1,853 |
| 95. | Pontoon Beach | 14.2% | 13.4%(+0.761)#95 | 13.7%(+0.439)#1,877 |
| 96. | East Peoria | 14.2% | 13.4%(+0.834)#96 | 13.7%(+0.512)#1,883 |
| 97. | Champaign | 14.3% | 13.4%(+0.896)#97 | 13.7%(+0.573)#1,891 |
| 98. | Naplate | 14.3% | 13.4%(+0.896)#98 | 13.7%(+0.573)#1,925 |
| 99. | Cicero | 14.5% | 13.4%(+1.09)#99 | 13.7%(+0.772)#1,947 |
| 100. | Grant Park | 14.6% | 13.4%(+1.24)#100 | 13.7%(+0.922)#1,972 |
Common Questions
What are the Top 10 Cities with the Lowest Poverty Level Among Single Fathers in Illinois?
Top 10 Cities with the Lowest Poverty Level Among Single Fathers in Illinois are:
#1
1.1%
#2
1.4%
#3
1.7%
#4
1.9%
#5
1.9%
#6
2.0%
#7
2.3%
#8
2.5%
#9
2.6%
#10
2.7%
What city has the Lowest Poverty Level Among Single Fathers in Illinois?
Bloomington has the Lowest Poverty Level Among Single Fathers in Illinois with 1.1%.
What is the Poverty Level Among Single Fathers in the State of Illinois?
Poverty Level Among Single Fathers in Illinois is 13.4%.
What is the Poverty Level Among Single Fathers in the United States?
Poverty Level Among Single Fathers in the United States is 13.7%.