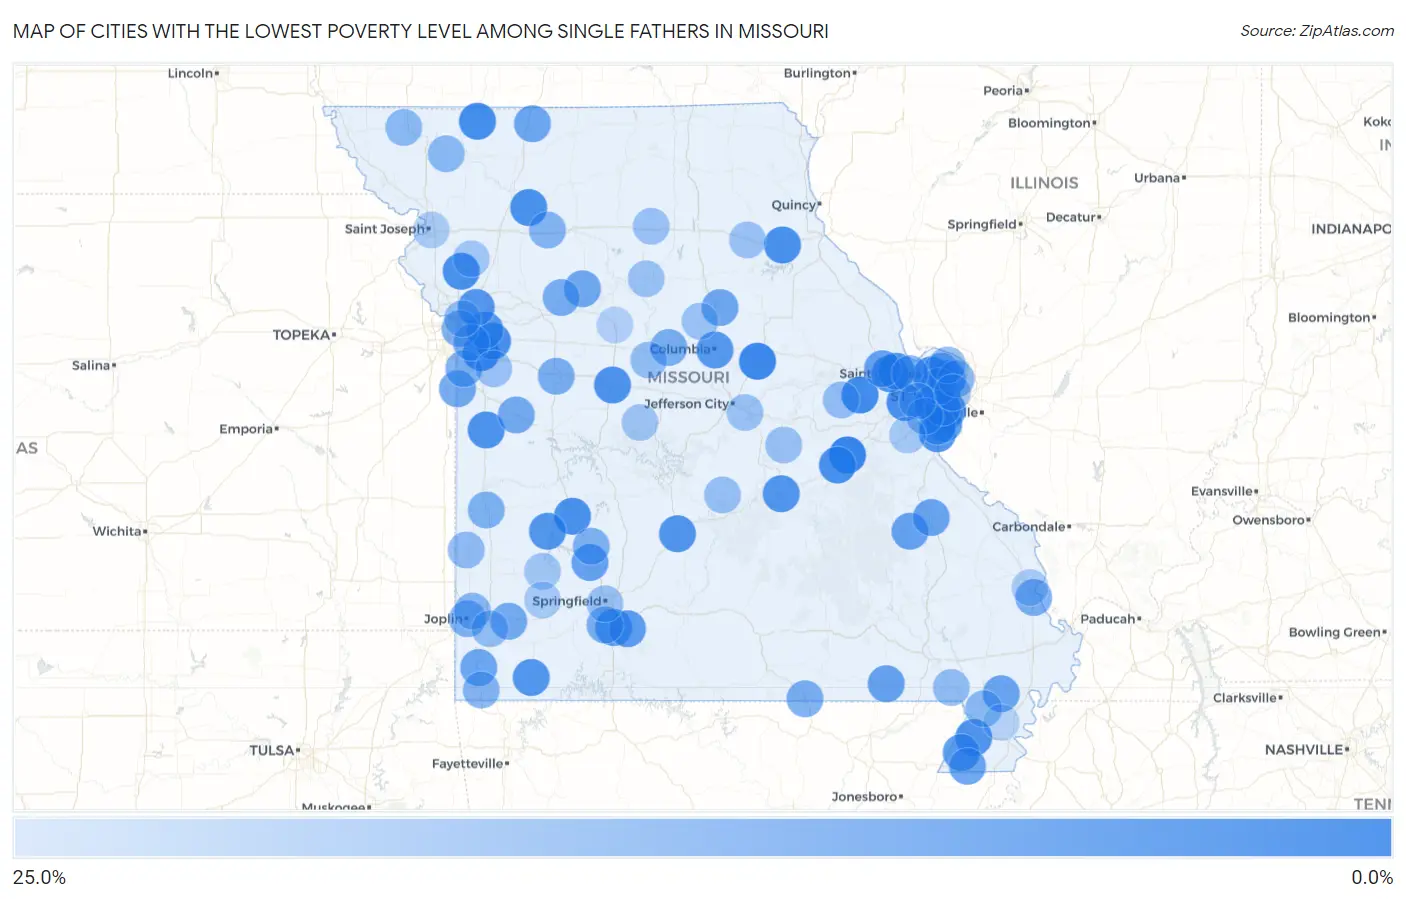
Cities with the Lowest Poverty Level Among Single Fathers in Missouri
RELATED REPORTS & OPTIONS
Lowest Poverty | Single Father
Missouri
Compare Cities
Map of Cities with the Lowest Poverty Level Among Single Fathers in Missouri
25.0%
0.0%
Cities with the Lowest Poverty Level Among Single Fathers in Missouri
| City | Single Father Poverty | vs State | vs National | |
| 1. | Sullivan | 1.3% | 13.8%(-12.5)#1 | 13.7%(-12.4)#32 |
| 2. | Fulton | 2.2% | 13.8%(-11.7)#2 | 13.7%(-11.6)#98 |
| 3. | Lee S Summit | 3.0% | 13.8%(-10.9)#3 | 13.7%(-10.8)#185 |
| 4. | Marthasville | 3.2% | 13.8%(-10.6)#4 | 13.7%(-10.5)#216 |
| 5. | Grant City | 3.7% | 13.8%(-10.1)#5 | 13.7%(-10.0)#273 |
| 6. | Bridgeton | 4.1% | 13.8%(-9.76)#6 | 13.7%(-9.64)#312 |
| 7. | Blue Springs | 4.3% | 13.8%(-9.56)#7 | 13.7%(-9.44)#339 |
| 8. | Trimble | 4.3% | 13.8%(-9.49)#8 | 13.7%(-9.36)#351 |
| 9. | Wildwood | 4.4% | 13.8%(-9.45)#9 | 13.7%(-9.32)#357 |
| 10. | Kirkwood | 4.4% | 13.8%(-9.42)#10 | 13.7%(-9.30)#359 |
| 11. | Humansville | 4.4% | 13.8%(-9.42)#11 | 13.7%(-9.30)#360 |
| 12. | Bourbon | 4.8% | 13.8%(-9.07)#12 | 13.7%(-8.95)#408 |
| 13. | Gallatin | 4.8% | 13.8%(-9.07)#13 | 13.7%(-8.95)#409 |
| 14. | Monroe City | 4.9% | 13.8%(-8.92)#14 | 13.7%(-8.79)#431 |
| 15. | Adrian | 5.1% | 13.8%(-8.75)#15 | 13.7%(-8.63)#452 |
| 16. | Sedalia | 5.1% | 13.8%(-8.71)#16 | 13.7%(-8.58)#458 |
| 17. | Lake St Louis | 5.2% | 13.8%(-8.64)#17 | 13.7%(-8.52)#467 |
| 18. | Ferguson | 5.3% | 13.8%(-8.52)#18 | 13.7%(-8.40)#474 |
| 19. | O Fallon | 5.4% | 13.8%(-8.44)#19 | 13.7%(-8.31)#490 |
| 20. | Mehlville | 5.6% | 13.8%(-8.26)#20 | 13.7%(-8.14)#521 |
| 21. | Kennett | 5.8% | 13.8%(-8.08)#21 | 13.7%(-7.95)#542 |
| 22. | Imperial | 5.8% | 13.8%(-8.07)#22 | 13.7%(-7.94)#543 |
| 23. | Rolla | 6.1% | 13.8%(-7.71)#23 | 13.7%(-7.58)#590 |
| 24. | Lebanon | 6.2% | 13.8%(-7.66)#24 | 13.7%(-7.54)#596 |
| 25. | Lemay | 6.2% | 13.8%(-7.61)#25 | 13.7%(-7.49)#604 |
| 26. | Stockton | 6.2% | 13.8%(-7.59)#26 | 13.7%(-7.46)#611 |
| 27. | Exeter | 6.5% | 13.8%(-7.38)#27 | 13.7%(-7.26)#639 |
| 28. | Independence | 6.5% | 13.8%(-7.31)#28 | 13.7%(-7.19)#648 |
| 29. | Liberty | 6.9% | 13.8%(-6.90)#29 | 13.7%(-6.78)#708 |
| 30. | Columbia | 7.2% | 13.8%(-6.60)#30 | 13.7%(-6.47)#755 |
| 31. | Ozark | 7.5% | 13.8%(-6.36)#31 | 13.7%(-6.24)#802 |
| 32. | Sparta | 7.9% | 13.8%(-5.94)#32 | 13.7%(-5.82)#892 |
| 33. | Oakville | 8.0% | 13.8%(-5.82)#33 | 13.7%(-5.70)#908 |
| 34. | Senath | 8.3% | 13.8%(-5.50)#34 | 13.7%(-5.38)#950 |
| 35. | Arnold | 9.3% | 13.8%(-4.58)#35 | 13.7%(-4.46)#1,109 |
| 36. | Morrisville | 9.5% | 13.8%(-4.31)#36 | 13.7%(-4.19)#1,147 |
| 37. | Iron Mountain Lake | 9.7% | 13.8%(-4.16)#37 | 13.7%(-4.03)#1,169 |
| 38. | Wentzville | 9.8% | 13.8%(-4.08)#38 | 13.7%(-3.96)#1,179 |
| 39. | Doniphan | 10.0% | 13.8%(-3.84)#39 | 13.7%(-3.71)#1,215 |
| 40. | Farmington | 10.3% | 13.8%(-3.51)#40 | 13.7%(-3.38)#1,277 |
| 41. | Hornersville | 10.5% | 13.8%(-3.31)#41 | 13.7%(-3.19)#1,309 |
| 42. | Risco | 10.5% | 13.8%(-3.31)#42 | 13.7%(-3.19)#1,310 |
| 43. | Goodman | 11.1% | 13.8%(-2.72)#43 | 13.7%(-2.60)#1,418 |
| 44. | Blythedale | 11.1% | 13.8%(-2.72)#44 | 13.7%(-2.60)#1,426 |
| 45. | Cleveland | 11.5% | 13.8%(-2.36)#45 | 13.7%(-2.24)#1,464 |
| 46. | Carrollton | 11.7% | 13.8%(-2.15)#46 | 13.7%(-2.02)#1,489 |
| 47. | Sturgeon | 11.8% | 13.8%(-2.07)#47 | 13.7%(-1.95)#1,501 |
| 48. | Affton | 12.0% | 13.8%(-1.85)#48 | 13.7%(-1.73)#1,529 |
| 49. | Florissant | 12.4% | 13.8%(-1.40)#49 | 13.7%(-1.28)#1,606 |
| 50. | Sarcoxie | 12.5% | 13.8%(-1.34)#50 | 13.7%(-1.21)#1,624 |
| 51. | Creighton | 12.5% | 13.8%(-1.34)#51 | 13.7%(-1.21)#1,643 |
| 52. | Kansas City | 13.0% | 13.8%(-0.855)#52 | 13.7%(-0.731)#1,697 |
| 53. | Scott City | 13.0% | 13.8%(-0.793)#53 | 13.7%(-0.669)#1,708 |
| 54. | Norborne | 13.0% | 13.8%(-0.793)#54 | 13.7%(-0.669)#1,712 |
| 55. | Warrensburg | 13.4% | 13.8%(-0.476)#55 | 13.7%(-0.352)#1,767 |
| 56. | Boonville | 13.5% | 13.8%(-0.294)#56 | 13.7%(-0.171)#1,782 |
| 57. | Thayer | 13.6% | 13.8%(-0.200)#57 | 13.7%(-0.076)#1,803 |
| 58. | Nixa | 13.7% | 13.8%(-0.161)#58 | 13.7%(-0.037)#1,813 |
| 59. | Belton | 14.1% | 13.8%(+0.240)#59 | 13.7%(+0.363)#1,871 |
| 60. | Overland | 14.1% | 13.8%(+0.248)#60 | 13.7%(+0.372)#1,872 |
| 61. | Bolivar | 14.4% | 13.8%(+0.597)#61 | 13.7%(+0.721)#1,939 |
| 62. | Joplin | 14.5% | 13.8%(+0.641)#62 | 13.7%(+0.765)#1,946 |
| 63. | Nevada | 14.5% | 13.8%(+0.694)#63 | 13.7%(+0.818)#1,958 |
| 64. | St Peters | 14.6% | 13.8%(+0.756)#64 | 13.7%(+0.880)#1,966 |
| 65. | Pineville | 15.4% | 13.8%(+1.55)#65 | 13.7%(+1.67)#2,072 |
| 66. | Breckenridge | 15.6% | 13.8%(+1.79)#66 | 13.7%(+1.91)#2,099 |
| 67. | Raytown | 16.0% | 13.8%(+2.16)#67 | 13.7%(+2.29)#2,153 |
| 68. | Murphy | 16.1% | 13.8%(+2.29)#68 | 13.7%(+2.42)#2,169 |
| 69. | Riverview | 16.3% | 13.8%(+2.49)#69 | 13.7%(+2.61)#2,195 |
| 70. | Webb City | 16.5% | 13.8%(+2.64)#70 | 13.7%(+2.76)#2,210 |
| 71. | Clarkton | 16.7% | 13.8%(+2.83)#71 | 13.7%(+2.95)#2,265 |
| 72. | Burlington Junction | 16.7% | 13.8%(+2.83)#72 | 13.7%(+2.95)#2,278 |
| 73. | Conception Junction | 16.7% | 13.8%(+2.83)#73 | 13.7%(+2.95)#2,290 |
| 74. | Liberal | 17.4% | 13.8%(+3.56)#74 | 13.7%(+3.68)#2,368 |
| 75. | Old Jamestown | 18.0% | 13.8%(+4.16)#75 | 13.7%(+4.29)#2,438 |
| 76. | Diamond | 18.2% | 13.8%(+4.35)#76 | 13.7%(+4.47)#2,472 |
| 77. | Qulin | 18.2% | 13.8%(+4.35)#77 | 13.7%(+4.47)#2,475 |
| 78. | Pilot Grove | 18.2% | 13.8%(+4.35)#78 | 13.7%(+4.47)#2,476 |
| 79. | Avondale | 18.2% | 13.8%(+4.35)#79 | 13.7%(+4.47)#2,480 |
| 80. | New Haven | 18.4% | 13.8%(+4.53)#80 | 13.7%(+4.65)#2,501 |
| 81. | Ballwin | 19.0% | 13.8%(+5.21)#81 | 13.7%(+5.34)#2,578 |
| 82. | Crocker | 19.2% | 13.8%(+5.39)#82 | 13.7%(+5.52)#2,613 |
| 83. | Pleasant Hill | 19.4% | 13.8%(+5.52)#83 | 13.7%(+5.64)#2,622 |
| 84. | Belle | 19.4% | 13.8%(+5.61)#84 | 13.7%(+5.73)#2,630 |
| 85. | St Louis | 19.5% | 13.8%(+5.68)#85 | 13.7%(+5.81)#2,645 |
| 86. | Springfield | 19.9% | 13.8%(+6.04)#86 | 13.7%(+6.17)#2,682 |
| 87. | Shelbina | 20.0% | 13.8%(+6.16)#87 | 13.7%(+6.29)#2,708 |
| 88. | Taos | 20.0% | 13.8%(+6.16)#88 | 13.7%(+6.29)#2,719 |
| 89. | Bucklin | 20.0% | 13.8%(+6.16)#89 | 13.7%(+6.29)#2,754 |
| 90. | Keytesville | 20.0% | 13.8%(+6.16)#90 | 13.7%(+6.29)#2,756 |
| 91. | Harrisburg | 20.0% | 13.8%(+6.16)#91 | 13.7%(+6.29)#2,757 |
| 92. | Stover | 20.8% | 13.8%(+7.00)#92 | 13.7%(+7.12)#2,847 |
| 93. | Plattsburg | 21.1% | 13.8%(+7.22)#93 | 13.7%(+7.34)#2,863 |
| 94. | Greenfield | 21.1% | 13.8%(+7.22)#94 | 13.7%(+7.34)#2,867 |
| 95. | Cedar Hill | 22.0% | 13.8%(+8.16)#95 | 13.7%(+8.29)#2,979 |
| 96. | Miller | 22.2% | 13.8%(+8.39)#96 | 13.7%(+8.51)#3,012 |
| 97. | Cape Girardeau | 22.4% | 13.8%(+8.60)#97 | 13.7%(+8.73)#3,041 |
| 98. | St Joseph | 23.1% | 13.8%(+9.31)#98 | 13.7%(+9.43)#3,117 |
| 99. | Marshall | 24.2% | 13.8%(+10.4)#99 | 13.7%(+10.5)#3,217 |
| 100. | Wardell | 25.0% | 13.8%(+11.2)#100 | 13.7%(+11.3)#3,313 |
Common Questions
What are the Top 10 Cities with the Lowest Poverty Level Among Single Fathers in Missouri?
Top 10 Cities with the Lowest Poverty Level Among Single Fathers in Missouri are:
#1
1.3%
#2
2.2%
#3
3.0%
#4
3.2%
#5
3.7%
#6
4.1%
#7
4.3%
#8
4.3%
#9
4.4%
#10
4.4%
What city has the Lowest Poverty Level Among Single Fathers in Missouri?
Sullivan has the Lowest Poverty Level Among Single Fathers in Missouri with 1.3%.
What is the Poverty Level Among Single Fathers in the State of Missouri?
Poverty Level Among Single Fathers in Missouri is 13.8%.
What is the Poverty Level Among Single Fathers in the United States?
Poverty Level Among Single Fathers in the United States is 13.7%.