Cities with the Highest Percentage of Population Employed in Cleaning & Maintenance in South Carolina
RELATED REPORTS & OPTIONS
Cleaning & Maintenance
South Carolina
Compare Cities
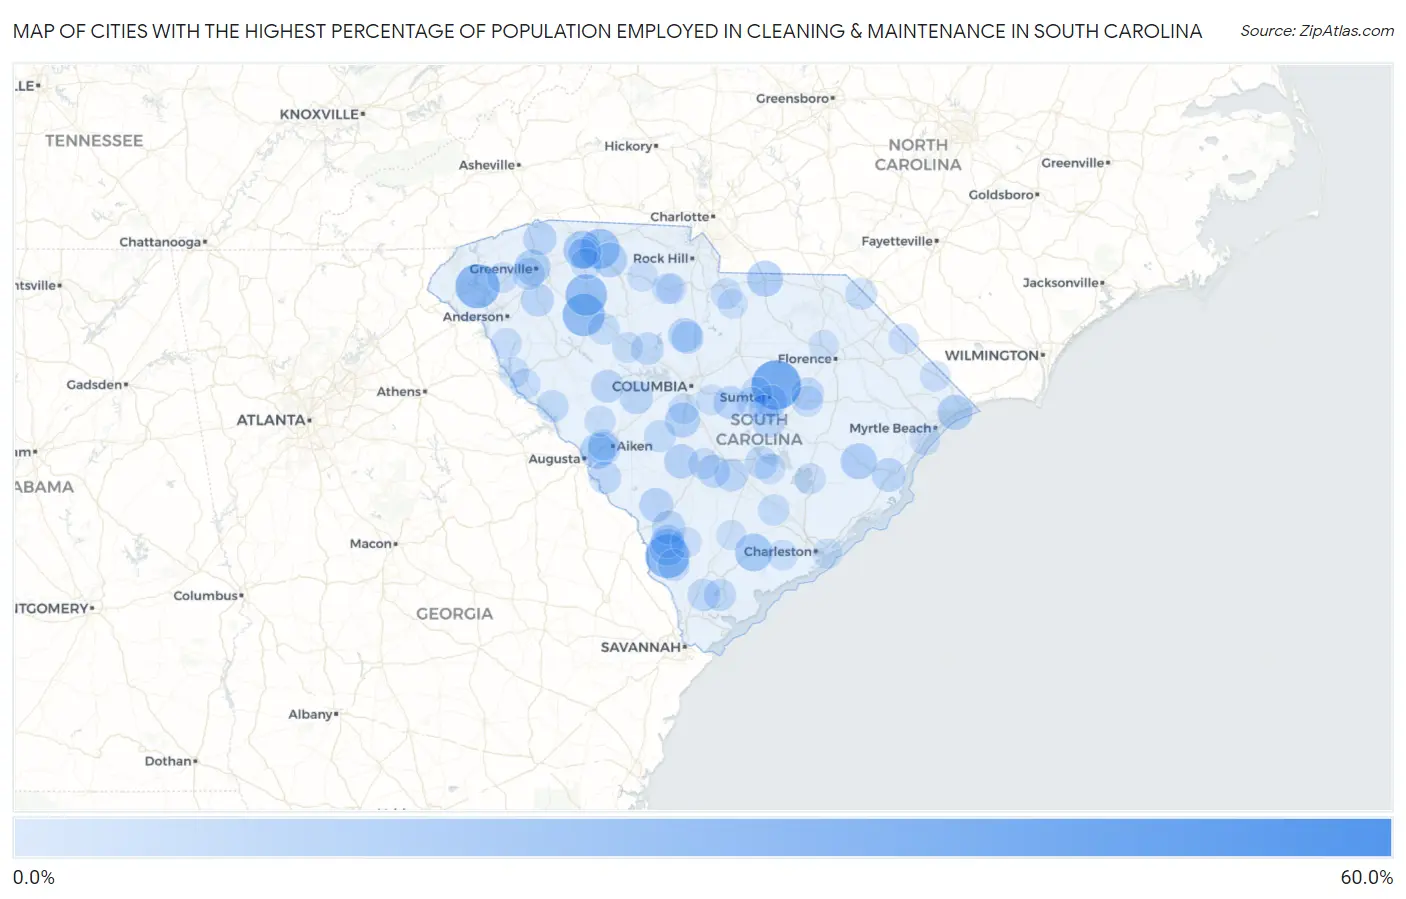
Map of Cities with the Highest Percentage of Population Employed in Cleaning & Maintenance in South Carolina
0.0%
60.0%
Cities with the Highest Percentage of Population Employed in Cleaning & Maintenance in South Carolina
| City | % Employed | vs State | vs National | |
| 1. | Abney Crossroads | 57.1% | 3.9%(+53.3)#1 | 3.5%(+53.7)#64 |
| 2. | Pauline | 49.6% | 3.9%(+45.7)#2 | 3.5%(+46.1)#93 |
| 3. | Oswego | 40.6% | 3.9%(+36.7)#3 | 3.5%(+37.1)#140 |
| 4. | Glenn Springs | 31.7% | 3.9%(+27.9)#4 | 3.5%(+28.3)#241 |
| 5. | Newry | 31.2% | 3.9%(+27.4)#5 | 3.5%(+27.8)#248 |
| 6. | Estill | 30.7% | 3.9%(+26.8)#6 | 3.5%(+27.2)#254 |
| 7. | The Cliffs Valley | 30.5% | 3.9%(+26.6)#7 | 3.5%(+27.0)#259 |
| 8. | Watts Mills | 27.9% | 3.9%(+24.1)#8 | 3.5%(+24.5)#312 |
| 9. | Enoree | 26.6% | 3.9%(+22.8)#9 | 3.5%(+23.2)#344 |
| 10. | Hamer | 23.8% | 3.9%(+20.0)#10 | 3.5%(+20.3)#434 |
| 11. | Converse | 23.6% | 3.9%(+19.7)#11 | 3.5%(+20.1)#443 |
| 12. | Southern Shops | 21.1% | 3.9%(+17.2)#12 | 3.5%(+17.6)#562 |
| 13. | Wisacky | 21.0% | 3.9%(+17.1)#13 | 3.5%(+17.5)#570 |
| 14. | Jacksonboro | 20.0% | 3.9%(+16.1)#14 | 3.5%(+16.5)#625 |
| 15. | La France | 18.6% | 3.9%(+14.8)#15 | 3.5%(+15.1)#729 |
| 16. | Luray | 18.3% | 3.9%(+14.4)#16 | 3.5%(+14.8)#754 |
| 17. | Andrews | 17.3% | 3.9%(+13.5)#17 | 3.5%(+13.8)#841 |
| 18. | Pageland | 17.2% | 3.9%(+13.3)#18 | 3.5%(+13.7)#854 |
| 19. | City View | 17.0% | 3.9%(+13.1)#19 | 3.5%(+13.5)#883 |
| 20. | Fairview Crossroads | 16.6% | 3.9%(+12.7)#20 | 3.5%(+13.1)#920 |
| 21. | Burnettown | 16.2% | 3.9%(+12.4)#21 | 3.5%(+12.8)#961 |
| 22. | Manville | 16.2% | 3.9%(+12.3)#22 | 3.5%(+12.7)#969 |
| 23. | Atlantic Beach | 15.7% | 3.9%(+11.8)#23 | 3.5%(+12.2)#1,016 |
| 24. | Swansea | 15.5% | 3.9%(+11.6)#24 | 3.5%(+12.0)#1,046 |
| 25. | Central Pacolet | 15.4% | 3.9%(+11.5)#25 | 3.5%(+11.9)#1,059 |
| 26. | Norway | 14.5% | 3.9%(+10.6)#26 | 3.5%(+11.0)#1,208 |
| 27. | Kline | 14.3% | 3.9%(+10.4)#27 | 3.5%(+10.8)#1,239 |
| 28. | Winnsboro | 13.9% | 3.9%(+10.0)#28 | 3.5%(+10.4)#1,330 |
| 29. | Fairfax | 13.7% | 3.9%(+9.79)#29 | 3.5%(+10.2)#1,372 |
| 30. | Arkwright | 13.6% | 3.9%(+9.73)#30 | 3.5%(+10.1)#1,389 |
| 31. | Georgetown | 13.5% | 3.9%(+9.67)#31 | 3.5%(+10.1)#1,402 |
| 32. | East Camden | 13.2% | 3.9%(+9.37)#32 | 3.5%(+9.75)#1,471 |
| 33. | Drayton | 13.1% | 3.9%(+9.23)#33 | 3.5%(+9.62)#1,506 |
| 34. | Batesburg Leesville | 13.0% | 3.9%(+9.12)#34 | 3.5%(+9.50)#1,549 |
| 35. | Tigerville | 12.9% | 3.9%(+9.01)#35 | 3.5%(+9.40)#1,579 |
| 36. | Gifford | 12.8% | 3.9%(+8.92)#36 | 3.5%(+9.31)#1,614 |
| 37. | Warrenville | 12.8% | 3.9%(+8.90)#37 | 3.5%(+9.28)#1,620 |
| 38. | Seabrook | 12.6% | 3.9%(+8.72)#38 | 3.5%(+9.10)#1,668 |
| 39. | Eastover | 12.4% | 3.9%(+8.57)#39 | 3.5%(+8.96)#1,717 |
| 40. | Paxville | 12.4% | 3.9%(+8.48)#40 | 3.5%(+8.87)#1,746 |
| 41. | Bowman | 12.2% | 3.9%(+8.38)#41 | 3.5%(+8.76)#1,774 |
| 42. | Ware Place | 12.2% | 3.9%(+8.38)#42 | 3.5%(+8.76)#1,776 |
| 43. | Rowesville | 12.2% | 3.9%(+8.29)#43 | 3.5%(+8.68)#1,804 |
| 44. | Saluda | 12.1% | 3.9%(+8.20)#44 | 3.5%(+8.59)#1,828 |
| 45. | Shiloh | 11.9% | 3.9%(+8.04)#45 | 3.5%(+8.42)#1,893 |
| 46. | Winnsboro Mills | 11.9% | 3.9%(+8.03)#46 | 3.5%(+8.42)#1,897 |
| 47. | Vance | 11.8% | 3.9%(+7.90)#47 | 3.5%(+8.28)#1,930 |
| 48. | Pomaria | 11.6% | 3.9%(+7.76)#48 | 3.5%(+8.15)#1,971 |
| 49. | Ridgeland | 11.6% | 3.9%(+7.75)#49 | 3.5%(+8.14)#1,972 |
| 50. | Lobeco | 11.5% | 3.9%(+7.64)#50 | 3.5%(+8.02)#2,009 |
| 51. | Jackson | 11.4% | 3.9%(+7.54)#51 | 3.5%(+7.92)#2,046 |
| 52. | Welcome | 11.3% | 3.9%(+7.41)#52 | 3.5%(+7.79)#2,104 |
| 53. | Laurel Bay | 11.2% | 3.9%(+7.35)#53 | 3.5%(+7.73)#2,124 |
| 54. | South Sumter | 11.2% | 3.9%(+7.33)#54 | 3.5%(+7.71)#2,133 |
| 55. | Plum Branch | 11.1% | 3.9%(+7.24)#55 | 3.5%(+7.63)#2,173 |
| 56. | Perry | 10.6% | 3.9%(+6.75)#56 | 3.5%(+7.14)#2,352 |
| 57. | Furman | 10.6% | 3.9%(+6.73)#57 | 3.5%(+7.12)#2,360 |
| 58. | Mccoll | 10.3% | 3.9%(+6.44)#58 | 3.5%(+6.83)#2,480 |
| 59. | Joanna | 10.2% | 3.9%(+6.34)#59 | 3.5%(+6.72)#2,521 |
| 60. | Homewood | 10.1% | 3.9%(+6.27)#60 | 3.5%(+6.65)#2,554 |
| 61. | Saxon | 10.1% | 3.9%(+6.24)#61 | 3.5%(+6.63)#2,565 |
| 62. | Ridgeville | 9.9% | 3.9%(+6.07)#62 | 3.5%(+6.46)#2,663 |
| 63. | Sandy Springs | 9.9% | 3.9%(+6.04)#63 | 3.5%(+6.42)#2,687 |
| 64. | Cherryvale | 9.5% | 3.9%(+5.68)#64 | 3.5%(+6.06)#2,871 |
| 65. | Cordova | 9.5% | 3.9%(+5.66)#65 | 3.5%(+6.04)#2,878 |
| 66. | Graniteville | 9.5% | 3.9%(+5.63)#66 | 3.5%(+6.02)#2,893 |
| 67. | Bonneau Beach | 9.4% | 3.9%(+5.56)#67 | 3.5%(+5.94)#2,932 |
| 68. | Harbor Island | 9.4% | 3.9%(+5.51)#68 | 3.5%(+5.89)#2,963 |
| 69. | Turbeville | 9.3% | 3.9%(+5.46)#69 | 3.5%(+5.85)#2,981 |
| 70. | Roebuck | 9.3% | 3.9%(+5.40)#70 | 3.5%(+5.79)#3,014 |
| 71. | Gayle Mill | 9.1% | 3.9%(+5.27)#71 | 3.5%(+5.66)#3,075 |
| 72. | Iva | 9.1% | 3.9%(+5.25)#72 | 3.5%(+5.64)#3,082 |
| 73. | Arthurtown | 9.0% | 3.9%(+5.10)#73 | 3.5%(+5.49)#3,194 |
| 74. | Gaston | 8.9% | 3.9%(+5.07)#74 | 3.5%(+5.46)#3,209 |
| 75. | Trenton | 8.9% | 3.9%(+5.06)#75 | 3.5%(+5.45)#3,216 |
| 76. | North Santee | 8.8% | 3.9%(+4.97)#76 | 3.5%(+5.36)#3,299 |
| 77. | Wedgefield | 8.8% | 3.9%(+4.94)#77 | 3.5%(+5.32)#3,321 |
| 78. | Elgin | 8.8% | 3.9%(+4.89)#78 | 3.5%(+5.27)#3,359 |
| 79. | Newberry | 8.7% | 3.9%(+4.83)#79 | 3.5%(+5.22)#3,385 |
| 80. | Surfside Beach | 8.7% | 3.9%(+4.82)#80 | 3.5%(+5.21)#3,412 |
| 81. | Chester | 8.6% | 3.9%(+4.74)#81 | 3.5%(+5.13)#3,467 |
| 82. | Liberty | 8.6% | 3.9%(+4.72)#82 | 3.5%(+5.10)#3,482 |
| 83. | Loris | 8.5% | 3.9%(+4.67)#83 | 3.5%(+5.05)#3,520 |
| 84. | Eutawville | 8.5% | 3.9%(+4.65)#84 | 3.5%(+5.04)#3,526 |
| 85. | Lockhart | 8.5% | 3.9%(+4.64)#85 | 3.5%(+5.03)#3,534 |
| 86. | Hopkins | 8.5% | 3.9%(+4.61)#86 | 3.5%(+4.99)#3,562 |
| 87. | Calhoun Falls | 8.4% | 3.9%(+4.52)#87 | 3.5%(+4.90)#3,626 |
| 88. | Hollywood | 8.2% | 3.9%(+4.35)#88 | 3.5%(+4.74)#3,773 |
| 89. | Lake View | 8.2% | 3.9%(+4.33)#89 | 3.5%(+4.71)#3,794 |
| 90. | Mount Carmel | 8.2% | 3.9%(+4.31)#90 | 3.5%(+4.69)#3,815 |
| 91. | Varnville | 8.1% | 3.9%(+4.19)#91 | 3.5%(+4.58)#3,915 |
| 92. | Adams Run | 8.0% | 3.9%(+4.17)#92 | 3.5%(+4.55)#3,933 |
| 93. | Dunbar | 8.0% | 3.9%(+4.11)#93 | 3.5%(+4.49)#3,981 |
| 94. | Walterboro | 7.8% | 3.9%(+3.96)#94 | 3.5%(+4.35)#4,118 |
| 95. | Sullivan S Island | 7.8% | 3.9%(+3.92)#95 | 3.5%(+4.31)#4,160 |
| 96. | Litchfield Beach | 7.7% | 3.9%(+3.84)#96 | 3.5%(+4.22)#4,215 |
| 97. | Privateer | 7.7% | 3.9%(+3.82)#97 | 3.5%(+4.21)#4,221 |
| 98. | Heath Springs | 7.7% | 3.9%(+3.80)#98 | 3.5%(+4.19)#4,270 |
| 99. | Darlington | 7.5% | 3.9%(+3.66)#99 | 3.5%(+4.05)#4,385 |
| 100. | Arcadia | 7.5% | 3.9%(+3.59)#100 | 3.5%(+3.98)#4,457 |
Common Questions
What are the Top 10 Cities with the Highest Percentage of Population Employed in Cleaning & Maintenance in South Carolina?
Top 10 Cities with the Highest Percentage of Population Employed in Cleaning & Maintenance in South Carolina are:
#1
40.6%
#2
31.2%
#3
30.7%
#4
27.9%
#5
26.6%
#6
23.6%
#7
21.1%
#8
20.0%
#9
18.3%
#10
17.3%
What city has the Highest Percentage of Population Employed in Cleaning & Maintenance in South Carolina?
Oswego has the Highest Percentage of Population Employed in Cleaning & Maintenance in South Carolina with 40.6%.
What is the Percentage of Population Employed in Cleaning & Maintenance in the State of South Carolina?
Percentage of Population Employed in Cleaning & Maintenance in South Carolina is 3.9%.
What is the Percentage of Population Employed in Cleaning & Maintenance in the United States?
Percentage of Population Employed in Cleaning & Maintenance in the United States is 3.5%.