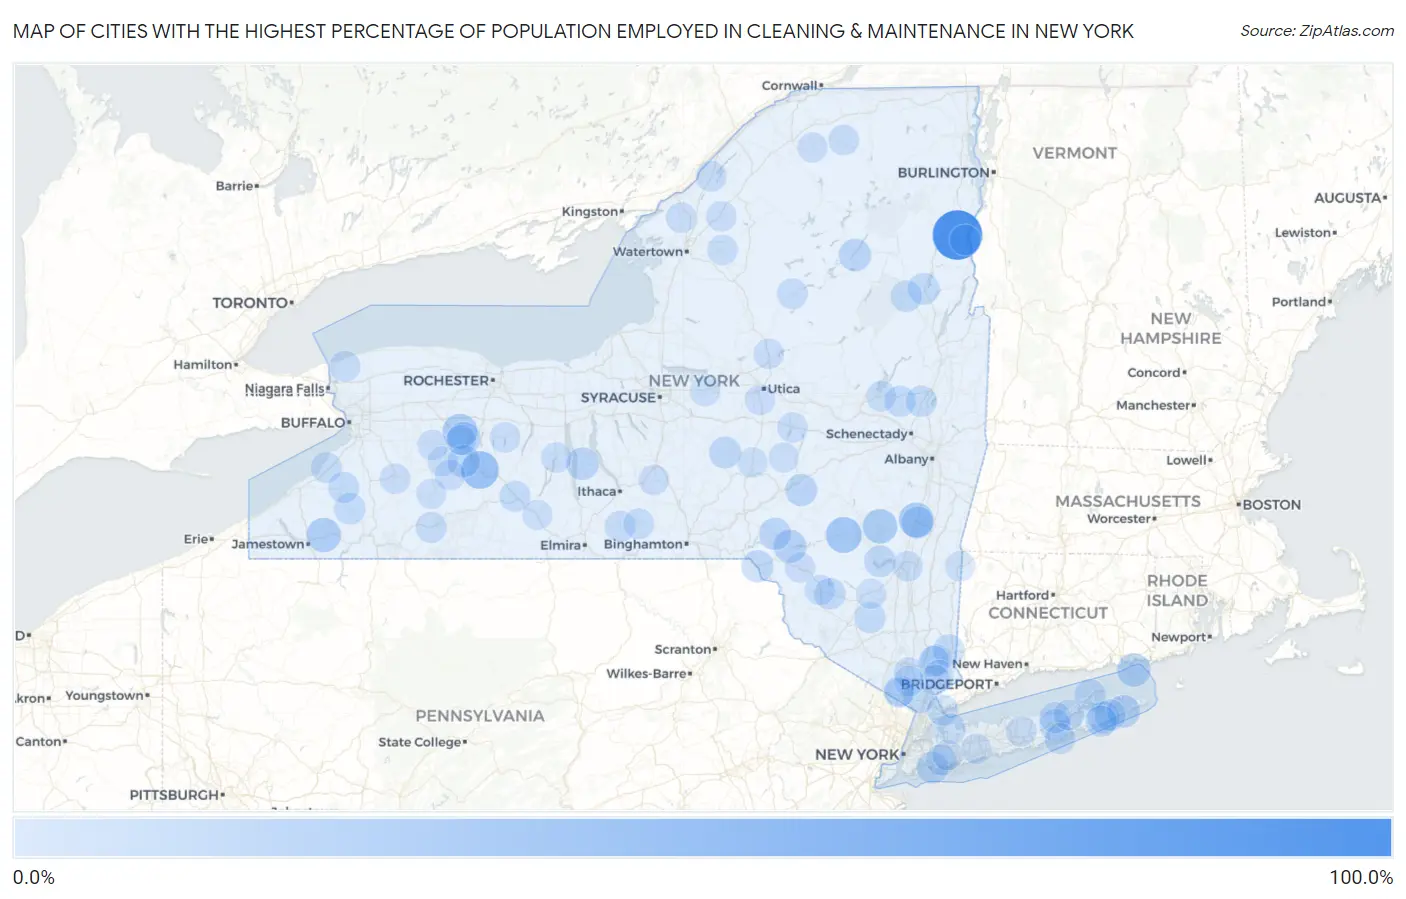
Cities with the Highest Percentage of Population Employed in Cleaning & Maintenance in New York
RELATED REPORTS & OPTIONS
Cleaning & Maintenance
New York
Compare Cities
Map of Cities with the Highest Percentage of Population Employed in Cleaning & Maintenance in New York
0.0%
100.0%
Cities with the Highest Percentage of Population Employed in Cleaning & Maintenance in New York
| City | % Employed | vs State | vs National | |
| 1. | Witherbee | 97.4% | 3.6%(+93.8)#1 | 3.5%(+94.0)#30 |
| 2. | Woodsville | 41.4% | 3.6%(+37.8)#2 | 3.5%(+37.9)#134 |
| 3. | Fleischmanns | 33.3% | 3.6%(+29.7)#3 | 3.5%(+29.9)#211 |
| 4. | Leeds | 28.9% | 3.6%(+25.3)#4 | 3.5%(+25.4)#290 |
| 5. | Greigsville | 28.8% | 3.6%(+25.2)#5 | 3.5%(+25.3)#292 |
| 6. | Hunter | 27.4% | 3.6%(+23.8)#6 | 3.5%(+23.9)#321 |
| 7. | Kennedy | 26.9% | 3.6%(+23.3)#7 | 3.5%(+23.4)#333 |
| 8. | Salisbury Center | 26.7% | 3.6%(+23.1)#8 | 3.5%(+23.2)#339 |
| 9. | Fishers Island | 23.1% | 3.6%(+19.5)#9 | 3.5%(+19.6)#469 |
| 10. | Cuylerville | 22.2% | 3.6%(+18.6)#10 | 3.5%(+18.7)#504 |
| 11. | Downsville | 21.4% | 3.6%(+17.8)#11 | 3.5%(+17.9)#552 |
| 12. | Lodi | 19.4% | 3.6%(+15.7)#12 | 3.5%(+15.9)#681 |
| 13. | Napeague | 19.3% | 3.6%(+15.7)#13 | 3.5%(+15.8)#685 |
| 14. | Long Lake | 18.4% | 3.6%(+14.7)#14 | 3.5%(+14.9)#741 |
| 15. | Tuscarora | 18.3% | 3.6%(+14.7)#15 | 3.5%(+14.8)#755 |
| 16. | Walton | 17.3% | 3.6%(+13.7)#16 | 3.5%(+13.9)#838 |
| 17. | Jefferson Heights | 17.2% | 3.6%(+13.6)#17 | 3.5%(+13.7)#859 |
| 18. | Wainscott | 17.0% | 3.6%(+13.4)#18 | 3.5%(+13.5)#877 |
| 19. | Davenport Center | 16.9% | 3.6%(+13.2)#19 | 3.5%(+13.4)#894 |
| 20. | Inwood | 16.4% | 3.6%(+12.8)#20 | 3.5%(+13.0)#938 |
| 21. | Smyrna | 16.3% | 3.6%(+12.6)#21 | 3.5%(+12.8)#960 |
| 22. | Hancock | 16.2% | 3.6%(+12.6)#22 | 3.5%(+12.7)#962 |
| 23. | Shokan | 15.5% | 3.6%(+11.9)#23 | 3.5%(+12.0)#1,042 |
| 24. | Pottersville | 15.2% | 3.6%(+11.6)#24 | 3.5%(+11.7)#1,080 |
| 25. | North Creek | 14.9% | 3.6%(+11.3)#25 | 3.5%(+11.5)#1,120 |
| 26. | Sleepy Hollow | 14.5% | 3.6%(+10.9)#26 | 3.5%(+11.0)#1,209 |
| 27. | Greenport | 14.2% | 3.6%(+10.6)#27 | 3.5%(+10.8)#1,254 |
| 28. | East Hampton North | 14.2% | 3.6%(+10.6)#28 | 3.5%(+10.7)#1,261 |
| 29. | Sagaponack | 14.2% | 3.6%(+10.6)#29 | 3.5%(+10.7)#1,265 |
| 30. | Riverside | 14.0% | 3.6%(+10.4)#30 | 3.5%(+10.6)#1,285 |
| 31. | Loch Sheldrake | 13.9% | 3.6%(+10.3)#31 | 3.5%(+10.4)#1,316 |
| 32. | Brewster | 13.9% | 3.6%(+10.3)#32 | 3.5%(+10.4)#1,325 |
| 33. | Galway | 13.7% | 3.6%(+10.1)#33 | 3.5%(+10.2)#1,368 |
| 34. | Pine Bush | 13.7% | 3.6%(+10.0)#34 | 3.5%(+10.2)#1,371 |
| 35. | Cattaraugus | 13.5% | 3.6%(+9.90)#35 | 3.5%(+10.0)#1,404 |
| 36. | East Durham | 13.1% | 3.6%(+9.53)#36 | 3.5%(+9.67)#1,497 |
| 37. | North Ballston Spa | 13.1% | 3.6%(+9.46)#37 | 3.5%(+9.60)#1,512 |
| 38. | Gowanda | 13.1% | 3.6%(+9.46)#38 | 3.5%(+9.59)#1,517 |
| 39. | Lincolndale | 12.8% | 3.6%(+9.21)#39 | 3.5%(+9.34)#1,599 |
| 40. | Avoca | 12.8% | 3.6%(+9.19)#40 | 3.5%(+9.32)#1,610 |
| 41. | Riverhead | 12.8% | 3.6%(+9.17)#41 | 3.5%(+9.30)#1,615 |
| 42. | Hillcrest | 12.7% | 3.6%(+9.07)#42 | 3.5%(+9.21)#1,641 |
| 43. | South Cairo | 12.6% | 3.6%(+9.01)#43 | 3.5%(+9.15)#1,656 |
| 44. | Port Chester | 12.5% | 3.6%(+8.85)#44 | 3.5%(+8.99)#1,709 |
| 45. | Friendship | 12.3% | 3.6%(+8.66)#45 | 3.5%(+8.80)#1,762 |
| 46. | Quiogue | 12.2% | 3.6%(+8.57)#46 | 3.5%(+8.70)#1,796 |
| 47. | Farnham | 12.1% | 3.6%(+8.49)#47 | 3.5%(+8.62)#1,822 |
| 48. | Danby | 12.1% | 3.6%(+8.44)#48 | 3.5%(+8.57)#1,835 |
| 49. | Spencer | 12.0% | 3.6%(+8.38)#49 | 3.5%(+8.52)#1,854 |
| 50. | Hammond | 12.0% | 3.6%(+8.34)#50 | 3.5%(+8.47)#1,876 |
| 51. | North Lynbrook | 11.5% | 3.6%(+7.89)#51 | 3.5%(+8.03)#2,008 |
| 52. | Port Henry | 11.5% | 3.6%(+7.86)#52 | 3.5%(+7.99)#2,019 |
| 53. | Ransomville | 11.4% | 3.6%(+7.83)#53 | 3.5%(+7.97)#2,028 |
| 54. | Old Forge | 11.2% | 3.6%(+7.61)#54 | 3.5%(+7.75)#2,117 |
| 55. | St Regis Falls | 11.1% | 3.6%(+7.49)#55 | 3.5%(+7.63)#2,162 |
| 56. | Candor | 11.0% | 3.6%(+7.38)#56 | 3.5%(+7.52)#2,203 |
| 57. | Shenorock | 10.9% | 3.6%(+7.30)#57 | 3.5%(+7.44)#2,244 |
| 58. | Wurtsboro Hills | 10.7% | 3.6%(+7.12)#58 | 3.5%(+7.26)#2,307 |
| 59. | Laurel | 10.6% | 3.6%(+6.98)#59 | 3.5%(+7.11)#2,362 |
| 60. | Carthage | 10.5% | 3.6%(+6.86)#60 | 3.5%(+7.00)#2,409 |
| 61. | Yorkshire | 10.5% | 3.6%(+6.84)#61 | 3.5%(+6.98)#2,417 |
| 62. | Gordon Heights | 10.4% | 3.6%(+6.81)#62 | 3.5%(+6.95)#2,438 |
| 63. | Warsaw | 10.3% | 3.6%(+6.67)#63 | 3.5%(+6.81)#2,487 |
| 64. | Liberty | 10.2% | 3.6%(+6.62)#64 | 3.5%(+6.75)#2,511 |
| 65. | Mount Kisco | 10.1% | 3.6%(+6.47)#65 | 3.5%(+6.61)#2,575 |
| 66. | Fallsburg | 10.1% | 3.6%(+6.46)#66 | 3.5%(+6.60)#2,578 |
| 67. | Virgil | 10.1% | 3.6%(+6.45)#67 | 3.5%(+6.59)#2,582 |
| 68. | Hempstead | 10.0% | 3.6%(+6.42)#68 | 3.5%(+6.56)#2,597 |
| 69. | Antwerp | 10.0% | 3.6%(+6.38)#69 | 3.5%(+6.52)#2,615 |
| 70. | Remsen | 10.0% | 3.6%(+6.38)#70 | 3.5%(+6.52)#2,619 |
| 71. | East Kingston | 10.0% | 3.6%(+6.38)#71 | 3.5%(+6.52)#2,621 |
| 72. | Hunt | 10.0% | 3.6%(+6.38)#72 | 3.5%(+6.52)#2,634 |
| 73. | Penn Yan | 9.9% | 3.6%(+6.29)#73 | 3.5%(+6.43)#2,680 |
| 74. | Honeoye | 9.9% | 3.6%(+6.28)#74 | 3.5%(+6.41)#2,690 |
| 75. | Crest View Heights | 9.9% | 3.6%(+6.27)#75 | 3.5%(+6.40)#2,698 |
| 76. | Roscoe | 9.9% | 3.6%(+6.27)#76 | 3.5%(+6.40)#2,700 |
| 77. | Richfield Springs | 9.9% | 3.6%(+6.26)#77 | 3.5%(+6.40)#2,702 |
| 78. | La Fargeville | 9.8% | 3.6%(+6.23)#78 | 3.5%(+6.36)#2,717 |
| 79. | Haverstraw | 9.8% | 3.6%(+6.22)#79 | 3.5%(+6.36)#2,719 |
| 80. | Verplanck | 9.8% | 3.6%(+6.21)#80 | 3.5%(+6.35)#2,731 |
| 81. | Parishville | 9.8% | 3.6%(+6.14)#81 | 3.5%(+6.27)#2,766 |
| 82. | Chadwicks | 9.7% | 3.6%(+6.06)#82 | 3.5%(+6.19)#2,796 |
| 83. | Broadalbin | 9.6% | 3.6%(+6.03)#83 | 3.5%(+6.16)#2,812 |
| 84. | Jacksonville | 9.3% | 3.6%(+5.68)#84 | 3.5%(+5.82)#2,996 |
| 85. | New Berlin | 9.2% | 3.6%(+5.61)#85 | 3.5%(+5.75)#3,029 |
| 86. | Millerton | 9.2% | 3.6%(+5.55)#86 | 3.5%(+5.68)#3,062 |
| 87. | Bedford Hills | 9.2% | 3.6%(+5.54)#87 | 3.5%(+5.67)#3,066 |
| 88. | Houghton | 9.1% | 3.6%(+5.50)#88 | 3.5%(+5.63)#3,083 |
| 89. | Canastota | 9.1% | 3.6%(+5.48)#89 | 3.5%(+5.62)#3,088 |
| 90. | Castile | 8.9% | 3.6%(+5.33)#90 | 3.5%(+5.46)#3,206 |
| 91. | Wyandanch | 8.9% | 3.6%(+5.33)#91 | 3.5%(+5.46)#3,208 |
| 92. | Kerhonkson | 8.9% | 3.6%(+5.29)#92 | 3.5%(+5.43)#3,227 |
| 93. | Otter Lake | 8.9% | 3.6%(+5.27)#93 | 3.5%(+5.41)#3,261 |
| 94. | Hartwick | 8.9% | 3.6%(+5.26)#94 | 3.5%(+5.40)#3,272 |
| 95. | Locust Valley | 8.9% | 3.6%(+5.24)#95 | 3.5%(+5.37)#3,292 |
| 96. | Milton Cdp Ulster County | 8.9% | 3.6%(+5.24)#96 | 3.5%(+5.37)#3,293 |
| 97. | Leicester | 8.8% | 3.6%(+5.18)#97 | 3.5%(+5.32)#3,324 |
| 98. | Savona | 8.7% | 3.6%(+5.11)#98 | 3.5%(+5.24)#3,374 |
| 99. | Spring Valley | 8.7% | 3.6%(+5.09)#99 | 3.5%(+5.23)#3,381 |
| 100. | Schuyler Lake | 8.7% | 3.6%(+5.08)#100 | 3.5%(+5.21)#3,406 |
Common Questions
What are the Top 10 Cities with the Highest Percentage of Population Employed in Cleaning & Maintenance in New York?
Top 10 Cities with the Highest Percentage of Population Employed in Cleaning & Maintenance in New York are:
#1
97.4%
#2
41.4%
#3
33.3%
#4
28.9%
#5
28.8%
#6
27.4%
#7
26.9%
#8
23.1%
#9
22.2%
#10
21.4%
What city has the Highest Percentage of Population Employed in Cleaning & Maintenance in New York?
Witherbee has the Highest Percentage of Population Employed in Cleaning & Maintenance in New York with 97.4%.
What is the Percentage of Population Employed in Cleaning & Maintenance in the State of New York?
Percentage of Population Employed in Cleaning & Maintenance in New York is 3.6%.
What is the Percentage of Population Employed in Cleaning & Maintenance in the United States?
Percentage of Population Employed in Cleaning & Maintenance in the United States is 3.5%.