Cities with the Highest Percentage of Population Employed in Cleaning & Maintenance in Kansas
RELATED REPORTS & OPTIONS
Cleaning & Maintenance
Kansas
Compare Cities
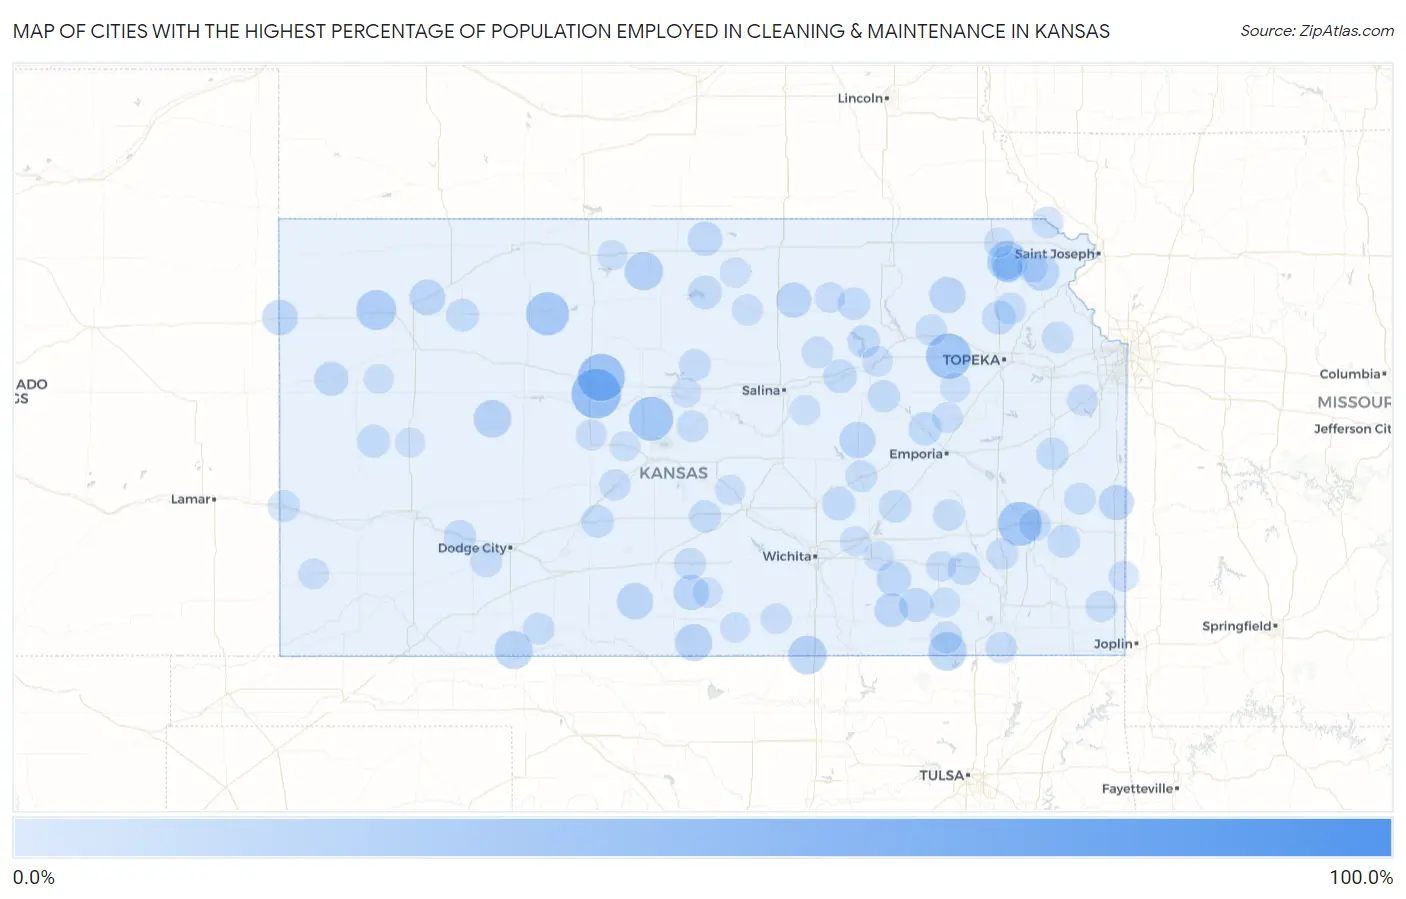
Map of Cities with the Highest Percentage of Population Employed in Cleaning & Maintenance in Kansas
0.0%
100.0%
Cities with the Highest Percentage of Population Employed in Cleaning & Maintenance in Kansas
| City | % Employed | vs State | vs National | |
| 1. | Shallow Water | 100.0% | 3.3%(+96.7)#1 | 3.5%(+96.5)#17 |
| 2. | Kelly | 100.0% | 3.3%(+96.7)#2 | 3.5%(+96.5)#28 |
| 3. | Farlington | 77.5% | 3.3%(+74.2)#3 | 3.5%(+74.0)#36 |
| 4. | Munjor | 43.4% | 3.3%(+40.1)#4 | 3.5%(+39.9)#123 |
| 5. | Zeandale | 40.7% | 3.3%(+37.5)#5 | 3.5%(+37.3)#138 |
| 6. | Catharine | 39.3% | 3.3%(+36.1)#6 | 3.5%(+35.8)#149 |
| 7. | Paxico | 35.9% | 3.3%(+32.7)#7 | 3.5%(+32.4)#181 |
| 8. | Piqua | 33.3% | 3.3%(+30.1)#8 | 3.5%(+29.9)#219 |
| 9. | Susank | 33.3% | 3.3%(+30.1)#9 | 3.5%(+29.9)#222 |
| 10. | Bogue | 31.6% | 3.3%(+28.3)#10 | 3.5%(+28.1)#242 |
| 11. | Wabaunsee | 30.4% | 3.3%(+27.2)#11 | 3.5%(+27.0)#262 |
| 12. | Navarre | 29.5% | 3.3%(+26.3)#12 | 3.5%(+26.1)#273 |
| 13. | Kickapoo Site 1 | 26.9% | 3.3%(+23.7)#13 | 3.5%(+23.4)#336 |
| 14. | Levant | 25.8% | 3.3%(+22.5)#14 | 3.5%(+22.3)#368 |
| 15. | Hunnewell | 23.3% | 3.3%(+20.1)#15 | 3.5%(+19.9)#457 |
| 16. | Chautauqua | 23.1% | 3.3%(+19.8)#16 | 3.5%(+19.6)#468 |
| 17. | Gaylord | 22.9% | 3.3%(+19.6)#17 | 3.5%(+19.4)#477 |
| 18. | Englewood | 22.2% | 3.3%(+19.0)#18 | 3.5%(+18.7)#511 |
| 19. | Utica | 21.5% | 3.3%(+18.3)#19 | 3.5%(+18.1)#542 |
| 20. | Croweburg | 20.9% | 3.3%(+17.7)#20 | 3.5%(+17.4)#576 |
| 21. | Hazelton | 20.6% | 3.3%(+17.3)#21 | 3.5%(+17.1)#593 |
| 22. | Lincolnville | 19.1% | 3.3%(+15.8)#22 | 3.5%(+15.6)#695 |
| 23. | Sun City | 19.0% | 3.3%(+15.8)#23 | 3.5%(+15.6)#700 |
| 24. | Huron | 18.8% | 3.3%(+15.5)#24 | 3.5%(+15.3)#721 |
| 25. | Onaga | 18.6% | 3.3%(+15.3)#25 | 3.5%(+15.1)#731 |
| 26. | Rexford | 18.0% | 3.3%(+14.7)#26 | 3.5%(+14.5)#789 |
| 27. | Kanorado | 17.7% | 3.3%(+14.4)#27 | 3.5%(+14.2)#805 |
| 28. | Nashville | 17.2% | 3.3%(+14.0)#28 | 3.5%(+13.8)#849 |
| 29. | Aurora | 17.1% | 3.3%(+13.9)#29 | 3.5%(+13.7)#863 |
| 30. | Prescott | 16.9% | 3.3%(+13.6)#30 | 3.5%(+13.4)#891 |
| 31. | Latham | 16.1% | 3.3%(+12.9)#31 | 3.5%(+12.6)#974 |
| 32. | Burr Oak | 15.9% | 3.3%(+12.6)#32 | 3.5%(+12.4)#997 |
| 33. | Wallace | 15.2% | 3.3%(+11.9)#33 | 3.5%(+11.7)#1,085 |
| 34. | Grenola | 14.9% | 3.3%(+11.6)#34 | 3.5%(+11.4)#1,131 |
| 35. | Cambridge | 14.7% | 3.3%(+11.4)#35 | 3.5%(+11.2)#1,157 |
| 36. | Glen Elder | 14.3% | 3.3%(+11.1)#36 | 3.5%(+10.8)#1,229 |
| 37. | Kickapoo Site 2 | 14.3% | 3.3%(+11.0)#37 | 3.5%(+10.8)#1,251 |
| 38. | Mayetta | 14.1% | 3.3%(+10.8)#38 | 3.5%(+10.6)#1,280 |
| 39. | Detroit | 13.8% | 3.3%(+10.6)#39 | 3.5%(+10.4)#1,338 |
| 40. | Dunlap | 13.8% | 3.3%(+10.5)#40 | 3.5%(+10.3)#1,349 |
| 41. | Elbing | 13.4% | 3.3%(+10.2)#41 | 3.5%(+9.95)#1,427 |
| 42. | Marienthal | 12.9% | 3.3%(+9.64)#42 | 3.5%(+9.42)#1,572 |
| 43. | Hoxie | 12.8% | 3.3%(+9.53)#43 | 3.5%(+9.31)#1,611 |
| 44. | Lewis | 12.6% | 3.3%(+9.30)#44 | 3.5%(+9.07)#1,677 |
| 45. | Milford | 12.5% | 3.3%(+9.24)#45 | 3.5%(+9.02)#1,684 |
| 46. | Fall River | 12.5% | 3.3%(+9.24)#46 | 3.5%(+9.02)#1,689 |
| 47. | Elsmore | 12.5% | 3.3%(+9.24)#47 | 3.5%(+9.02)#1,700 |
| 48. | Green | 12.3% | 3.3%(+9.02)#48 | 3.5%(+8.80)#1,763 |
| 49. | Ingalls | 12.2% | 3.3%(+8.97)#49 | 3.5%(+8.75)#1,780 |
| 50. | Cassoday | 12.2% | 3.3%(+8.96)#50 | 3.5%(+8.74)#1,786 |
| 51. | White City | 11.8% | 3.3%(+8.57)#51 | 3.5%(+8.35)#1,914 |
| 52. | Richmond | 11.8% | 3.3%(+8.50)#52 | 3.5%(+8.28)#1,925 |
| 53. | Plevna | 11.6% | 3.3%(+8.37)#53 | 3.5%(+8.15)#1,969 |
| 54. | Sedan | 11.4% | 3.3%(+8.13)#54 | 3.5%(+7.91)#2,054 |
| 55. | Coolidge | 11.4% | 3.3%(+8.10)#55 | 3.5%(+7.88)#2,073 |
| 56. | Denison | 11.3% | 3.3%(+8.01)#56 | 3.5%(+7.78)#2,108 |
| 57. | Sylvan Grove | 11.2% | 3.3%(+7.92)#57 | 3.5%(+7.70)#2,137 |
| 58. | Ensign | 11.1% | 3.3%(+7.85)#58 | 3.5%(+7.63)#2,170 |
| 59. | Bassett | 11.1% | 3.3%(+7.85)#59 | 3.5%(+7.63)#2,176 |
| 60. | Blue Mound | 11.0% | 3.3%(+7.71)#60 | 3.5%(+7.49)#2,214 |
| 61. | Cunningham | 10.9% | 3.3%(+7.67)#61 | 3.5%(+7.45)#2,237 |
| 62. | Florence | 10.8% | 3.3%(+7.59)#62 | 3.5%(+7.37)#2,262 |
| 63. | Manchester | 10.8% | 3.3%(+7.55)#63 | 3.5%(+7.33)#2,284 |
| 64. | Buffalo | 10.8% | 3.3%(+7.53)#64 | 3.5%(+7.31)#2,288 |
| 65. | Ashland | 10.7% | 3.3%(+7.48)#65 | 3.5%(+7.26)#2,302 |
| 66. | Holyrood | 10.6% | 3.3%(+7.39)#66 | 3.5%(+7.17)#2,342 |
| 67. | Hamilton | 10.6% | 3.3%(+7.33)#67 | 3.5%(+7.11)#2,366 |
| 68. | White Cloud | 10.5% | 3.3%(+7.27)#68 | 3.5%(+7.04)#2,391 |
| 69. | Mclouth | 10.5% | 3.3%(+7.20)#69 | 3.5%(+6.98)#2,418 |
| 70. | Dearing | 10.2% | 3.3%(+6.98)#70 | 3.5%(+6.76)#2,510 |
| 71. | Cherokee | 10.0% | 3.3%(+6.77)#71 | 3.5%(+6.55)#2,605 |
| 72. | Louisville | 10.0% | 3.3%(+6.74)#72 | 3.5%(+6.52)#2,628 |
| 73. | Larned | 9.9% | 3.3%(+6.62)#73 | 3.5%(+6.39)#2,704 |
| 74. | Simpson | 9.8% | 3.3%(+6.58)#74 | 3.5%(+6.35)#2,728 |
| 75. | Edgerton | 9.6% | 3.3%(+6.35)#75 | 3.5%(+6.13)#2,837 |
| 76. | La Crosse | 9.6% | 3.3%(+6.34)#76 | 3.5%(+6.12)#2,840 |
| 77. | Allen | 9.4% | 3.3%(+6.09)#77 | 3.5%(+5.87)#2,975 |
| 78. | Milan | 9.1% | 3.3%(+5.83)#78 | 3.5%(+5.61)#3,115 |
| 79. | Grandview Plaza | 9.0% | 3.3%(+5.73)#79 | 3.5%(+5.51)#3,184 |
| 80. | Johnson City | 8.9% | 3.3%(+5.66)#80 | 3.5%(+5.44)#3,222 |
| 81. | Everest | 8.7% | 3.3%(+5.43)#81 | 3.5%(+5.21)#3,391 |
| 82. | Morganville | 8.7% | 3.3%(+5.43)#82 | 3.5%(+5.21)#3,399 |
| 83. | Mulberry | 8.6% | 3.3%(+5.37)#83 | 3.5%(+5.15)#3,454 |
| 84. | Severy | 8.5% | 3.3%(+5.29)#84 | 3.5%(+5.06)#3,509 |
| 85. | Nickerson | 8.4% | 3.3%(+5.14)#85 | 3.5%(+4.92)#3,613 |
| 86. | Gypsum | 8.3% | 3.3%(+5.07)#86 | 3.5%(+4.85)#3,664 |
| 87. | Randall | 8.3% | 3.3%(+5.07)#87 | 3.5%(+4.85)#3,669 |
| 88. | Kickapoo Tribal Center | 8.3% | 3.3%(+5.07)#88 | 3.5%(+4.85)#3,677 |
| 89. | Leon | 8.2% | 3.3%(+4.99)#89 | 3.5%(+4.76)#3,743 |
| 90. | Albert | 8.2% | 3.3%(+4.90)#90 | 3.5%(+4.68)#3,829 |
| 91. | Towanda | 8.0% | 3.3%(+4.75)#91 | 3.5%(+4.53)#3,958 |
| 92. | Agra | 8.0% | 3.3%(+4.74)#92 | 3.5%(+4.52)#3,969 |
| 93. | Zenda | 7.9% | 3.3%(+4.63)#93 | 3.5%(+4.41)#4,066 |
| 94. | Anthony | 7.9% | 3.3%(+4.62)#94 | 3.5%(+4.40)#4,078 |
| 95. | Scott City | 7.8% | 3.3%(+4.58)#95 | 3.5%(+4.35)#4,114 |
| 96. | Wilson | 7.7% | 3.3%(+4.48)#96 | 3.5%(+4.26)#4,187 |
| 97. | Eskridge | 7.7% | 3.3%(+4.43)#97 | 3.5%(+4.21)#4,227 |
| 98. | Fairview | 7.7% | 3.3%(+4.43)#98 | 3.5%(+4.21)#4,233 |
| 99. | Elk Falls | 7.7% | 3.3%(+4.43)#99 | 3.5%(+4.21)#4,246 |
| 100. | Russell Springs | 7.7% | 3.3%(+4.43)#100 | 3.5%(+4.21)#4,256 |
Common Questions
What are the Top 10 Cities with the Highest Percentage of Population Employed in Cleaning & Maintenance in Kansas?
Top 10 Cities with the Highest Percentage of Population Employed in Cleaning & Maintenance in Kansas are:
#1
43.4%
#2
39.3%
#3
35.9%
#4
33.3%
#5
33.3%
#6
31.6%
#7
26.9%
#8
25.8%
#9
23.3%
#10
23.1%
What city has the Highest Percentage of Population Employed in Cleaning & Maintenance in Kansas?
Munjor has the Highest Percentage of Population Employed in Cleaning & Maintenance in Kansas with 43.4%.
What is the Percentage of Population Employed in Cleaning & Maintenance in the State of Kansas?
Percentage of Population Employed in Cleaning & Maintenance in Kansas is 3.3%.
What is the Percentage of Population Employed in Cleaning & Maintenance in the United States?
Percentage of Population Employed in Cleaning & Maintenance in the United States is 3.5%.