Cities with the Highest Percentage of Population Employed in Cleaning & Maintenance in Connecticut
RELATED REPORTS & OPTIONS
Cleaning & Maintenance
Connecticut
Compare Cities
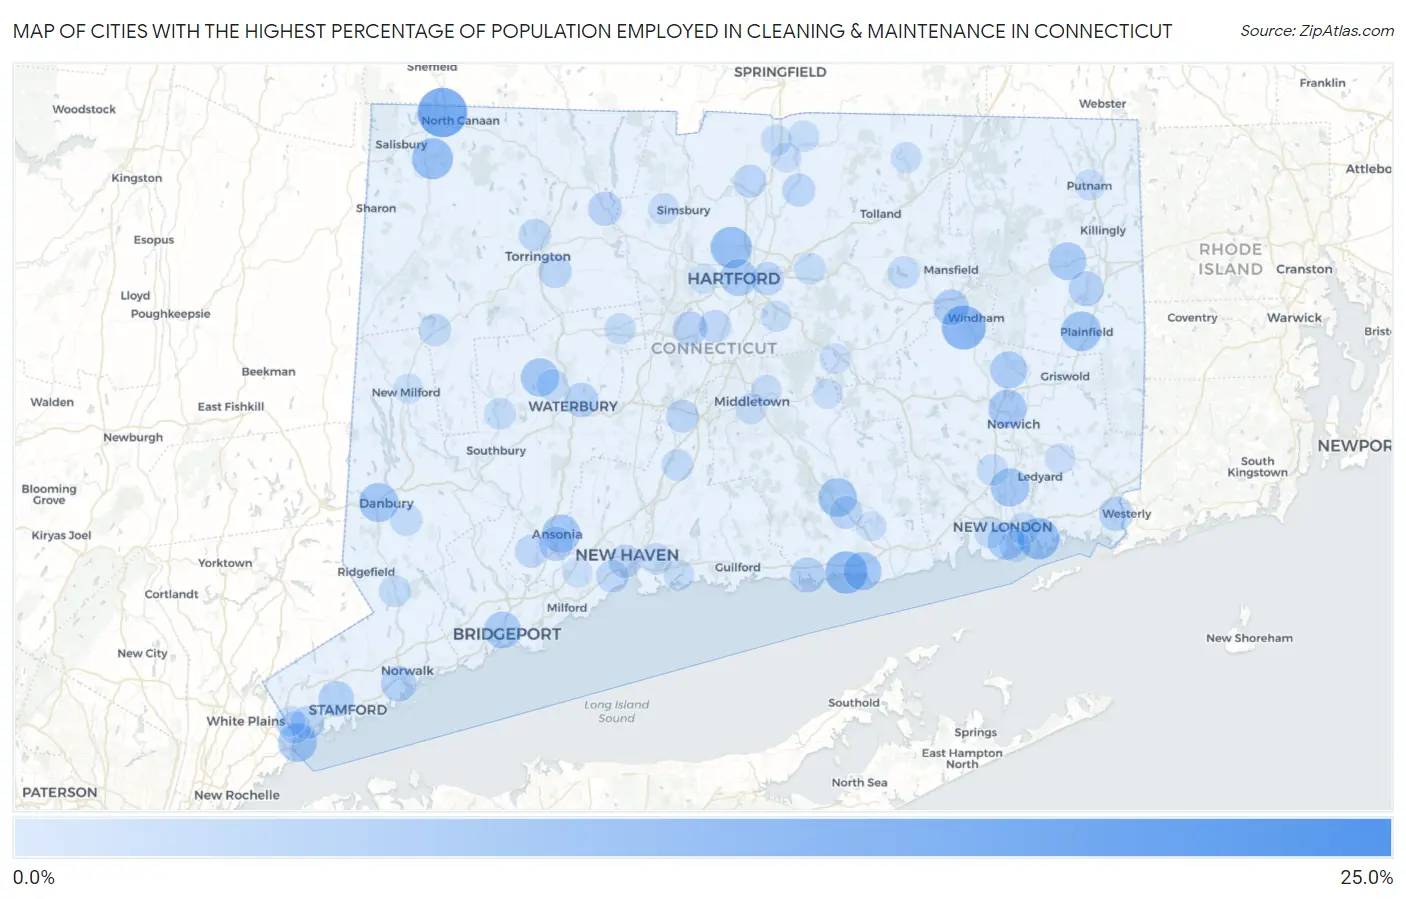
Map of Cities with the Highest Percentage of Population Employed in Cleaning & Maintenance in Connecticut
0.0%
25.0%
Cities with the Highest Percentage of Population Employed in Cleaning & Maintenance in Connecticut
| City | % Employed | vs State | vs National | |
| 1. | Cornwall Bridge | 23.5% | 3.5%(+19.9)#1 | 3.5%(+20.0)#452 |
| 2. | Pleasant Valley | 18.4% | 3.5%(+14.9)#2 | 3.5%(+14.9)#739 |
| 3. | Canaan | 16.3% | 3.5%(+12.7)#3 | 3.5%(+12.8)#955 |
| 4. | Lake Chaffee | 14.2% | 3.5%(+10.6)#4 | 3.5%(+10.7)#1,263 |
| 5. | South Windham | 12.2% | 3.5%(+8.67)#5 | 3.5%(+8.73)#1,789 |
| 6. | Westbrook Center | 11.0% | 3.5%(+7.44)#6 | 3.5%(+7.50)#2,209 |
| 7. | Poquonock Bridge | 10.2% | 3.5%(+6.68)#7 | 3.5%(+6.74)#2,517 |
| 8. | Blue Hills | 10.2% | 3.5%(+6.63)#8 | 3.5%(+6.69)#2,540 |
| 9. | Inglenook | 10.1% | 3.5%(+6.54)#9 | 3.5%(+6.59)#2,580 |
| 10. | Falls Village | 10.0% | 3.5%(+6.50)#10 | 3.5%(+6.56)#2,593 |
| 11. | Plainfield Village | 9.0% | 3.5%(+5.41)#11 | 3.5%(+5.47)#3,205 |
| 12. | Danbury | 8.6% | 3.5%(+5.06)#12 | 3.5%(+5.12)#3,471 |
| 13. | Bridgewater | 8.3% | 3.5%(+4.79)#13 | 3.5%(+4.85)#3,676 |
| 14. | Byram | 8.3% | 3.5%(+4.76)#14 | 3.5%(+4.82)#3,703 |
| 15. | Chester Center | 8.2% | 3.5%(+4.64)#15 | 3.5%(+4.69)#3,813 |
| 16. | Gales Ferry | 8.0% | 3.5%(+4.47)#16 | 3.5%(+4.53)#3,962 |
| 17. | Watertown | 8.0% | 3.5%(+4.42)#17 | 3.5%(+4.48)#3,998 |
| 18. | Norwich | 7.9% | 3.5%(+4.34)#18 | 3.5%(+4.40)#4,079 |
| 19. | Ansonia | 7.8% | 3.5%(+4.27)#19 | 3.5%(+4.33)#4,131 |
| 20. | Saybrook Manor | 7.8% | 3.5%(+4.21)#20 | 3.5%(+4.27)#4,178 |
| 21. | Brooklyn | 7.5% | 3.5%(+3.95)#21 | 3.5%(+4.01)#4,420 |
| 22. | Hartford | 7.2% | 3.5%(+3.62)#22 | 3.5%(+3.68)#4,762 |
| 23. | New London | 7.1% | 3.5%(+3.57)#23 | 3.5%(+3.63)#4,812 |
| 24. | Baltic | 7.1% | 3.5%(+3.53)#24 | 3.5%(+3.59)#4,847 |
| 25. | Bridgeport | 6.9% | 3.5%(+3.32)#25 | 3.5%(+3.38)#5,117 |
| 26. | Bantam Borough | 6.6% | 3.5%(+3.11)#26 | 3.5%(+3.16)#5,395 |
| 27. | Rock Ridge | 6.5% | 3.5%(+2.91)#27 | 3.5%(+2.97)#5,664 |
| 28. | Willimantic | 6.2% | 3.5%(+2.65)#28 | 3.5%(+2.71)#6,075 |
| 29. | Stamford | 6.0% | 3.5%(+2.43)#29 | 3.5%(+2.48)#6,442 |
| 30. | Norwalk | 5.9% | 3.5%(+2.35)#30 | 3.5%(+2.41)#6,554 |
| 31. | Clinton | 5.7% | 3.5%(+2.12)#31 | 3.5%(+2.18)#6,933 |
| 32. | Wauregan | 5.5% | 3.5%(+1.99)#32 | 3.5%(+2.05)#7,145 |
| 33. | Lakes East | 5.5% | 3.5%(+1.94)#33 | 3.5%(+2.00)#7,268 |
| 34. | Derby | 5.2% | 3.5%(+1.68)#34 | 3.5%(+1.73)#7,771 |
| 35. | Waterbury | 5.2% | 3.5%(+1.65)#35 | 3.5%(+1.70)#7,845 |
| 36. | Pawcatuck | 5.1% | 3.5%(+1.58)#36 | 3.5%(+1.64)#7,985 |
| 37. | New Britain | 5.1% | 3.5%(+1.52)#37 | 3.5%(+1.58)#8,136 |
| 38. | Litchfield Borough | 5.0% | 3.5%(+1.47)#38 | 3.5%(+1.53)#8,217 |
| 39. | Stratford Downtown | 5.0% | 3.5%(+1.41)#39 | 3.5%(+1.47)#8,363 |
| 40. | New Hartford Center | 4.8% | 3.5%(+1.27)#40 | 3.5%(+1.33)#8,693 |
| 41. | Gaylordsville | 4.8% | 3.5%(+1.24)#41 | 3.5%(+1.29)#8,781 |
| 42. | Candlewood Orchards | 4.7% | 3.5%(+1.11)#42 | 3.5%(+1.17)#9,091 |
| 43. | Northwest Harwinton | 4.4% | 3.5%(+0.879)#43 | 3.5%(+0.937)#9,731 |
| 44. | Greenwich | 4.4% | 3.5%(+0.849)#44 | 3.5%(+0.907)#9,828 |
| 45. | New Haven | 4.3% | 3.5%(+0.769)#45 | 3.5%(+0.827)#10,062 |
| 46. | East Hartford | 4.2% | 3.5%(+0.708)#46 | 3.5%(+0.766)#10,230 |
| 47. | Broad Brook | 4.2% | 3.5%(+0.628)#47 | 3.5%(+0.686)#10,451 |
| 48. | Windsor Locks | 4.1% | 3.5%(+0.582)#48 | 3.5%(+0.641)#10,608 |
| 49. | Meriden | 4.0% | 3.5%(+0.496)#49 | 3.5%(+0.554)#10,886 |
| 50. | Deep River Center | 4.0% | 3.5%(+0.487)#50 | 3.5%(+0.545)#10,907 |
| 51. | Sacred Heart University | 4.0% | 3.5%(+0.449)#51 | 3.5%(+0.507)#11,029 |
| 52. | Shelton | 3.9% | 3.5%(+0.397)#52 | 3.5%(+0.455)#11,188 |
| 53. | West Haven | 3.9% | 3.5%(+0.317)#53 | 3.5%(+0.375)#11,416 |
| 54. | Torrington | 3.8% | 3.5%(+0.304)#54 | 3.5%(+0.362)#11,472 |
| 55. | Newington | 3.8% | 3.5%(+0.283)#55 | 3.5%(+0.342)#11,530 |
| 56. | New Preston | 3.7% | 3.5%(+0.155)#56 | 3.5%(+0.213)#11,937 |
| 57. | Pemberwick | 3.6% | 3.5%(+0.061)#57 | 3.5%(+0.120)#12,257 |
| 58. | Long Hill | 3.6% | 3.5%(+0.038)#58 | 3.5%(+0.096)#12,344 |
| 59. | Candlewood Isle | 3.5% | 3.5%(-0.007)#59 | 3.5%(+0.051)#12,496 |
| 60. | Fairfield University | 3.5% | 3.5%(-0.021)#60 | 3.5%(+0.037)#12,543 |
| 61. | Groton Long Point Borough | 3.5% | 3.5%(-0.025)#61 | 3.5%(+0.033)#12,556 |
| 62. | Bethel | 3.4% | 3.5%(-0.114)#62 | 3.5%(-0.056)#12,884 |
| 63. | Oakville | 3.4% | 3.5%(-0.190)#63 | 3.5%(-0.132)#13,176 |
| 64. | South Coventry | 3.3% | 3.5%(-0.219)#64 | 3.5%(-0.161)#13,300 |
| 65. | Saugatuck | 3.3% | 3.5%(-0.241)#65 | 3.5%(-0.183)#13,364 |
| 66. | Georgetown | 3.3% | 3.5%(-0.262)#66 | 3.5%(-0.204)#13,434 |
| 67. | Wallingford Center | 3.3% | 3.5%(-0.275)#67 | 3.5%(-0.217)#13,492 |
| 68. | Groton | 3.2% | 3.5%(-0.322)#68 | 3.5%(-0.264)#13,679 |
| 69. | Mechanicsville | 3.2% | 3.5%(-0.331)#69 | 3.5%(-0.273)#13,708 |
| 70. | Woodbury Center | 3.2% | 3.5%(-0.359)#70 | 3.5%(-0.301)#13,813 |
| 71. | Lake Bungee | 3.2% | 3.5%(-0.371)#71 | 3.5%(-0.313)#13,862 |
| 72. | Woodmont Borough | 3.1% | 3.5%(-0.409)#72 | 3.5%(-0.351)#13,982 |
| 73. | Waterford | 3.1% | 3.5%(-0.418)#73 | 3.5%(-0.360)#14,029 |
| 74. | East Haven | 3.1% | 3.5%(-0.433)#74 | 3.5%(-0.375)#14,072 |
| 75. | Jewett City Borough | 3.1% | 3.5%(-0.449)#75 | 3.5%(-0.390)#14,128 |
| 76. | Oxoboxo River | 3.1% | 3.5%(-0.450)#76 | 3.5%(-0.392)#14,132 |
| 77. | Manchester | 3.1% | 3.5%(-0.466)#77 | 3.5%(-0.408)#14,196 |
| 78. | Bristol | 2.9% | 3.5%(-0.610)#78 | 3.5%(-0.552)#14,749 |
| 79. | Hazardville | 2.8% | 3.5%(-0.716)#79 | 3.5%(-0.657)#15,159 |
| 80. | Thompsonville | 2.8% | 3.5%(-0.790)#80 | 3.5%(-0.732)#15,448 |
| 81. | West Simsbury | 2.7% | 3.5%(-0.810)#81 | 3.5%(-0.751)#15,513 |
| 82. | Middletown | 2.7% | 3.5%(-0.838)#82 | 3.5%(-0.780)#15,637 |
| 83. | Glastonbury Center | 2.6% | 3.5%(-0.910)#83 | 3.5%(-0.852)#15,907 |
| 84. | Stonington Borough | 2.6% | 3.5%(-0.915)#84 | 3.5%(-0.857)#15,925 |
| 85. | Putnam | 2.6% | 3.5%(-0.944)#85 | 3.5%(-0.886)#16,039 |
| 86. | Branford Center | 2.6% | 3.5%(-0.954)#86 | 3.5%(-0.896)#16,072 |
| 87. | Stafford Springs | 2.5% | 3.5%(-1.02)#87 | 3.5%(-0.960)#16,307 |
| 88. | Terramuggus | 2.5% | 3.5%(-1.04)#88 | 3.5%(-0.977)#16,367 |
| 89. | Glenville | 2.4% | 3.5%(-1.09)#89 | 3.5%(-1.03)#16,580 |
| 90. | Portland | 2.4% | 3.5%(-1.13)#90 | 3.5%(-1.08)#16,737 |
| 91. | Mashantucket | 2.4% | 3.5%(-1.16)#91 | 3.5%(-1.10)#16,838 |
| 92. | Lakeside Woods | 2.3% | 3.5%(-1.20)#92 | 3.5%(-1.14)#16,984 |
| 93. | East | 2.3% | 3.5%(-1.29)#93 | 3.5%(-1.23)#17,318 |
| 94. | Southwood Acres | 2.2% | 3.5%(-1.34)#94 | 3.5%(-1.28)#17,521 |
| 95. | East Hampton | 2.2% | 3.5%(-1.35)#95 | 3.5%(-1.29)#17,555 |
| 96. | West Hartford | 2.2% | 3.5%(-1.38)#96 | 3.5%(-1.32)#17,684 |
| 97. | Orange | 2.1% | 3.5%(-1.40)#97 | 3.5%(-1.34)#17,754 |
| 98. | Stepney | 2.1% | 3.5%(-1.46)#98 | 3.5%(-1.40)#17,997 |
| 99. | New Milford | 2.1% | 3.5%(-1.47)#99 | 3.5%(-1.41)#18,022 |
| 100. | Essex Village | 2.0% | 3.5%(-1.56)#100 | 3.5%(-1.50)#18,362 |
Common Questions
What are the Top 10 Cities with the Highest Percentage of Population Employed in Cleaning & Maintenance in Connecticut?
Top 10 Cities with the Highest Percentage of Population Employed in Cleaning & Maintenance in Connecticut are:
#1
16.3%
#2
12.2%
#3
11.0%
#4
10.2%
#5
10.2%
#6
10.0%
#7
9.0%
#8
8.6%
#9
8.3%
#10
8.2%
What city has the Highest Percentage of Population Employed in Cleaning & Maintenance in Connecticut?
Canaan has the Highest Percentage of Population Employed in Cleaning & Maintenance in Connecticut with 16.3%.
What is the Percentage of Population Employed in Cleaning & Maintenance in the State of Connecticut?
Percentage of Population Employed in Cleaning & Maintenance in Connecticut is 3.5%.
What is the Percentage of Population Employed in Cleaning & Maintenance in the United States?
Percentage of Population Employed in Cleaning & Maintenance in the United States is 3.5%.