Cities with the Highest Percentage of Population Employed in Cleaning & Maintenance in Pennsylvania
RELATED REPORTS & OPTIONS
Cleaning & Maintenance
Pennsylvania
Compare Cities
Map of Cities with the Highest Percentage of Population Employed in Cleaning & Maintenance in Pennsylvania
0.0%
100.0%
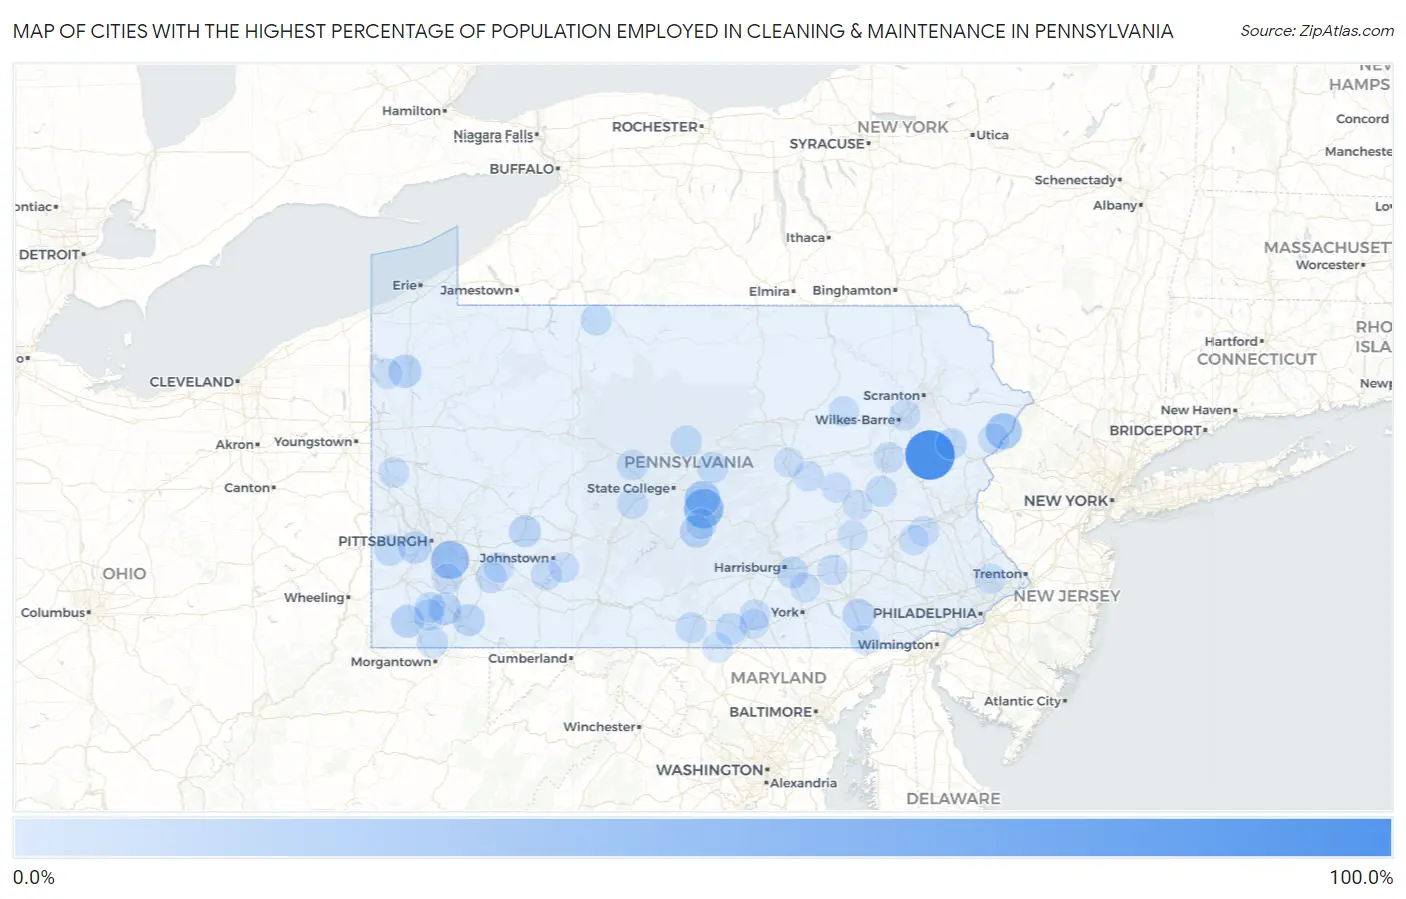
Cities with the Highest Percentage of Population Employed in Cleaning & Maintenance in Pennsylvania
| City | % Employed | vs State | vs National | |
| 1. | Albrightsville | 100.0% | 3.1% (+96.9)#1 | 3.5% (+96.5)#4 |
| 2. | Driftwood Borough | 83.3% | 3.1% (+80.2)#2 | 3.5% (+79.9)#33 |
| 3. | Lumber City | 51.9% | 3.1% (+48.8)#3 | 3.5% (+48.5)#79 |
| 4. | Boston | 45.7% | 3.1% (+42.6)#4 | 3.5% (+42.2)#107 |
| 5. | Pocono Ranch Lands | 37.2% | 3.1% (+34.1)#5 | 3.5% (+33.7)#170 |
| 6. | Potlicker Flats | 34.6% | 3.1% (+31.5)#6 | 3.5% (+31.1)#193 |
| 7. | S N P J Borough | 25.0% | 3.1% (+21.9)#7 | 3.5% (+21.5)#400 |
| 8. | Geneva | 24.1% | 3.1% (+21.0)#8 | 3.5% (+20.7)#424 |
| 9. | Birmingham Borough | 22.6% | 3.1% (+19.5)#9 | 3.5% (+19.1)#489 |
| 10. | Allison | 22.6% | 3.1% (+19.5)#10 | 3.5% (+19.1)#490 |
| 11. | West Waynesburg | 22.5% | 3.1% (+19.4)#11 | 3.5% (+19.0)#492 |
| 12. | Wallaceton Borough | 22.0% | 3.1% (+18.9)#12 | 3.5% (+18.6)#527 |
| 13. | Longfellow | 21.6% | 3.1% (+18.5)#13 | 3.5% (+18.1)#540 |
| 14. | Rennerdale | 20.6% | 3.1% (+17.5)#14 | 3.5% (+17.1)#590 |
| 15. | Eagleville Cdp Centre County | 20.5% | 3.1% (+17.4)#15 | 3.5% (+17.0)#596 |
| 16. | Refton | 20.5% | 3.1% (+17.4)#16 | 3.5% (+17.0)#601 |
| 17. | Graceton | 19.2% | 3.1% (+16.1)#17 | 3.5% (+15.7)#691 |
| 18. | Allenport Borough | 18.9% | 3.1% (+15.8)#18 | 3.5% (+15.4)#710 |
| 19. | Lemont Furnace | 18.4% | 3.1% (+15.3)#19 | 3.5% (+15.0)#735 |
| 20. | Orrtanna | 18.2% | 3.1% (+15.1)#20 | 3.5% (+14.7)#768 |
| 21. | Casanova | 18.0% | 3.1% (+14.9)#21 | 3.5% (+14.5)#788 |
| 22. | Bressler | 17.2% | 3.1% (+14.1)#22 | 3.5% (+13.7)#860 |
| 23. | Continental Courts | 17.0% | 3.1% (+13.9)#23 | 3.5% (+13.6)#874 |
| 24. | Joffre | 16.6% | 3.1% (+13.5)#24 | 3.5% (+13.1)#919 |
| 25. | Bobtown | 16.5% | 3.1% (+13.4)#25 | 3.5% (+13.0)#935 |
| 26. | Alverda | 16.2% | 3.1% (+13.1)#26 | 3.5% (+12.7)#964 |
| 27. | Hamorton | 16.1% | 3.1% (+13.0)#27 | 3.5% (+12.6)#976 |
| 28. | Emerald Lakes | 15.9% | 3.1% (+12.8)#28 | 3.5% (+12.5)#991 |
| 29. | Bald Eagle | 15.9% | 3.1% (+12.7)#29 | 3.5% (+12.4)#999 |
| 30. | Orviston | 15.8% | 3.1% (+12.7)#30 | 3.5% (+12.3)#1,006 |
| 31. | Madisonburg | 15.7% | 3.1% (+12.6)#31 | 3.5% (+12.2)#1,020 |
| 32. | Dry Tavern | 15.5% | 3.1% (+12.4)#32 | 3.5% (+12.1)#1,037 |
| 33. | Rew | 15.5% | 3.1% (+12.4)#33 | 3.5% (+12.0)#1,045 |
| 34. | Mifflintown Borough | 14.7% | 3.1% (+11.6)#34 | 3.5% (+11.2)#1,159 |
| 35. | Tuscarora | 14.6% | 3.1% (+11.5)#35 | 3.5% (+11.1)#1,177 |
| 36. | Mammoth | 14.4% | 3.1% (+11.3)#36 | 3.5% (+10.9)#1,222 |
| 37. | Oakland Cdp Lawrence County | 14.3% | 3.1% (+11.2)#37 | 3.5% (+10.9)#1,227 |
| 38. | Coaldale Borough Bedford County | 14.3% | 3.1% (+11.2)#38 | 3.5% (+10.8)#1,247 |
| 39. | Millsboro | 14.0% | 3.1% (+10.9)#39 | 3.5% (+10.5)#1,290 |
| 40. | Summerville Borough | 14.0% | 3.1% (+10.9)#40 | 3.5% (+10.5)#1,296 |
| 41. | Marion | 14.0% | 3.1% (+10.9)#41 | 3.5% (+10.5)#1,302 |
| 42. | Granville | 13.9% | 3.1% (+10.8)#42 | 3.5% (+10.4)#1,317 |
| 43. | Morrisdale | 13.9% | 3.1% (+10.8)#43 | 3.5% (+10.4)#1,322 |
| 44. | Heidlersburg | 13.7% | 3.1% (+10.6)#44 | 3.5% (+10.2)#1,374 |
| 45. | Ohiopyle Borough | 13.6% | 3.1% (+10.5)#45 | 3.5% (+10.2)#1,382 |
| 46. | Pardeesville | 13.6% | 3.1% (+10.5)#46 | 3.5% (+10.1)#1,395 |
| 47. | Hudson | 13.5% | 3.1% (+10.4)#47 | 3.5% (+10.0)#1,403 |
| 48. | Northwood | 13.4% | 3.1% (+10.3)#48 | 3.5% (+9.93)#1,431 |
| 49. | Dayton Borough | 13.4% | 3.1% (+10.3)#49 | 3.5% (+9.92)#1,433 |
| 50. | Utica Borough | 13.3% | 3.1% (+10.2)#50 | 3.5% (+9.85)#1,449 |
| 51. | Rainsburg Borough | 13.2% | 3.1% (+10.1)#51 | 3.5% (+9.72)#1,485 |
| 52. | Saw Creek | 13.1% | 3.1% (+9.98)#52 | 3.5% (+9.60)#1,513 |
| 53. | Jersey Shore Borough | 13.1% | 3.1% (+9.96)#53 | 3.5% (+9.58)#1,520 |
| 54. | Kutztown Borough | 12.8% | 3.1% (+9.74)#54 | 3.5% (+9.36)#1,591 |
| 55. | Mount Gretna Heights | 12.8% | 3.1% (+9.68)#55 | 3.5% (+9.30)#1,618 |
| 56. | Jerome | 12.6% | 3.1% (+9.53)#56 | 3.5% (+9.16)#1,654 |
| 57. | Wesleyville Borough | 12.5% | 3.1% (+9.43)#57 | 3.5% (+9.05)#1,679 |
| 58. | Hostetter | 12.4% | 3.1% (+9.34)#58 | 3.5% (+8.96)#1,716 |
| 59. | Mapleton Borough | 12.4% | 3.1% (+9.32)#59 | 3.5% (+8.95)#1,726 |
| 60. | Chewton | 12.4% | 3.1% (+9.30)#60 | 3.5% (+8.93)#1,734 |
| 61. | Jamison City | 12.4% | 3.1% (+9.30)#61 | 3.5% (+8.92)#1,736 |
| 62. | Blue Ridge Summit | 12.4% | 3.1% (+9.24)#62 | 3.5% (+8.87)#1,747 |
| 63. | Homewood Borough | 12.2% | 3.1% (+9.09)#63 | 3.5% (+8.71)#1,793 |
| 64. | Mertztown | 12.2% | 3.1% (+9.08)#64 | 3.5% (+8.70)#1,797 |
| 65. | Port Clinton Borough | 12.2% | 3.1% (+9.06)#65 | 3.5% (+8.68)#1,805 |
| 66. | Newton Hamilton Borough | 12.1% | 3.1% (+9.04)#66 | 3.5% (+8.66)#1,810 |
| 67. | Puzzletown | 12.1% | 3.1% (+8.96)#67 | 3.5% (+8.59)#1,831 |
| 68. | New Jerusalem | 12.1% | 3.1% (+8.96)#68 | 3.5% (+8.58)#1,832 |
| 69. | Jamestown Borough | 12.0% | 3.1% (+8.91)#69 | 3.5% (+8.53)#1,849 |
| 70. | Oswayo Borough | 12.0% | 3.1% (+8.89)#70 | 3.5% (+8.52)#1,859 |
| 71. | Forest City Borough | 12.0% | 3.1% (+8.89)#71 | 3.5% (+8.51)#1,862 |
| 72. | University Of Pittsburgh Johnstown | 12.0% | 3.1% (+8.87)#72 | 3.5% (+8.49)#1,868 |
| 73. | Braddock Borough | 11.9% | 3.1% (+8.76)#73 | 3.5% (+8.38)#1,904 |
| 74. | Atlas | 11.6% | 3.1% (+8.49)#74 | 3.5% (+8.11)#1,978 |
| 75. | Wyalusing Borough | 11.5% | 3.1% (+8.43)#75 | 3.5% (+8.06)#1,990 |
| 76. | Snydertown | 11.5% | 3.1% (+8.40)#76 | 3.5% (+8.02)#2,010 |
| 77. | Briar Creek Borough | 11.4% | 3.1% (+8.28)#77 | 3.5% (+7.90)#2,059 |
| 78. | Shippingport Borough | 11.4% | 3.1% (+8.28)#78 | 3.5% (+7.90)#2,060 |
| 79. | Webster | 11.4% | 3.1% (+8.26)#79 | 3.5% (+7.88)#2,070 |
| 80. | Glassport Borough | 11.2% | 3.1% (+8.10)#80 | 3.5% (+7.72)#2,130 |
| 81. | Franklin Borough | 11.2% | 3.1% (+8.08)#81 | 3.5% (+7.70)#2,136 |
| 82. | Warminster Heights | 11.1% | 3.1% (+8.04)#82 | 3.5% (+7.66)#2,143 |
| 83. | Atwood Borough | 11.1% | 3.1% (+8.01)#83 | 3.5% (+7.63)#2,166 |
| 84. | New Holland Borough | 11.0% | 3.1% (+7.87)#84 | 3.5% (+7.50)#2,210 |
| 85. | Sheakleyville Borough | 11.0% | 3.1% (+7.85)#85 | 3.5% (+7.48)#2,222 |
| 86. | Ashley Borough | 10.8% | 3.1% (+7.67)#86 | 3.5% (+7.29)#2,295 |
| 87. | Montandon | 10.6% | 3.1% (+7.52)#87 | 3.5% (+7.14)#2,349 |
| 88. | New Beaver Borough | 10.6% | 3.1% (+7.50)#88 | 3.5% (+7.13)#2,355 |
| 89. | Marlin | 10.6% | 3.1% (+7.46)#89 | 3.5% (+7.09)#2,374 |
| 90. | Corsica Borough | 10.6% | 3.1% (+7.45)#90 | 3.5% (+7.07)#2,377 |
| 91. | Salladasburg Borough | 10.5% | 3.1% (+7.42)#91 | 3.5% (+7.04)#2,387 |
| 92. | Georgetown Cdp Lancaster County | 10.5% | 3.1% (+7.40)#92 | 3.5% (+7.02)#2,399 |
| 93. | Wilmerding Borough | 10.4% | 3.1% (+7.29)#93 | 3.5% (+6.92)#2,453 |
| 94. | Bethel | 10.4% | 3.1% (+7.26)#94 | 3.5% (+6.89)#2,460 |
| 95. | Houtzdale Borough | 10.4% | 3.1% (+7.25)#95 | 3.5% (+6.87)#2,462 |
| 96. | Falmouth | 10.3% | 3.1% (+7.21)#96 | 3.5% (+6.83)#2,476 |
| 97. | Hartstown | 10.3% | 3.1% (+7.19)#97 | 3.5% (+6.81)#2,485 |
| 98. | Hunterstown | 10.3% | 3.1% (+7.16)#98 | 3.5% (+6.79)#2,497 |
| 99. | Strattanville Borough | 10.2% | 3.1% (+7.14)#99 | 3.5% (+6.76)#2,509 |
| 100. | Wakefield | 10.1% | 3.1% (+7.02)#100 | 3.5% (+6.64)#2,559 |
Common Questions
What are the Top 10 Cities with the Highest Percentage of Population Employed in Cleaning & Maintenance in Pennsylvania?
Top 10 Cities with the Highest Percentage of Population Employed in Cleaning & Maintenance in Pennsylvania are:
#1
100.0%
#2
51.9%
#3
45.7%
#4
37.2%
#5
34.6%
#6
24.1%
#7
22.6%
#8
22.5%
#9
21.6%
#10
20.6%
What city has the Highest Percentage of Population Employed in Cleaning & Maintenance in Pennsylvania?
Albrightsville has the Highest Percentage of Population Employed in Cleaning & Maintenance in Pennsylvania with 100.0%.
What is the Percentage of Population Employed in Cleaning & Maintenance in the State of Pennsylvania?
Percentage of Population Employed in Cleaning & Maintenance in Pennsylvania is 3.1%.
What is the Percentage of Population Employed in Cleaning & Maintenance in the United States?
Percentage of Population Employed in Cleaning & Maintenance in the United States is 3.5%.