Cities with the Highest Percentage of Population Employed in Cleaning & Maintenance in Minnesota
RELATED REPORTS & OPTIONS
Cleaning & Maintenance
Minnesota
Compare Cities
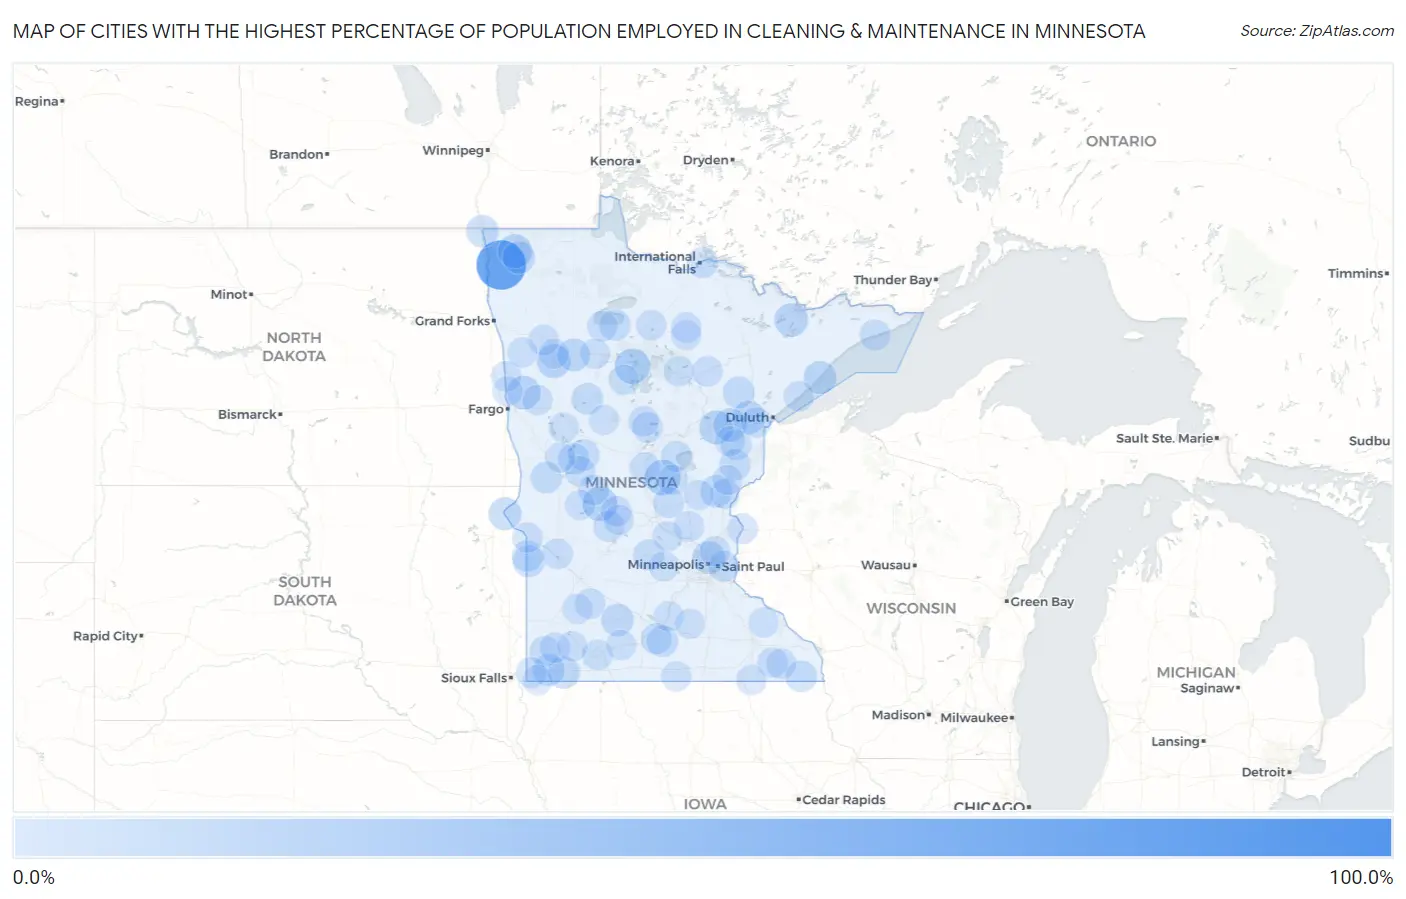
Map of Cities with the Highest Percentage of Population Employed in Cleaning & Maintenance in Minnesota
0.0%
100.0%
Cities with the Highest Percentage of Population Employed in Cleaning & Maintenance in Minnesota
| City | % Employed | vs State | vs National | |
| 1. | Goodland | 100.0% | 3.0%(+97.0)#1 | 3.5%(+96.5)#22 |
| 2. | Donaldson | 77.8% | 3.0%(+74.8)#2 | 3.5%(+74.3)#35 |
| 3. | Lastrup | 26.4% | 3.0%(+23.4)#3 | 3.5%(+22.9)#349 |
| 4. | Cass Lake | 25.5% | 3.0%(+22.5)#4 | 3.5%(+22.0)#372 |
| 5. | Westport | 22.7% | 3.0%(+19.8)#5 | 3.5%(+19.2)#484 |
| 6. | Lake Bronson | 20.6% | 3.0%(+17.6)#6 | 3.5%(+17.1)#592 |
| 7. | Bejou | 20.0% | 3.0%(+17.0)#7 | 3.5%(+16.5)#629 |
| 8. | Tamarack | 20.0% | 3.0%(+17.0)#8 | 3.5%(+16.5)#630 |
| 9. | Felton | 19.5% | 3.0%(+16.6)#9 | 3.5%(+16.1)#668 |
| 10. | Winton | 19.3% | 3.0%(+16.3)#10 | 3.5%(+15.8)#684 |
| 11. | Cromwell | 18.2% | 3.0%(+15.2)#11 | 3.5%(+14.7)#763 |
| 12. | Mahnomen | 17.9% | 3.0%(+15.0)#12 | 3.5%(+14.5)#793 |
| 13. | Beaver Bay | 17.2% | 3.0%(+14.3)#13 | 3.5%(+13.8)#846 |
| 14. | Browns Valley | 16.5% | 3.0%(+13.6)#14 | 3.5%(+13.0)#927 |
| 15. | Hilltop | 16.0% | 3.0%(+13.0)#15 | 3.5%(+12.5)#986 |
| 16. | Lengby | 15.8% | 3.0%(+12.8)#16 | 3.5%(+12.3)#1,008 |
| 17. | Henriette | 15.4% | 3.0%(+12.4)#17 | 3.5%(+11.9)#1,062 |
| 18. | Halma | 15.4% | 3.0%(+12.4)#18 | 3.5%(+11.9)#1,063 |
| 19. | Cobden | 15.4% | 3.0%(+12.4)#19 | 3.5%(+11.9)#1,064 |
| 20. | Rushmore | 14.8% | 3.0%(+11.9)#20 | 3.5%(+11.4)#1,133 |
| 21. | St Vincent | 14.8% | 3.0%(+11.8)#21 | 3.5%(+11.3)#1,144 |
| 22. | Magnolia | 13.4% | 3.0%(+10.5)#22 | 3.5%(+9.96)#1,422 |
| 23. | Meadowlands | 13.0% | 3.0%(+10.00)#23 | 3.5%(+9.48)#1,556 |
| 24. | Marietta | 12.7% | 3.0%(+9.76)#24 | 3.5%(+9.24)#1,633 |
| 25. | Wendell | 12.4% | 3.0%(+9.41)#25 | 3.5%(+8.90)#1,741 |
| 26. | Pine Point | 12.1% | 3.0%(+9.10)#26 | 3.5%(+8.59)#1,829 |
| 27. | Henning | 12.0% | 3.0%(+9.03)#27 | 3.5%(+8.52)#1,855 |
| 28. | Spring Grove | 11.7% | 3.0%(+8.75)#28 | 3.5%(+8.23)#1,945 |
| 29. | Redby | 11.5% | 3.0%(+8.53)#29 | 3.5%(+8.01)#2,013 |
| 30. | Clitherall | 11.3% | 3.0%(+8.35)#30 | 3.5%(+7.84)#2,092 |
| 31. | Askov | 11.3% | 3.0%(+8.31)#31 | 3.5%(+7.80)#2,103 |
| 32. | Good Thunder | 11.2% | 3.0%(+8.23)#32 | 3.5%(+7.72)#2,131 |
| 33. | Dassel | 10.9% | 3.0%(+7.89)#33 | 3.5%(+7.38)#2,258 |
| 34. | Ranier | 10.7% | 3.0%(+7.71)#34 | 3.5%(+7.19)#2,331 |
| 35. | St. John's University | 10.7% | 3.0%(+7.69)#35 | 3.5%(+7.17)#2,337 |
| 36. | Nassau | 10.5% | 3.0%(+7.56)#36 | 3.5%(+7.04)#2,395 |
| 37. | Garden City | 10.5% | 3.0%(+7.52)#37 | 3.5%(+7.00)#2,406 |
| 38. | Belgrade | 10.5% | 3.0%(+7.48)#38 | 3.5%(+6.97)#2,423 |
| 39. | Jenkins | 10.0% | 3.0%(+7.07)#39 | 3.5%(+6.56)#2,599 |
| 40. | Landfall | 10.0% | 3.0%(+7.03)#40 | 3.5%(+6.52)#2,614 |
| 41. | Grand Marais | 9.9% | 3.0%(+6.97)#41 | 3.5%(+6.46)#2,662 |
| 42. | Dresbach | 9.9% | 3.0%(+6.95)#42 | 3.5%(+6.43)#2,676 |
| 43. | Moose Lake | 9.9% | 3.0%(+6.92)#43 | 3.5%(+6.40)#2,699 |
| 44. | Gilman | 9.7% | 3.0%(+6.71)#44 | 3.5%(+6.19)#2,799 |
| 45. | Garrison | 9.5% | 3.0%(+6.56)#45 | 3.5%(+6.04)#2,880 |
| 46. | Fort Ripley | 9.4% | 3.0%(+6.41)#46 | 3.5%(+5.89)#2,969 |
| 47. | Edgerton | 9.4% | 3.0%(+6.40)#47 | 3.5%(+5.89)#2,971 |
| 48. | Milan | 9.3% | 3.0%(+6.35)#48 | 3.5%(+5.83)#2,988 |
| 49. | Seaforth | 9.3% | 3.0%(+6.33)#49 | 3.5%(+5.82)#2,999 |
| 50. | Nelson | 9.3% | 3.0%(+6.29)#50 | 3.5%(+5.78)#3,020 |
| 51. | Mentor | 9.1% | 3.0%(+6.12)#51 | 3.5%(+5.61)#3,111 |
| 52. | Wilder | 9.1% | 3.0%(+6.12)#52 | 3.5%(+5.61)#3,124 |
| 53. | Hillman | 9.1% | 3.0%(+6.12)#53 | 3.5%(+5.61)#3,126 |
| 54. | Beaver Creek | 9.0% | 3.0%(+6.00)#54 | 3.5%(+5.48)#3,196 |
| 55. | Taylors Falls | 8.9% | 3.0%(+5.90)#55 | 3.5%(+5.39)#3,277 |
| 56. | Zimmerman | 8.8% | 3.0%(+5.79)#56 | 3.5%(+5.27)#3,358 |
| 57. | Little Rock | 8.7% | 3.0%(+5.74)#57 | 3.5%(+5.23)#3,382 |
| 58. | Chandler | 8.5% | 3.0%(+5.50)#58 | 3.5%(+4.98)#3,566 |
| 59. | Meire Grove | 8.4% | 3.0%(+5.45)#59 | 3.5%(+4.94)#3,604 |
| 60. | Northome | 8.4% | 3.0%(+5.44)#60 | 3.5%(+4.93)#3,608 |
| 61. | Hendrum | 8.3% | 3.0%(+5.37)#61 | 3.5%(+4.85)#3,673 |
| 62. | Pine River | 8.3% | 3.0%(+5.34)#62 | 3.5%(+4.83)#3,698 |
| 63. | Calumet | 8.2% | 3.0%(+5.28)#63 | 3.5%(+4.76)#3,744 |
| 64. | Effie | 8.2% | 3.0%(+5.20)#64 | 3.5%(+4.68)#3,830 |
| 65. | Pine City | 8.1% | 3.0%(+5.17)#65 | 3.5%(+4.66)#3,852 |
| 66. | Two Harbors | 8.1% | 3.0%(+5.10)#66 | 3.5%(+4.59)#3,901 |
| 67. | Urbank | 8.0% | 3.0%(+5.03)#67 | 3.5%(+4.52)#3,973 |
| 68. | Fountain | 8.0% | 3.0%(+4.99)#68 | 3.5%(+4.48)#3,997 |
| 69. | Zemple | 7.9% | 3.0%(+4.97)#69 | 3.5%(+4.45)#4,017 |
| 70. | Lanesboro | 7.9% | 3.0%(+4.95)#70 | 3.5%(+4.43)#4,041 |
| 71. | Hitterdal | 7.9% | 3.0%(+4.91)#71 | 3.5%(+4.39)#4,084 |
| 72. | Ortonville | 7.9% | 3.0%(+4.90)#72 | 3.5%(+4.39)#4,086 |
| 73. | Milroy | 7.8% | 3.0%(+4.86)#73 | 3.5%(+4.34)#4,124 |
| 74. | Spring Hill | 7.8% | 3.0%(+4.84)#74 | 3.5%(+4.33)#4,137 |
| 75. | Underwood | 7.8% | 3.0%(+4.84)#75 | 3.5%(+4.32)#4,142 |
| 76. | Butterfield | 7.8% | 3.0%(+4.82)#76 | 3.5%(+4.31)#4,155 |
| 77. | Bigfork | 7.7% | 3.0%(+4.72)#77 | 3.5%(+4.21)#4,232 |
| 78. | Beltrami | 7.7% | 3.0%(+4.72)#78 | 3.5%(+4.21)#4,247 |
| 79. | Georgetown | 7.7% | 3.0%(+4.72)#79 | 3.5%(+4.21)#4,249 |
| 80. | Laporte | 7.7% | 3.0%(+4.72)#80 | 3.5%(+4.21)#4,253 |
| 81. | Winsted | 7.7% | 3.0%(+4.70)#81 | 3.5%(+4.19)#4,265 |
| 82. | Scanlon | 7.6% | 3.0%(+4.68)#82 | 3.5%(+4.16)#4,285 |
| 83. | St Peter | 7.6% | 3.0%(+4.62)#83 | 3.5%(+4.10)#4,341 |
| 84. | Circle Pines | 7.6% | 3.0%(+4.62)#84 | 3.5%(+4.10)#4,342 |
| 85. | Silver Creek | 7.6% | 3.0%(+4.61)#85 | 3.5%(+4.09)#4,353 |
| 86. | Steen | 7.5% | 3.0%(+4.58)#86 | 3.5%(+4.06)#4,377 |
| 87. | Lowry | 7.5% | 3.0%(+4.55)#87 | 3.5%(+4.03)#4,404 |
| 88. | Le Roy | 7.5% | 3.0%(+4.50)#88 | 3.5%(+3.98)#4,441 |
| 89. | Crown College | 7.5% | 3.0%(+4.50)#89 | 3.5%(+3.98)#4,443 |
| 90. | Kettle River | 7.4% | 3.0%(+4.44)#90 | 3.5%(+3.92)#4,516 |
| 91. | Bricelyn | 7.3% | 3.0%(+4.37)#91 | 3.5%(+3.85)#4,596 |
| 92. | Shevlin | 7.3% | 3.0%(+4.35)#92 | 3.5%(+3.83)#4,620 |
| 93. | Winger | 7.3% | 3.0%(+4.35)#93 | 3.5%(+3.83)#4,621 |
| 94. | Avoca | 7.3% | 3.0%(+4.35)#94 | 3.5%(+3.83)#4,622 |
| 95. | Waterville | 7.3% | 3.0%(+4.33)#95 | 3.5%(+3.82)#4,636 |
| 96. | Ogilvie | 7.2% | 3.0%(+4.27)#96 | 3.5%(+3.76)#4,692 |
| 97. | Vergas | 7.2% | 3.0%(+4.24)#97 | 3.5%(+3.72)#4,719 |
| 98. | Millville | 7.1% | 3.0%(+4.18)#98 | 3.5%(+3.66)#4,782 |
| 99. | Menahga | 7.1% | 3.0%(+4.16)#99 | 3.5%(+3.64)#4,803 |
| 100. | Hinckley | 7.1% | 3.0%(+4.09)#100 | 3.5%(+3.57)#4,861 |
Common Questions
What are the Top 10 Cities with the Highest Percentage of Population Employed in Cleaning & Maintenance in Minnesota?
Top 10 Cities with the Highest Percentage of Population Employed in Cleaning & Maintenance in Minnesota are:
What city has the Highest Percentage of Population Employed in Cleaning & Maintenance in Minnesota?
Donaldson has the Highest Percentage of Population Employed in Cleaning & Maintenance in Minnesota with 77.8%.
What is the Percentage of Population Employed in Cleaning & Maintenance in the State of Minnesota?
Percentage of Population Employed in Cleaning & Maintenance in Minnesota is 3.0%.
What is the Percentage of Population Employed in Cleaning & Maintenance in the United States?
Percentage of Population Employed in Cleaning & Maintenance in the United States is 3.5%.