Cities with the Highest Percentage of Population Employed in Cleaning & Maintenance in Ohio
RELATED REPORTS & OPTIONS
Cleaning & Maintenance
Ohio
Compare Cities
Map of Cities with the Highest Percentage of Population Employed in Cleaning & Maintenance in Ohio
0.0%
80.0%
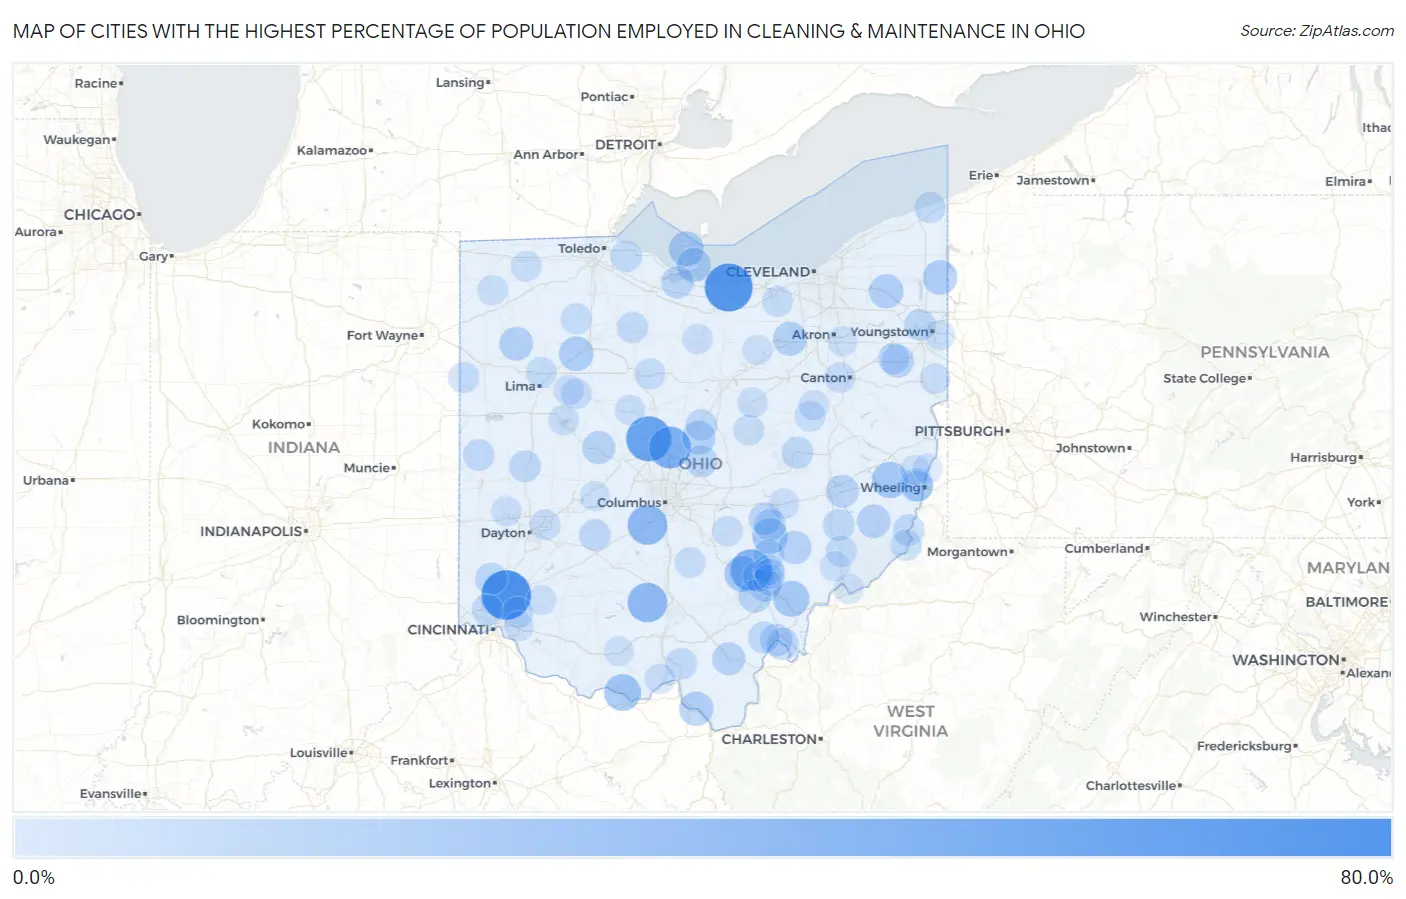
Cities with the Highest Percentage of Population Employed in Cleaning & Maintenance in Ohio
| City | % Employed | vs State | vs National | |
| 1. | Olde West Chester | 68.5% | 3.2%(+65.3)#1 | 3.5%(+65.0)#44 |
| 2. | Beulah Beach | 63.2% | 3.2%(+59.9)#2 | 3.5%(+59.7)#51 |
| 3. | Radnor | 54.7% | 3.2%(+51.5)#3 | 3.5%(+51.2)#67 |
| 4. | Kilbourne | 44.4% | 3.2%(+41.2)#4 | 3.5%(+41.0)#117 |
| 5. | Carbon Hill | 43.5% | 3.2%(+40.3)#5 | 3.5%(+40.0)#121 |
| 6. | Orient | 37.5% | 3.2%(+34.3)#6 | 3.5%(+34.0)#164 |
| 7. | Bourneville | 37.4% | 3.2%(+34.2)#7 | 3.5%(+33.9)#168 |
| 8. | Rome Stout | 28.6% | 3.2%(+25.4)#8 | 3.5%(+25.1)#302 |
| 9. | Lafferty | 26.9% | 3.2%(+23.7)#9 | 3.5%(+23.4)#335 |
| 10. | Stewart | 26.4% | 3.2%(+23.2)#10 | 3.5%(+22.9)#348 |
| 11. | Haydenville | 26.2% | 3.2%(+23.0)#11 | 3.5%(+22.7)#355 |
| 12. | Rose Farm | 25.0% | 3.2%(+21.8)#12 | 3.5%(+21.5)#391 |
| 13. | Hamburg | 24.3% | 3.2%(+21.1)#13 | 3.5%(+20.8)#417 |
| 14. | Put In Bay | 23.3% | 3.2%(+20.0)#14 | 3.5%(+19.8)#458 |
| 15. | Rawson | 22.3% | 3.2%(+19.1)#15 | 3.5%(+18.8)#502 |
| 16. | Kinsman Center | 22.1% | 3.2%(+18.9)#16 | 3.5%(+18.6)#523 |
| 17. | Hanging Rock | 21.3% | 3.2%(+18.1)#17 | 3.5%(+17.9)#554 |
| 18. | Parkman | 21.2% | 3.2%(+18.0)#18 | 3.5%(+17.8)#558 |
| 19. | Lakeside | 21.1% | 3.2%(+17.8)#19 | 3.5%(+17.6)#564 |
| 20. | Gloria Glens Park | 20.4% | 3.2%(+17.2)#20 | 3.5%(+16.9)#607 |
| 21. | Cloverdale | 19.6% | 3.2%(+16.4)#21 | 3.5%(+16.2)#657 |
| 22. | Sparta | 19.2% | 3.2%(+16.0)#22 | 3.5%(+15.7)#690 |
| 23. | Miltonsburg | 19.0% | 3.2%(+15.8)#23 | 3.5%(+15.6)#698 |
| 24. | East Liberty | 18.3% | 3.2%(+15.1)#24 | 3.5%(+14.8)#748 |
| 25. | Malta | 18.2% | 3.2%(+15.0)#25 | 3.5%(+14.7)#759 |
| 26. | Lansing | 17.9% | 3.2%(+14.7)#26 | 3.5%(+14.4)#794 |
| 27. | Centerville Thurman | 17.6% | 3.2%(+14.4)#27 | 3.5%(+14.2)#814 |
| 28. | Chauncey | 17.6% | 3.2%(+14.4)#28 | 3.5%(+14.1)#815 |
| 29. | Old Washington | 17.4% | 3.2%(+14.2)#29 | 3.5%(+13.9)#837 |
| 30. | Damascus | 17.1% | 3.2%(+13.9)#30 | 3.5%(+13.6)#865 |
| 31. | New Marshfield | 16.5% | 3.2%(+13.3)#31 | 3.5%(+13.0)#934 |
| 32. | Whites Landing | 16.4% | 3.2%(+13.2)#32 | 3.5%(+12.9)#945 |
| 33. | East Fultonham | 16.1% | 3.2%(+12.9)#33 | 3.5%(+12.6)#978 |
| 34. | Hartford Croton | 15.6% | 3.2%(+12.4)#34 | 3.5%(+12.2)#1,024 |
| 35. | Roseville | 15.5% | 3.2%(+12.3)#35 | 3.5%(+12.0)#1,048 |
| 36. | Pomeroy | 15.3% | 3.2%(+12.1)#36 | 3.5%(+11.8)#1,069 |
| 37. | Syracuse | 15.2% | 3.2%(+12.0)#37 | 3.5%(+11.8)#1,074 |
| 38. | Williamsdale | 14.9% | 3.2%(+11.7)#38 | 3.5%(+11.4)#1,128 |
| 39. | Buchtel | 14.4% | 3.2%(+11.1)#39 | 3.5%(+10.9)#1,225 |
| 40. | Rutland | 14.1% | 3.2%(+10.9)#40 | 3.5%(+10.6)#1,273 |
| 41. | Canal Lewisville | 14.0% | 3.2%(+10.8)#41 | 3.5%(+10.6)#1,287 |
| 42. | Jersey | 14.0% | 3.2%(+10.8)#42 | 3.5%(+10.6)#1,288 |
| 43. | Lockington | 14.0% | 3.2%(+10.7)#43 | 3.5%(+10.5)#1,309 |
| 44. | Sarahsville | 14.0% | 3.2%(+10.7)#44 | 3.5%(+10.5)#1,310 |
| 45. | Chesterville | 13.9% | 3.2%(+10.7)#45 | 3.5%(+10.4)#1,327 |
| 46. | South Solon | 13.9% | 3.2%(+10.7)#46 | 3.5%(+10.4)#1,331 |
| 47. | Clarington | 13.8% | 3.2%(+10.6)#47 | 3.5%(+10.3)#1,340 |
| 48. | Mineral Ridge | 13.8% | 3.2%(+10.6)#48 | 3.5%(+10.3)#1,343 |
| 49. | Rossburg | 13.7% | 3.2%(+10.5)#49 | 3.5%(+10.2)#1,366 |
| 50. | Miamiville | 13.5% | 3.2%(+10.3)#50 | 3.5%(+10.0)#1,414 |
| 51. | Skyline Acres | 13.4% | 3.2%(+10.2)#51 | 3.5%(+9.91)#1,438 |
| 52. | Beloit | 13.3% | 3.2%(+10.1)#52 | 3.5%(+9.81)#1,463 |
| 53. | Bascom | 13.1% | 3.2%(+9.90)#53 | 3.5%(+9.63)#1,502 |
| 54. | Hannibal | 13.1% | 3.2%(+9.90)#54 | 3.5%(+9.63)#1,503 |
| 55. | Williston | 13.0% | 3.2%(+9.83)#55 | 3.5%(+9.56)#1,525 |
| 56. | Minford | 13.0% | 3.2%(+9.79)#56 | 3.5%(+9.52)#1,544 |
| 57. | Corning | 12.8% | 3.2%(+9.62)#57 | 3.5%(+9.36)#1,594 |
| 58. | Macksburg | 12.5% | 3.2%(+9.29)#58 | 3.5%(+9.02)#1,691 |
| 59. | Wren | 12.4% | 3.2%(+9.14)#59 | 3.5%(+8.88)#1,744 |
| 60. | Massieville | 12.3% | 3.2%(+9.06)#60 | 3.5%(+8.79)#1,767 |
| 61. | Millfield | 12.3% | 3.2%(+9.05)#61 | 3.5%(+8.78)#1,770 |
| 62. | North Kingsville | 12.2% | 3.2%(+8.95)#62 | 3.5%(+8.68)#1,801 |
| 63. | Cairo | 12.0% | 3.2%(+8.80)#63 | 3.5%(+8.53)#1,850 |
| 64. | Eaton Estates | 12.0% | 3.2%(+8.79)#64 | 3.5%(+8.52)#1,853 |
| 65. | Nevada | 11.9% | 3.2%(+8.71)#65 | 3.5%(+8.44)#1,886 |
| 66. | Hoytville | 11.7% | 3.2%(+8.45)#66 | 3.5%(+8.18)#1,958 |
| 67. | Wright Patterson Afb | 11.5% | 3.2%(+8.30)#67 | 3.5%(+8.04)#2,006 |
| 68. | Pettisville | 11.5% | 3.2%(+8.24)#68 | 3.5%(+7.97)#2,027 |
| 69. | Wolfhurst | 11.4% | 3.2%(+8.16)#69 | 3.5%(+7.89)#2,063 |
| 70. | Walnut Creek | 11.3% | 3.2%(+8.13)#70 | 3.5%(+7.86)#2,082 |
| 71. | West Rushville | 11.2% | 3.2%(+8.00)#71 | 3.5%(+7.73)#2,125 |
| 72. | Glouster | 11.1% | 3.2%(+7.92)#72 | 3.5%(+7.65)#2,148 |
| 73. | Danville | 11.1% | 3.2%(+7.86)#73 | 3.5%(+7.59)#2,181 |
| 74. | Perry Heights | 11.0% | 3.2%(+7.75)#74 | 3.5%(+7.48)#2,218 |
| 75. | Mcguffey | 10.9% | 3.2%(+7.70)#75 | 3.5%(+7.44)#2,243 |
| 76. | Tarlton | 10.8% | 3.2%(+7.62)#76 | 3.5%(+7.35)#2,272 |
| 77. | Chippewa Park | 10.7% | 3.2%(+7.49)#77 | 3.5%(+7.22)#2,323 |
| 78. | Pleasant Grove | 10.6% | 3.2%(+7.34)#78 | 3.5%(+7.07)#2,376 |
| 79. | Rogers | 10.5% | 3.2%(+7.26)#79 | 3.5%(+6.99)#2,410 |
| 80. | Alger | 10.4% | 3.2%(+7.17)#80 | 3.5%(+6.90)#2,458 |
| 81. | Ney | 10.3% | 3.2%(+7.13)#81 | 3.5%(+6.86)#2,464 |
| 82. | West Portsmouth | 10.3% | 3.2%(+7.06)#82 | 3.5%(+6.79)#2,491 |
| 83. | Loudonville | 10.2% | 3.2%(+7.00)#83 | 3.5%(+6.73)#2,519 |
| 84. | Phillipsburg | 10.2% | 3.2%(+6.95)#84 | 3.5%(+6.69)#2,537 |
| 85. | Willard | 10.1% | 3.2%(+6.85)#85 | 3.5%(+6.58)#2,585 |
| 86. | Jacksonville | 9.9% | 3.2%(+6.65)#86 | 3.5%(+6.39)#2,709 |
| 87. | New Bloomington | 9.7% | 3.2%(+6.46)#87 | 3.5%(+6.19)#2,798 |
| 88. | Reno | 9.6% | 3.2%(+6.41)#88 | 3.5%(+6.15)#2,824 |
| 89. | Winesburg | 9.6% | 3.2%(+6.37)#89 | 3.5%(+6.10)#2,854 |
| 90. | Butlerville | 9.6% | 3.2%(+6.36)#90 | 3.5%(+6.09)#2,858 |
| 91. | Campbell | 9.5% | 3.2%(+6.32)#91 | 3.5%(+6.05)#2,874 |
| 92. | Cinnamon Lake | 9.5% | 3.2%(+6.29)#92 | 3.5%(+6.02)#2,891 |
| 93. | Summerside | 9.4% | 3.2%(+6.17)#93 | 3.5%(+5.90)#2,953 |
| 94. | Sawyerwood | 9.4% | 3.2%(+6.15)#94 | 3.5%(+5.88)#2,973 |
| 95. | Lowell | 9.3% | 3.2%(+6.13)#95 | 3.5%(+5.86)#2,977 |
| 96. | Catawba | 9.3% | 3.2%(+6.04)#96 | 3.5%(+5.78)#3,018 |
| 97. | Mount Pleasant | 9.2% | 3.2%(+6.02)#97 | 3.5%(+5.75)#3,030 |
| 98. | Peebles | 9.2% | 3.2%(+6.01)#98 | 3.5%(+5.74)#3,039 |
| 99. | Medway | 9.2% | 3.2%(+6.00)#99 | 3.5%(+5.73)#3,043 |
| 100. | Rayland | 9.2% | 3.2%(+5.94)#100 | 3.5%(+5.67)#3,067 |
Common Questions
What are the Top 10 Cities with the Highest Percentage of Population Employed in Cleaning & Maintenance in Ohio?
Top 10 Cities with the Highest Percentage of Population Employed in Cleaning & Maintenance in Ohio are:
#1
68.5%
#2
63.2%
#3
54.7%
#4
44.4%
#5
43.5%
#6
37.5%
#7
37.4%
#8
28.6%
#9
26.9%
#10
26.4%
What city has the Highest Percentage of Population Employed in Cleaning & Maintenance in Ohio?
Olde West Chester has the Highest Percentage of Population Employed in Cleaning & Maintenance in Ohio with 68.5%.
What is the Percentage of Population Employed in Cleaning & Maintenance in the State of Ohio?
Percentage of Population Employed in Cleaning & Maintenance in Ohio is 3.2%.
What is the Percentage of Population Employed in Cleaning & Maintenance in the United States?
Percentage of Population Employed in Cleaning & Maintenance in the United States is 3.5%.