Cities with the Highest Percentage of Population Employed in Cleaning & Maintenance in Mississippi
RELATED REPORTS & OPTIONS
Cleaning & Maintenance
Mississippi
Compare Cities
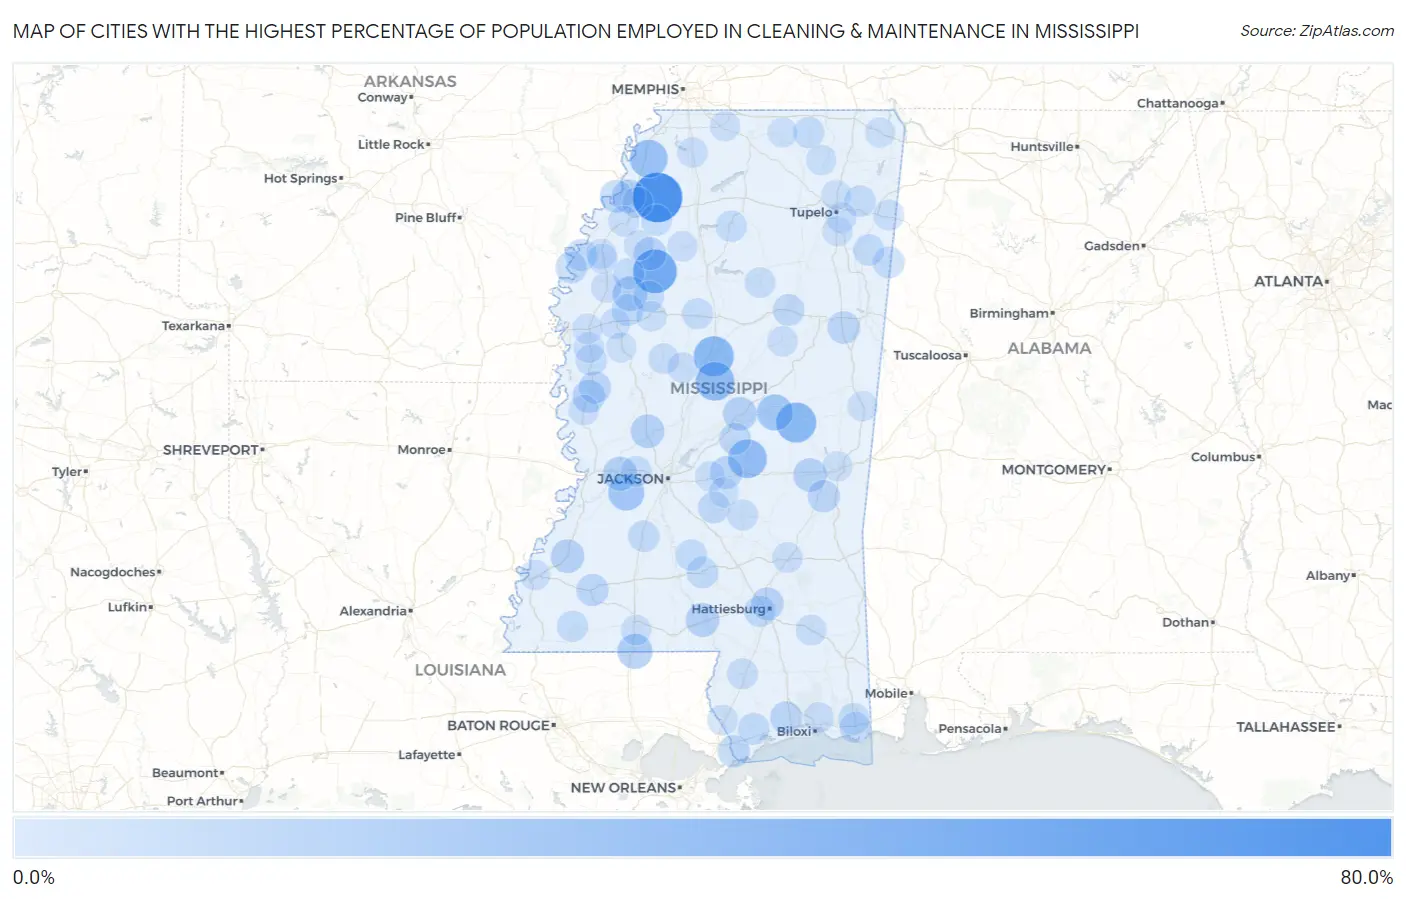
Map of Cities with the Highest Percentage of Population Employed in Cleaning & Maintenance in Mississippi
0.0%
80.0%
Cities with the Highest Percentage of Population Employed in Cleaning & Maintenance in Mississippi
| City | % Employed | vs State | vs National | |
| 1. | Darling | 60.8% | 3.6%(+57.2)#1 | 3.5%(+57.3)#52 |
| 2. | Glendora | 43.5% | 3.6%(+39.9)#2 | 3.5%(+40.0)#120 |
| 3. | Bogue Chitto Cdp Kemper And Neshoba Counties | 36.3% | 3.6%(+32.7)#3 | 3.5%(+32.8)#175 |
| 4. | Tucker | 33.3% | 3.6%(+29.8)#4 | 3.5%(+29.9)#210 |
| 5. | West | 33.3% | 3.6%(+29.8)#5 | 3.5%(+29.9)#213 |
| 6. | Kirkville | 32.4% | 3.6%(+28.8)#6 | 3.5%(+28.9)#231 |
| 7. | Sallis | 29.5% | 3.6%(+25.9)#7 | 3.5%(+26.0)#275 |
| 8. | Hillsboro | 29.4% | 3.6%(+25.8)#8 | 3.5%(+25.9)#278 |
| 9. | White Oak | 27.1% | 3.6%(+23.6)#9 | 3.5%(+23.7)#329 |
| 10. | Redwood | 26.1% | 3.6%(+22.5)#10 | 3.5%(+22.6)#357 |
| 11. | Learned | 22.2% | 3.6%(+18.7)#11 | 3.5%(+18.7)#512 |
| 12. | Pearl River | 22.1% | 3.6%(+18.6)#12 | 3.5%(+18.6)#521 |
| 13. | Osyka | 19.2% | 3.6%(+15.6)#13 | 3.5%(+15.7)#689 |
| 14. | Doddsville | 18.2% | 3.6%(+14.6)#14 | 3.5%(+14.7)#764 |
| 15. | Edwards | 16.4% | 3.6%(+12.8)#15 | 3.5%(+12.9)#944 |
| 16. | De Soto | 15.6% | 3.6%(+12.0)#16 | 3.5%(+12.1)#1,028 |
| 17. | Redwater | 15.5% | 3.6%(+12.0)#17 | 3.5%(+12.1)#1,039 |
| 18. | Foxworth | 15.4% | 3.6%(+11.8)#18 | 3.5%(+11.9)#1,054 |
| 19. | Chunky | 15.1% | 3.6%(+11.6)#19 | 3.5%(+11.6)#1,088 |
| 20. | Bentonia | 15.0% | 3.6%(+11.5)#20 | 3.5%(+11.6)#1,104 |
| 21. | Fayette | 14.9% | 3.6%(+11.4)#21 | 3.5%(+11.4)#1,122 |
| 22. | Coahoma | 14.5% | 3.6%(+11.0)#22 | 3.5%(+11.0)#1,205 |
| 23. | Glendale | 13.0% | 3.6%(+9.44)#23 | 3.5%(+9.52)#1,543 |
| 24. | Rolling Fork | 12.9% | 3.6%(+9.34)#24 | 3.5%(+9.42)#1,573 |
| 25. | Webb | 12.9% | 3.6%(+9.30)#25 | 3.5%(+9.37)#1,588 |
| 26. | Friars Point | 12.8% | 3.6%(+9.20)#26 | 3.5%(+9.28)#1,623 |
| 27. | Morton | 12.6% | 3.6%(+9.05)#27 | 3.5%(+9.13)#1,659 |
| 28. | Artesia | 12.5% | 3.6%(+8.94)#28 | 3.5%(+9.02)#1,683 |
| 29. | Pearlington | 11.9% | 3.6%(+8.38)#29 | 3.5%(+8.45)#1,882 |
| 30. | Lyman | 11.8% | 3.6%(+8.25)#30 | 3.5%(+8.32)#1,918 |
| 31. | Anguilla | 11.6% | 3.6%(+8.02)#31 | 3.5%(+8.10)#1,981 |
| 32. | Enterprise | 11.5% | 3.6%(+7.98)#32 | 3.5%(+8.06)#1,991 |
| 33. | Bude | 11.5% | 3.6%(+7.95)#33 | 3.5%(+8.03)#2,007 |
| 34. | Rena Lara | 11.3% | 3.6%(+7.78)#34 | 3.5%(+7.86)#2,085 |
| 35. | Hermanville | 10.6% | 3.6%(+7.02)#35 | 3.5%(+7.09)#2,369 |
| 36. | Lena | 10.5% | 3.6%(+6.97)#36 | 3.5%(+7.04)#2,390 |
| 37. | Gunnison | 10.5% | 3.6%(+6.91)#37 | 3.5%(+6.98)#2,414 |
| 38. | Rosedale | 10.3% | 3.6%(+6.73)#38 | 3.5%(+6.81)#2,486 |
| 39. | Sunflower | 10.3% | 3.6%(+6.69)#39 | 3.5%(+6.77)#2,506 |
| 40. | Puckett | 10.2% | 3.6%(+6.62)#40 | 3.5%(+6.70)#2,531 |
| 41. | Mathiston | 10.1% | 3.6%(+6.56)#41 | 3.5%(+6.63)#2,561 |
| 42. | Gattman | 10.0% | 3.6%(+6.44)#42 | 3.5%(+6.52)#2,632 |
| 43. | Biggersville | 10.0% | 3.6%(+6.44)#43 | 3.5%(+6.52)#2,633 |
| 44. | Prentiss | 9.9% | 3.6%(+6.35)#44 | 3.5%(+6.43)#2,677 |
| 45. | West Hattiesburg | 9.6% | 3.6%(+6.06)#45 | 3.5%(+6.14)#2,830 |
| 46. | Kiln | 9.5% | 3.6%(+5.94)#46 | 3.5%(+6.01)#2,895 |
| 47. | Mantachie | 9.5% | 3.6%(+5.92)#47 | 3.5%(+6.00)#2,903 |
| 48. | Hazlehurst | 9.4% | 3.6%(+5.82)#48 | 3.5%(+5.90)#2,955 |
| 49. | Hatley | 9.3% | 3.6%(+5.79)#49 | 3.5%(+5.87)#2,976 |
| 50. | Hollandale | 9.2% | 3.6%(+5.60)#50 | 3.5%(+5.68)#3,063 |
| 51. | Escatawpa | 9.1% | 3.6%(+5.58)#51 | 3.5%(+5.66)#3,076 |
| 52. | Water Valley | 9.1% | 3.6%(+5.51)#52 | 3.5%(+5.58)#3,139 |
| 53. | Lambert | 9.0% | 3.6%(+5.48)#53 | 3.5%(+5.56)#3,154 |
| 54. | Moss Point | 9.0% | 3.6%(+5.43)#54 | 3.5%(+5.51)#3,182 |
| 55. | Drew | 8.9% | 3.6%(+5.38)#55 | 3.5%(+5.46)#3,211 |
| 56. | Schlater | 8.9% | 3.6%(+5.33)#56 | 3.5%(+5.41)#3,258 |
| 57. | New Hebron | 8.8% | 3.6%(+5.28)#57 | 3.5%(+5.36)#3,303 |
| 58. | Falkner | 8.8% | 3.6%(+5.23)#58 | 3.5%(+5.30)#3,333 |
| 59. | Gloster | 8.7% | 3.6%(+5.10)#59 | 3.5%(+5.18)#3,435 |
| 60. | North Carrollton | 8.4% | 3.6%(+4.84)#60 | 3.5%(+4.91)#3,620 |
| 61. | Raleigh | 8.2% | 3.6%(+4.68)#61 | 3.5%(+4.75)#3,760 |
| 62. | Poplarville | 8.2% | 3.6%(+4.63)#62 | 3.5%(+4.70)#3,806 |
| 63. | Jonestown | 8.1% | 3.6%(+4.57)#63 | 3.5%(+4.65)#3,855 |
| 64. | Arkabutla | 8.0% | 3.6%(+4.44)#64 | 3.5%(+4.52)#3,967 |
| 65. | Tremont | 7.8% | 3.6%(+4.27)#65 | 3.5%(+4.34)#4,123 |
| 66. | Beaumont | 7.5% | 3.6%(+3.98)#66 | 3.5%(+4.06)#4,379 |
| 67. | Bolton | 7.5% | 3.6%(+3.96)#67 | 3.5%(+4.04)#4,393 |
| 68. | Slate Springs | 7.5% | 3.6%(+3.94)#68 | 3.5%(+4.02)#4,416 |
| 69. | Tchula | 7.4% | 3.6%(+3.84)#69 | 3.5%(+3.91)#4,528 |
| 70. | Arcola | 7.3% | 3.6%(+3.76)#70 | 3.5%(+3.83)#4,616 |
| 71. | Indianola | 7.3% | 3.6%(+3.74)#71 | 3.5%(+3.82)#4,637 |
| 72. | Clarksdale | 7.3% | 3.6%(+3.72)#72 | 3.5%(+3.79)#4,651 |
| 73. | Latimer | 7.3% | 3.6%(+3.70)#73 | 3.5%(+3.77)#4,671 |
| 74. | Boyle | 7.2% | 3.6%(+3.68)#74 | 3.5%(+3.75)#4,696 |
| 75. | Laurel | 7.0% | 3.6%(+3.47)#75 | 3.5%(+3.55)#4,890 |
| 76. | Cary | 7.0% | 3.6%(+3.43)#76 | 3.5%(+3.51)#4,949 |
| 77. | Lexington | 6.9% | 3.6%(+3.39)#77 | 3.5%(+3.46)#4,991 |
| 78. | Nicholson | 6.9% | 3.6%(+3.36)#78 | 3.5%(+3.44)#5,024 |
| 79. | Plantersville | 6.9% | 3.6%(+3.35)#79 | 3.5%(+3.42)#5,041 |
| 80. | Magnolia | 6.8% | 3.6%(+3.29)#80 | 3.5%(+3.36)#5,131 |
| 81. | Ackerman | 6.8% | 3.6%(+3.28)#81 | 3.5%(+3.36)#5,137 |
| 82. | Charleston | 6.8% | 3.6%(+3.22)#82 | 3.5%(+3.30)#5,219 |
| 83. | Morgantown | 6.7% | 3.6%(+3.18)#83 | 3.5%(+3.25)#5,271 |
| 84. | Itta Bena | 6.6% | 3.6%(+3.08)#84 | 3.5%(+3.16)#5,400 |
| 85. | Pelahatchie | 6.5% | 3.6%(+2.97)#85 | 3.5%(+3.04)#5,551 |
| 86. | Dumas | 6.5% | 3.6%(+2.93)#86 | 3.5%(+3.01)#5,603 |
| 87. | Coldwater | 6.5% | 3.6%(+2.89)#87 | 3.5%(+2.97)#5,659 |
| 88. | Leland | 6.4% | 3.6%(+2.83)#88 | 3.5%(+2.90)#5,747 |
| 89. | Byhalia | 6.4% | 3.6%(+2.80)#89 | 3.5%(+2.88)#5,784 |
| 90. | Shelby | 6.3% | 3.6%(+2.73)#90 | 3.5%(+2.81)#5,898 |
| 91. | Tutwiler | 6.2% | 3.6%(+2.69)#91 | 3.5%(+2.77)#5,952 |
| 92. | Scooba | 6.2% | 3.6%(+2.69)#92 | 3.5%(+2.77)#5,955 |
| 93. | Winstonville | 6.2% | 3.6%(+2.69)#93 | 3.5%(+2.77)#5,992 |
| 94. | Polkville | 6.2% | 3.6%(+2.59)#94 | 3.5%(+2.67)#6,133 |
| 95. | Shannon | 6.1% | 3.6%(+2.56)#95 | 3.5%(+2.64)#6,187 |
| 96. | Saltillo | 6.1% | 3.6%(+2.55)#96 | 3.5%(+2.63)#6,199 |
| 97. | Isola | 6.1% | 3.6%(+2.51)#97 | 3.5%(+2.59)#6,246 |
| 98. | Meridian | 6.1% | 3.6%(+2.50)#98 | 3.5%(+2.58)#6,256 |
| 99. | Burnsville | 6.0% | 3.6%(+2.43)#99 | 3.5%(+2.51)#6,381 |
| 100. | Ashland | 6.0% | 3.6%(+2.43)#100 | 3.5%(+2.51)#6,392 |
Common Questions
What are the Top 10 Cities with the Highest Percentage of Population Employed in Cleaning & Maintenance in Mississippi?
Top 10 Cities with the Highest Percentage of Population Employed in Cleaning & Maintenance in Mississippi are:
What city has the Highest Percentage of Population Employed in Cleaning & Maintenance in Mississippi?
Darling has the Highest Percentage of Population Employed in Cleaning & Maintenance in Mississippi with 60.8%.
What is the Percentage of Population Employed in Cleaning & Maintenance in the State of Mississippi?
Percentage of Population Employed in Cleaning & Maintenance in Mississippi is 3.6%.
What is the Percentage of Population Employed in Cleaning & Maintenance in the United States?
Percentage of Population Employed in Cleaning & Maintenance in the United States is 3.5%.