Cities with the Highest Percentage of Population Employed in Cleaning & Maintenance in Indiana
RELATED REPORTS & OPTIONS
Cleaning & Maintenance
Indiana
Compare Cities
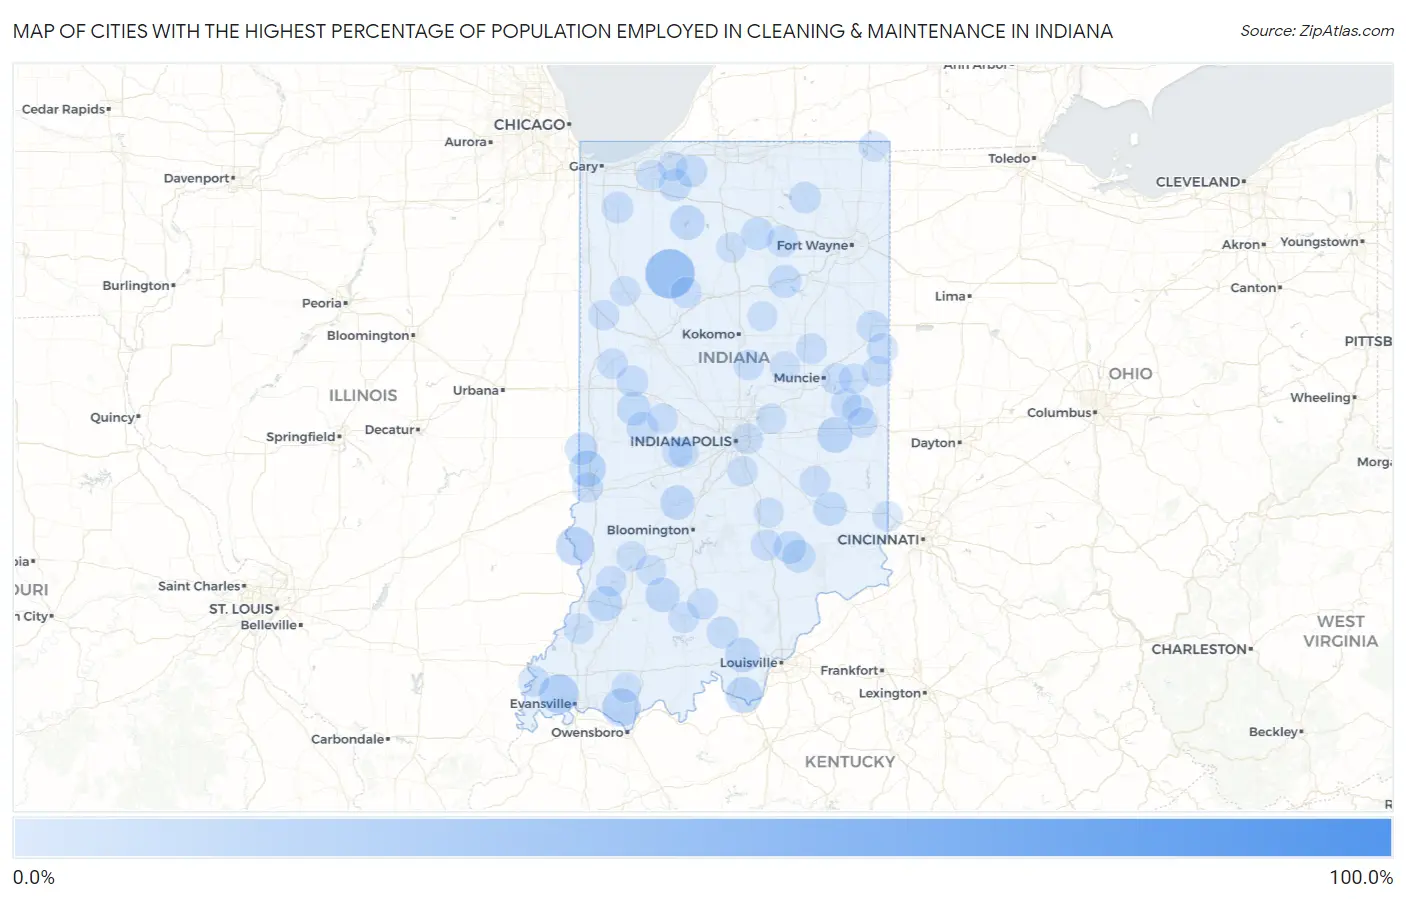
Map of Cities with the Highest Percentage of Population Employed in Cleaning & Maintenance in Indiana
0.0%
100.0%
Cities with the Highest Percentage of Population Employed in Cleaning & Maintenance in Indiana
| City | % Employed | vs State | vs National | |
| 1. | Stillwell | 100.0% | 3.2%(+96.8)#1 | 3.5%(+96.5)#21 |
| 2. | Groveland | 64.4% | 3.2%(+61.1)#2 | 3.5%(+60.9)#50 |
| 3. | Beaver Dam | 51.9% | 3.2%(+48.6)#3 | 3.5%(+48.4)#80 |
| 4. | Buffalo | 39.4% | 3.2%(+36.2)#4 | 3.5%(+35.9)#148 |
| 5. | Fountaintown | 29.3% | 3.2%(+26.0)#5 | 3.5%(+25.8)#280 |
| 6. | New London | 25.0% | 3.2%(+21.8)#6 | 3.5%(+21.5)#389 |
| 7. | Prairie Creek | 24.6% | 3.2%(+21.4)#7 | 3.5%(+21.1)#406 |
| 8. | Prospect | 23.1% | 3.2%(+19.8)#8 | 3.5%(+19.6)#465 |
| 9. | Parkers Settlement | 22.3% | 3.2%(+19.1)#9 | 3.5%(+18.8)#500 |
| 10. | Delaware | 21.5% | 3.2%(+18.2)#10 | 3.5%(+18.0)#547 |
| 11. | Richland | 20.4% | 3.2%(+17.1)#11 | 3.5%(+16.9)#611 |
| 12. | Merom | 20.3% | 3.2%(+17.1)#12 | 3.5%(+16.9)#614 |
| 13. | Ora | 20.0% | 3.2%(+16.8)#13 | 3.5%(+16.5)#627 |
| 14. | Arcola | 18.5% | 3.2%(+15.3)#14 | 3.5%(+15.0)#734 |
| 15. | New Goshen | 17.8% | 3.2%(+14.6)#15 | 3.5%(+14.3)#801 |
| 16. | Laconia | 17.6% | 3.2%(+14.4)#16 | 3.5%(+14.2)#811 |
| 17. | St. Omer | 16.7% | 3.2%(+13.4)#17 | 3.5%(+13.2)#907 |
| 18. | Marietta | 16.5% | 3.2%(+13.3)#18 | 3.5%(+13.0)#929 |
| 19. | Straughn | 16.3% | 3.2%(+13.0)#19 | 3.5%(+12.8)#958 |
| 20. | Lake Holiday Hideaway | 15.9% | 3.2%(+12.7)#20 | 3.5%(+12.4)#996 |
| 21. | Abington | 15.6% | 3.2%(+12.4)#21 | 3.5%(+12.1)#1,026 |
| 22. | Bass Lake | 15.2% | 3.2%(+12.0)#22 | 3.5%(+11.7)#1,075 |
| 23. | Wheatland | 15.1% | 3.2%(+11.9)#23 | 3.5%(+11.6)#1,094 |
| 24. | Browns Crossing | 15.0% | 3.2%(+11.8)#24 | 3.5%(+11.5)#1,106 |
| 25. | New Salisbury | 15.0% | 3.2%(+11.7)#25 | 3.5%(+11.5)#1,117 |
| 26. | Dover Hill | 14.6% | 3.2%(+11.4)#26 | 3.5%(+11.2)#1,173 |
| 27. | Gosport | 14.6% | 3.2%(+11.3)#27 | 3.5%(+11.1)#1,191 |
| 28. | Folsomville | 14.4% | 3.2%(+11.2)#28 | 3.5%(+11.0)#1,221 |
| 29. | Wyatt | 14.3% | 3.2%(+11.1)#29 | 3.5%(+10.8)#1,241 |
| 30. | New Point | 13.5% | 3.2%(+10.2)#30 | 3.5%(+9.98)#1,419 |
| 31. | Alamo | 13.0% | 3.2%(+9.81)#31 | 3.5%(+9.56)#1,533 |
| 32. | Lagro | 12.4% | 3.2%(+9.19)#32 | 3.5%(+8.94)#1,727 |
| 33. | Judah | 12.1% | 3.2%(+8.87)#33 | 3.5%(+8.62)#1,823 |
| 34. | Vernon | 12.0% | 3.2%(+8.80)#34 | 3.5%(+8.55)#1,844 |
| 35. | Libertyville | 12.0% | 3.2%(+8.77)#35 | 3.5%(+8.52)#1,858 |
| 36. | St Bernice | 11.8% | 3.2%(+8.53)#36 | 3.5%(+8.28)#1,924 |
| 37. | Burket | 11.8% | 3.2%(+8.53)#37 | 3.5%(+8.28)#1,926 |
| 38. | Oswego | 11.7% | 3.2%(+8.49)#38 | 3.5%(+8.24)#1,943 |
| 39. | Country Squire Lakes | 11.7% | 3.2%(+8.46)#39 | 3.5%(+8.21)#1,948 |
| 40. | Kingsford Heights | 11.6% | 3.2%(+8.33)#40 | 3.5%(+8.08)#1,986 |
| 41. | Blue Ridge | 11.5% | 3.2%(+8.24)#41 | 3.5%(+7.99)#2,022 |
| 42. | Fishersburg | 11.2% | 3.2%(+7.99)#42 | 3.5%(+7.74)#2,120 |
| 43. | Liberty Center | 11.1% | 3.2%(+7.88)#43 | 3.5%(+7.63)#2,167 |
| 44. | Chain-O-Lakes | 11.0% | 3.2%(+7.81)#44 | 3.5%(+7.56)#2,191 |
| 45. | Fish Lake | 10.9% | 3.2%(+7.71)#45 | 3.5%(+7.46)#2,230 |
| 46. | Hardinsburg | 10.6% | 3.2%(+7.41)#46 | 3.5%(+7.16)#2,345 |
| 47. | Sidney | 10.3% | 3.2%(+7.02)#47 | 3.5%(+6.77)#2,504 |
| 48. | Kimmell | 10.2% | 3.2%(+7.00)#48 | 3.5%(+6.74)#2,515 |
| 49. | Bryant | 10.1% | 3.2%(+6.91)#49 | 3.5%(+6.66)#2,549 |
| 50. | Hebron | 9.9% | 3.2%(+6.70)#50 | 3.5%(+6.45)#2,666 |
| 51. | Glezen | 9.8% | 3.2%(+6.62)#51 | 3.5%(+6.37)#2,715 |
| 52. | Wingate | 9.8% | 3.2%(+6.56)#52 | 3.5%(+6.31)#2,756 |
| 53. | Malden | 9.7% | 3.2%(+6.43)#53 | 3.5%(+6.18)#2,808 |
| 54. | Russellville | 9.6% | 3.2%(+6.41)#54 | 3.5%(+6.16)#2,813 |
| 55. | Selma | 9.6% | 3.2%(+6.36)#55 | 3.5%(+6.11)#2,846 |
| 56. | Salamonia | 9.6% | 3.2%(+6.34)#56 | 3.5%(+6.09)#2,859 |
| 57. | Gilmer Park | 9.4% | 3.2%(+6.19)#57 | 3.5%(+5.94)#2,933 |
| 58. | Hortonville | 9.4% | 3.2%(+6.17)#58 | 3.5%(+5.92)#2,949 |
| 59. | Coesse | 9.3% | 3.2%(+6.05)#59 | 3.5%(+5.80)#3,009 |
| 60. | West Baden Springs | 9.3% | 3.2%(+6.04)#60 | 3.5%(+5.79)#3,015 |
| 61. | Jonesville | 9.2% | 3.2%(+5.95)#61 | 3.5%(+5.70)#3,057 |
| 62. | Burnettsville | 9.2% | 3.2%(+5.92)#62 | 3.5%(+5.67)#3,068 |
| 63. | Orleans | 9.1% | 3.2%(+5.88)#63 | 3.5%(+5.63)#3,085 |
| 64. | Economy | 9.1% | 3.2%(+5.86)#64 | 3.5%(+5.61)#3,113 |
| 65. | Warren Park | 9.0% | 3.2%(+5.82)#65 | 3.5%(+5.56)#3,152 |
| 66. | New Harmony | 8.9% | 3.2%(+5.68)#66 | 3.5%(+5.43)#3,229 |
| 67. | Losantville | 8.9% | 3.2%(+5.66)#67 | 3.5%(+5.41)#3,256 |
| 68. | Milroy | 8.9% | 3.2%(+5.65)#68 | 3.5%(+5.40)#3,267 |
| 69. | Amity | 8.9% | 3.2%(+5.64)#69 | 3.5%(+5.39)#3,275 |
| 70. | Matthews | 8.7% | 3.2%(+5.51)#70 | 3.5%(+5.26)#3,370 |
| 71. | Saratoga | 8.7% | 3.2%(+5.46)#71 | 3.5%(+5.21)#3,393 |
| 72. | Edwardsport | 8.7% | 3.2%(+5.43)#72 | 3.5%(+5.18)#3,433 |
| 73. | Foxcliff Estates | 8.5% | 3.2%(+5.25)#73 | 3.5%(+5.00)#3,559 |
| 74. | Ladoga | 8.5% | 3.2%(+5.25)#74 | 3.5%(+5.00)#3,560 |
| 75. | Attica | 8.5% | 3.2%(+5.22)#75 | 3.5%(+4.97)#3,572 |
| 76. | Greens Fork | 8.4% | 3.2%(+5.19)#76 | 3.5%(+4.94)#3,601 |
| 77. | Fowler | 8.4% | 3.2%(+5.17)#77 | 3.5%(+4.91)#3,619 |
| 78. | Coatesville | 8.3% | 3.2%(+5.10)#78 | 3.5%(+4.85)#3,657 |
| 79. | Tipton | 8.3% | 3.2%(+5.09)#79 | 3.5%(+4.84)#3,689 |
| 80. | Toad Hop | 8.2% | 3.2%(+5.02)#80 | 3.5%(+4.76)#3,746 |
| 81. | Hazleton | 8.2% | 3.2%(+4.95)#81 | 3.5%(+4.70)#3,809 |
| 82. | New Whiteland | 8.2% | 3.2%(+4.95)#82 | 3.5%(+4.70)#3,812 |
| 83. | Orestes | 8.2% | 3.2%(+4.94)#83 | 3.5%(+4.69)#3,814 |
| 84. | West Harrison | 8.2% | 3.2%(+4.93)#84 | 3.5%(+4.68)#3,824 |
| 85. | Crane | 8.1% | 3.2%(+4.85)#85 | 3.5%(+4.60)#3,893 |
| 86. | Homer | 8.0% | 3.2%(+4.79)#86 | 3.5%(+4.54)#3,949 |
| 87. | Westville | 7.9% | 3.2%(+4.71)#87 | 3.5%(+4.46)#4,011 |
| 88. | Morris | 7.9% | 3.2%(+4.68)#88 | 3.5%(+4.43)#4,050 |
| 89. | Lyons | 7.9% | 3.2%(+4.64)#89 | 3.5%(+4.39)#4,090 |
| 90. | Amo | 7.8% | 3.2%(+4.58)#90 | 3.5%(+4.33)#4,134 |
| 91. | Fremont | 7.8% | 3.2%(+4.56)#91 | 3.5%(+4.31)#4,158 |
| 92. | Rochester | 7.8% | 3.2%(+4.52)#92 | 3.5%(+4.27)#4,181 |
| 93. | Fortville | 7.7% | 3.2%(+4.45)#93 | 3.5%(+4.20)#4,263 |
| 94. | Reddington | 7.6% | 3.2%(+4.42)#94 | 3.5%(+4.16)#4,288 |
| 95. | Clifford | 7.6% | 3.2%(+4.41)#95 | 3.5%(+4.16)#4,291 |
| 96. | Remington | 7.6% | 3.2%(+4.38)#96 | 3.5%(+4.12)#4,320 |
| 97. | La Porte | 7.5% | 3.2%(+4.24)#97 | 3.5%(+3.99)#4,434 |
| 98. | Tennyson | 7.5% | 3.2%(+4.23)#98 | 3.5%(+3.98)#4,454 |
| 99. | Farmland | 7.5% | 3.2%(+4.23)#99 | 3.5%(+3.98)#4,458 |
| 100. | Amboy | 7.5% | 3.2%(+4.22)#100 | 3.5%(+3.97)#4,463 |
Common Questions
What are the Top 10 Cities with the Highest Percentage of Population Employed in Cleaning & Maintenance in Indiana?
Top 10 Cities with the Highest Percentage of Population Employed in Cleaning & Maintenance in Indiana are:
#1
39.4%
#2
22.3%
#3
20.4%
#4
20.3%
#5
17.8%
#6
17.6%
#7
16.3%
#8
15.2%
#9
15.1%
#10
15.0%
What city has the Highest Percentage of Population Employed in Cleaning & Maintenance in Indiana?
Buffalo has the Highest Percentage of Population Employed in Cleaning & Maintenance in Indiana with 39.4%.
What is the Percentage of Population Employed in Cleaning & Maintenance in the State of Indiana?
Percentage of Population Employed in Cleaning & Maintenance in Indiana is 3.2%.
What is the Percentage of Population Employed in Cleaning & Maintenance in the United States?
Percentage of Population Employed in Cleaning & Maintenance in the United States is 3.5%.