Cities with the Highest Percentage of Population Employed in Cleaning & Maintenance in Vermont
RELATED REPORTS & OPTIONS
Cleaning & Maintenance
Vermont
Compare Cities
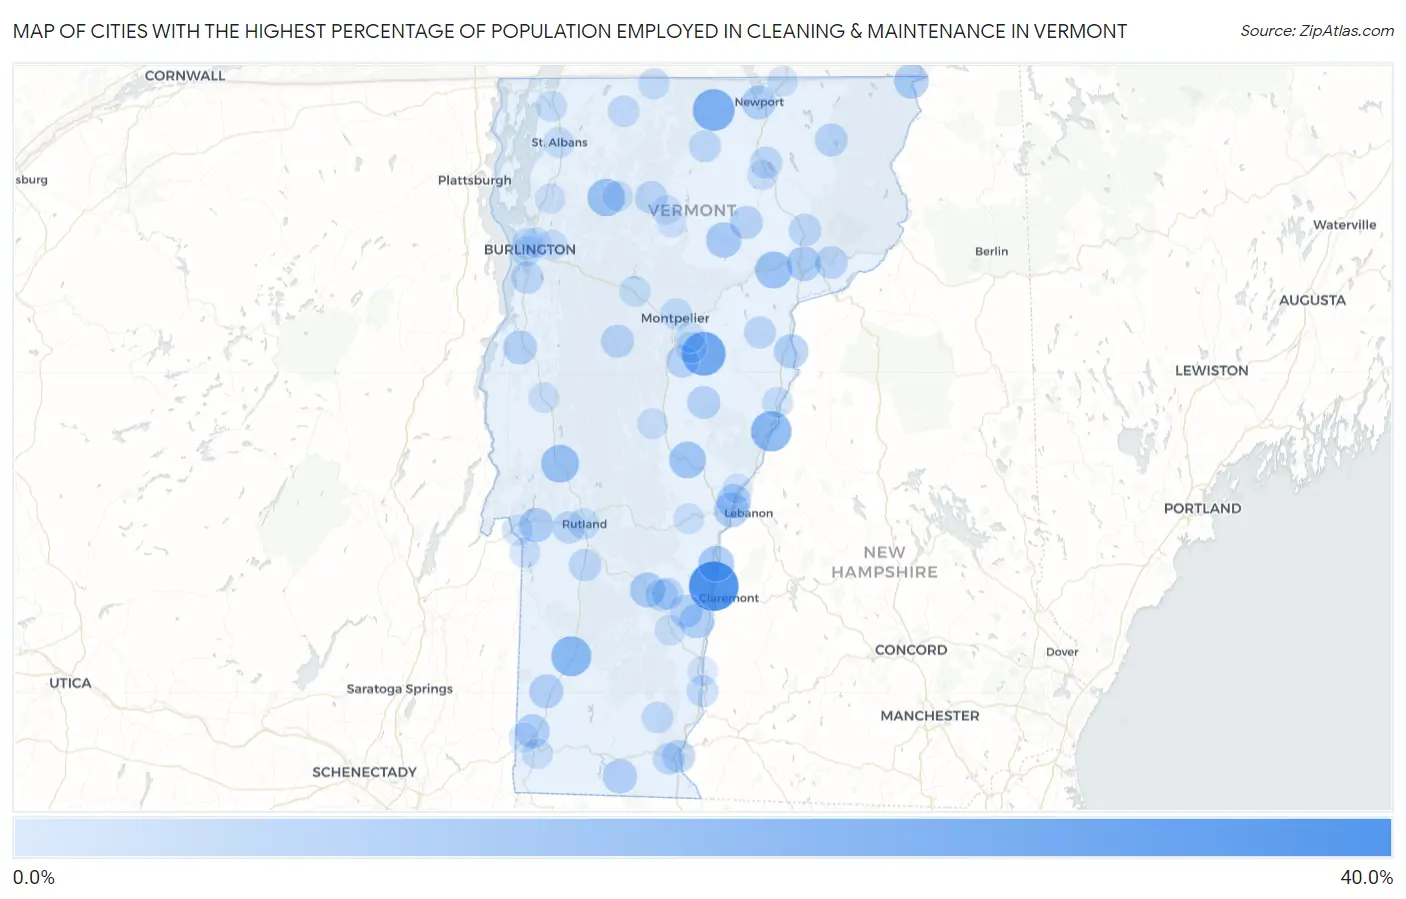
Map of Cities with the Highest Percentage of Population Employed in Cleaning & Maintenance in Vermont
0.0%
40.0%
Cities with the Highest Percentage of Population Employed in Cleaning & Maintenance in Vermont
| City | % Employed | vs State | vs National | |
| 1. | Ascutney | 31.9% | 3.9%(+28.1)#1 | 3.5%(+28.5)#240 |
| 2. | Harmonyville | 30.6% | 3.9%(+26.7)#2 | 3.5%(+27.1)#257 |
| 3. | Sheffield | 27.1% | 3.9%(+23.2)#3 | 3.5%(+23.6)#330 |
| 4. | East Barre | 22.5% | 3.9%(+18.6)#4 | 3.5%(+19.0)#494 |
| 5. | North Clarendon | 19.6% | 3.9%(+15.7)#5 | 3.5%(+16.1)#661 |
| 6. | Troy | 19.5% | 3.9%(+15.6)#6 | 3.5%(+16.0)#669 |
| 7. | Wolcott | 17.5% | 3.9%(+13.6)#7 | 3.5%(+14.0)#821 |
| 8. | Whitingham | 17.4% | 3.9%(+13.5)#8 | 3.5%(+13.9)#832 |
| 9. | Fairlee | 17.2% | 3.9%(+13.4)#9 | 3.5%(+13.8)#845 |
| 10. | Manchester Center | 16.6% | 3.9%(+12.7)#10 | 3.5%(+13.1)#922 |
| 11. | Pownal Center | 16.6% | 3.9%(+12.7)#11 | 3.5%(+13.1)#923 |
| 12. | Brandon | 13.2% | 3.9%(+9.28)#12 | 3.5%(+9.68)#1,493 |
| 13. | New Haven | 13.0% | 3.9%(+9.10)#13 | 3.5%(+9.49)#1,551 |
| 14. | Londonderry | 12.9% | 3.9%(+9.02)#14 | 3.5%(+9.42)#1,570 |
| 15. | Cambridge | 12.6% | 3.9%(+8.71)#15 | 3.5%(+9.11)#1,667 |
| 16. | Danville | 11.7% | 3.9%(+7.84)#16 | 3.5%(+8.24)#1,942 |
| 17. | South Royalton | 11.3% | 3.9%(+7.47)#17 | 3.5%(+7.86)#2,081 |
| 18. | Sutton | 10.8% | 3.9%(+6.87)#18 | 3.5%(+7.27)#2,300 |
| 19. | Middletown Springs | 10.5% | 3.9%(+6.65)#19 | 3.5%(+7.04)#2,388 |
| 20. | Windsor | 9.8% | 3.9%(+5.95)#20 | 3.5%(+6.35)#2,729 |
| 21. | Hardwick | 9.4% | 3.9%(+5.51)#21 | 3.5%(+5.91)#2,952 |
| 22. | Ludlow | 8.9% | 3.9%(+5.00)#22 | 3.5%(+5.39)#3,273 |
| 23. | South Londonderry | 8.6% | 3.9%(+4.72)#23 | 3.5%(+5.12)#3,473 |
| 24. | White River Junction | 8.5% | 3.9%(+4.58)#24 | 3.5%(+4.98)#3,569 |
| 25. | Canaan | 8.3% | 3.9%(+4.45)#25 | 3.5%(+4.85)#3,665 |
| 26. | St Johnsbury | 8.2% | 3.9%(+4.36)#26 | 3.5%(+4.76)#3,754 |
| 27. | Hartford | 8.1% | 3.9%(+4.21)#27 | 3.5%(+4.60)#3,892 |
| 28. | Wilder | 7.8% | 3.9%(+3.94)#28 | 3.5%(+4.34)#4,130 |
| 29. | Castleton | 7.7% | 3.9%(+3.81)#29 | 3.5%(+4.21)#4,223 |
| 30. | Wells River | 7.6% | 3.9%(+3.75)#30 | 3.5%(+4.14)#4,298 |
| 31. | Jacksonville | 7.5% | 3.9%(+3.65)#31 | 3.5%(+4.04)#4,391 |
| 32. | Arlington | 7.4% | 3.9%(+3.50)#32 | 3.5%(+3.90)#4,545 |
| 33. | Killington | 7.4% | 3.9%(+3.50)#33 | 3.5%(+3.89)#4,549 |
| 34. | Springfield | 7.3% | 3.9%(+3.37)#34 | 3.5%(+3.77)#4,674 |
| 35. | South Shaftsbury | 7.2% | 3.9%(+3.34)#35 | 3.5%(+3.74)#4,702 |
| 36. | Newport | 7.2% | 3.9%(+3.29)#36 | 3.5%(+3.69)#4,753 |
| 37. | Vergennes | 7.0% | 3.9%(+3.17)#37 | 3.5%(+3.57)#4,867 |
| 38. | South Hero | 6.6% | 3.9%(+2.71)#38 | 3.5%(+3.11)#5,456 |
| 39. | West Charlotte | 6.2% | 3.9%(+2.32)#39 | 3.5%(+2.72)#6,061 |
| 40. | North Springfield | 6.1% | 3.9%(+2.25)#40 | 3.5%(+2.65)#6,167 |
| 41. | Waitsfield | 6.0% | 3.9%(+2.15)#41 | 3.5%(+2.55)#6,314 |
| 42. | Chelsea | 5.9% | 3.9%(+2.00)#42 | 3.5%(+2.40)#6,574 |
| 43. | Greensboro Bend | 5.8% | 3.9%(+1.88)#43 | 3.5%(+2.27)#6,763 |
| 44. | Island Pond | 5.7% | 3.9%(+1.82)#44 | 3.5%(+2.21)#6,864 |
| 45. | Williamstown | 5.6% | 3.9%(+1.73)#45 | 3.5%(+2.13)#7,023 |
| 46. | Johnson | 5.5% | 3.9%(+1.66)#46 | 3.5%(+2.06)#7,141 |
| 47. | Brattleboro | 5.5% | 3.9%(+1.65)#47 | 3.5%(+2.05)#7,158 |
| 48. | Concord | 5.4% | 3.9%(+1.53)#48 | 3.5%(+1.92)#7,379 |
| 49. | Shelburne | 5.0% | 3.9%(+1.14)#49 | 3.5%(+1.54)#8,202 |
| 50. | Lyndonville | 4.9% | 3.9%(+1.01)#50 | 3.5%(+1.40)#8,516 |
| 51. | Proctorsville | 4.9% | 3.9%(+0.974)#51 | 3.5%(+1.37)#8,593 |
| 52. | East Dorset | 4.7% | 3.9%(+0.853)#52 | 3.5%(+1.25)#8,896 |
| 53. | Wallingford | 4.7% | 3.9%(+0.795)#53 | 3.5%(+1.19)#9,029 |
| 54. | Stamford | 4.7% | 3.9%(+0.781)#54 | 3.5%(+1.18)#9,068 |
| 55. | West Rutland | 4.5% | 3.9%(+0.623)#55 | 3.5%(+1.02)#9,498 |
| 56. | Groton | 4.4% | 3.9%(+0.502)#56 | 3.5%(+0.900)#9,841 |
| 57. | Lowell | 4.3% | 3.9%(+0.421)#57 | 3.5%(+0.818)#10,091 |
| 58. | Barton | 4.2% | 3.9%(+0.304)#58 | 3.5%(+0.701)#10,421 |
| 59. | Cavendish | 4.0% | 3.9%(+0.160)#59 | 3.5%(+0.558)#10,875 |
| 60. | Danby | 4.0% | 3.9%(+0.160)#60 | 3.5%(+0.558)#10,877 |
| 61. | West Brattleboro | 4.0% | 3.9%(+0.131)#61 | 3.5%(+0.528)#10,954 |
| 62. | Enosburg Falls | 3.9% | 3.9%(+0.012)#62 | 3.5%(+0.410)#11,322 |
| 63. | Burlington | 3.7% | 3.9%(-0.136)#63 | 3.5%(+0.261)#11,770 |
| 64. | South Lincoln | 3.7% | 3.9%(-0.142)#64 | 3.5%(+0.256)#11,800 |
| 65. | Westminster | 3.7% | 3.9%(-0.163)#65 | 3.5%(+0.235)#11,855 |
| 66. | Newfane | 3.5% | 3.9%(-0.372)#66 | 3.5%(+0.026)#12,589 |
| 67. | South Barre | 3.5% | 3.9%(-0.384)#67 | 3.5%(+0.014)#12,625 |
| 68. | Rutland | 3.3% | 3.9%(-0.623)#68 | 3.5%(-0.225)#13,534 |
| 69. | West Woodstock | 3.1% | 3.9%(-0.741)#69 | 3.5%(-0.344)#13,965 |
| 70. | Montpelier | 3.1% | 3.9%(-0.746)#70 | 3.5%(-0.348)#13,974 |
| 71. | Chittenden | 3.1% | 3.9%(-0.788)#71 | 3.5%(-0.390)#14,126 |
| 72. | Richford | 3.0% | 3.9%(-0.885)#72 | 3.5%(-0.488)#14,515 |
| 73. | Fair Haven | 3.0% | 3.9%(-0.920)#73 | 3.5%(-0.522)#14,632 |
| 74. | St. George | 2.9% | 3.9%(-1.01)#74 | 3.5%(-0.612)#14,956 |
| 75. | Waterbury | 2.8% | 3.9%(-1.09)#75 | 3.5%(-0.695)#15,325 |
| 76. | Swanton | 2.8% | 3.9%(-1.11)#76 | 3.5%(-0.715)#15,399 |
| 77. | Bradford | 2.5% | 3.9%(-1.36)#77 | 3.5%(-0.965)#16,321 |
| 78. | St Albans | 2.5% | 3.9%(-1.38)#78 | 3.5%(-0.986)#16,406 |
| 79. | Chester | 2.5% | 3.9%(-1.41)#79 | 3.5%(-1.01)#16,493 |
| 80. | Derby Line | 2.4% | 3.9%(-1.47)#80 | 3.5%(-1.08)#16,746 |
| 81. | Poultney | 2.4% | 3.9%(-1.52)#81 | 3.5%(-1.12)#16,917 |
| 82. | Jeffersonville | 2.3% | 3.9%(-1.55)#82 | 3.5%(-1.16)#17,045 |
| 83. | South Burlington | 2.3% | 3.9%(-1.60)#83 | 3.5%(-1.20)#17,215 |
| 84. | Randolph | 2.3% | 3.9%(-1.62)#84 | 3.5%(-1.22)#17,287 |
| 85. | Bolton Valley | 2.3% | 3.9%(-1.62)#85 | 3.5%(-1.23)#17,305 |
| 86. | Woodstock | 2.2% | 3.9%(-1.70)#86 | 3.5%(-1.30)#17,590 |
| 87. | Middlebury | 2.1% | 3.9%(-1.82)#87 | 3.5%(-1.42)#18,067 |
| 88. | Bennington | 2.0% | 3.9%(-1.89)#88 | 3.5%(-1.49)#18,317 |
| 89. | Milton | 1.9% | 3.9%(-2.02)#89 | 3.5%(-1.62)#18,862 |
| 90. | Barre | 1.8% | 3.9%(-2.07)#90 | 3.5%(-1.67)#19,029 |
| 91. | Proctor | 1.8% | 3.9%(-2.09)#91 | 3.5%(-1.69)#19,123 |
| 92. | Essex Junction | 1.8% | 3.9%(-2.12)#92 | 3.5%(-1.72)#19,210 |
| 93. | Bakersfield | 1.7% | 3.9%(-2.16)#93 | 3.5%(-1.76)#19,372 |
| 94. | Winooski | 1.6% | 3.9%(-2.27)#94 | 3.5%(-1.87)#19,801 |
| 95. | Glover | 1.5% | 3.9%(-2.34)#95 | 3.5%(-1.94)#20,049 |
| 96. | Morrisville | 1.4% | 3.9%(-2.46)#96 | 3.5%(-2.07)#20,482 |
| 97. | Hyde Park | 1.4% | 3.9%(-2.47)#97 | 3.5%(-2.07)#20,522 |
| 98. | Norwich | 1.3% | 3.9%(-2.57)#98 | 3.5%(-2.17)#20,833 |
| 99. | Bellows Falls | 1.2% | 3.9%(-2.67)#99 | 3.5%(-2.28)#21,200 |
| 100. | North Bennington | 1.2% | 3.9%(-2.68)#100 | 3.5%(-2.28)#21,223 |
1
2Common Questions
What are the Top 10 Cities with the Highest Percentage of Population Employed in Cleaning & Maintenance in Vermont?
Top 10 Cities with the Highest Percentage of Population Employed in Cleaning & Maintenance in Vermont are:
#1
31.9%
#2
22.5%
#3
19.5%
#4
17.2%
#5
16.6%
#6
13.2%
#7
12.6%
#8
11.7%
#9
11.3%
#10
9.8%
What city has the Highest Percentage of Population Employed in Cleaning & Maintenance in Vermont?
Ascutney has the Highest Percentage of Population Employed in Cleaning & Maintenance in Vermont with 31.9%.
What is the Percentage of Population Employed in Cleaning & Maintenance in the State of Vermont?
Percentage of Population Employed in Cleaning & Maintenance in Vermont is 3.9%.
What is the Percentage of Population Employed in Cleaning & Maintenance in the United States?
Percentage of Population Employed in Cleaning & Maintenance in the United States is 3.5%.