Cities with the Highest Percentage of Population Employed in Cleaning & Maintenance in South Dakota
RELATED REPORTS & OPTIONS
Cleaning & Maintenance
South Dakota
Compare Cities
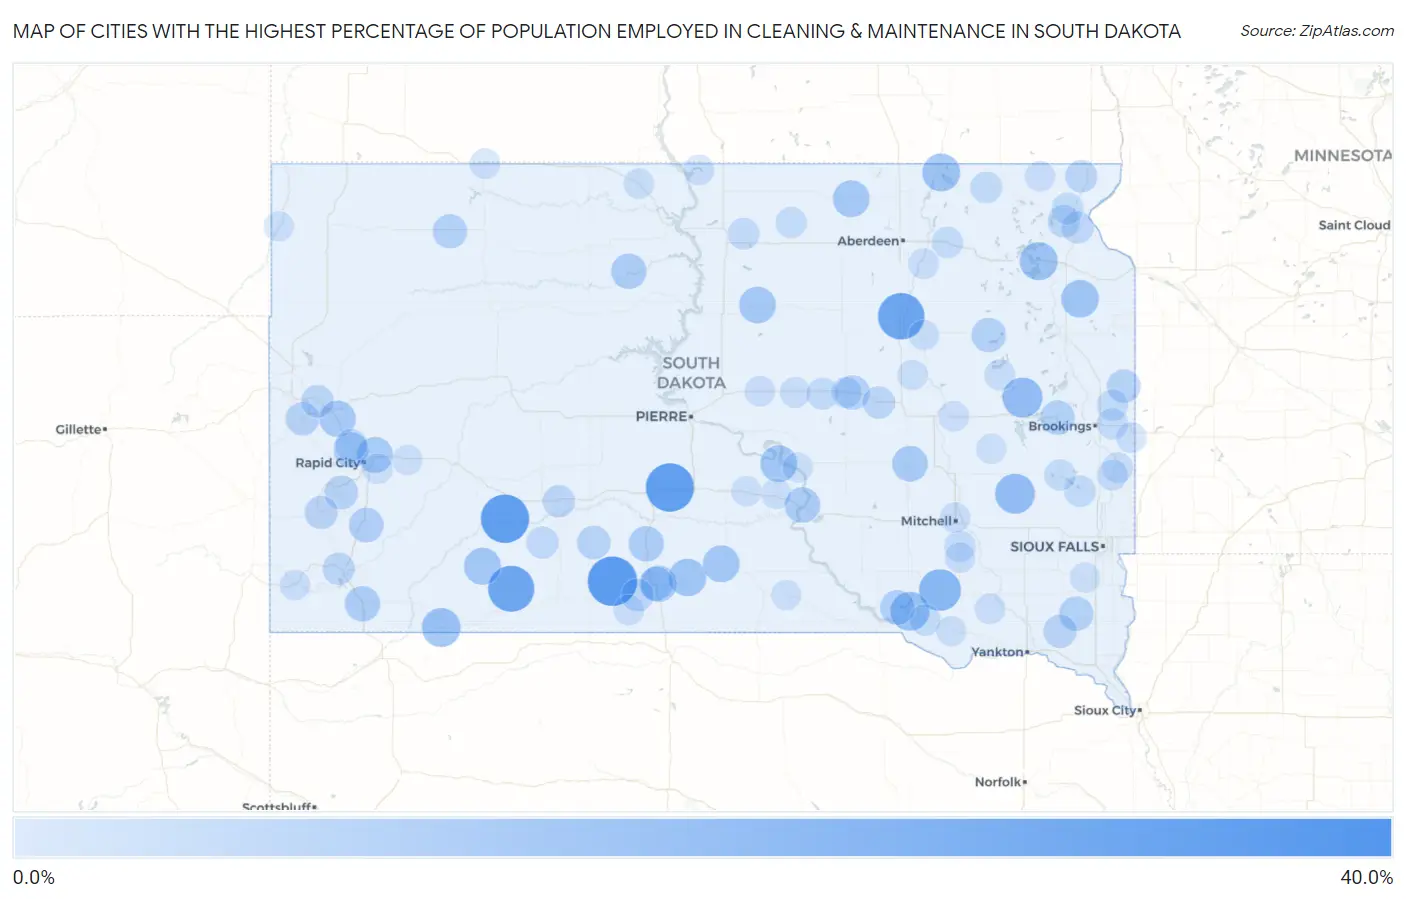
Map of Cities with the Highest Percentage of Population Employed in Cleaning & Maintenance in South Dakota
0.0%
40.0%
Cities with the Highest Percentage of Population Employed in Cleaning & Maintenance in South Dakota
| City | % Employed | vs State | vs National | |
| 1. | Rowena | 39.3% | 3.4%(+35.8)#1 | 3.5%(+35.8)#150 |
| 2. | Parmelee | 35.3% | 3.4%(+31.9)#2 | 3.5%(+31.8)#185 |
| 3. | Interior | 33.3% | 3.4%(+29.9)#3 | 3.5%(+29.9)#221 |
| 4. | Draper | 33.3% | 3.4%(+29.9)#4 | 3.5%(+29.9)#225 |
| 5. | Ashton | 30.3% | 3.4%(+26.9)#5 | 3.5%(+26.9)#263 |
| 6. | Allen | 29.9% | 3.4%(+26.5)#6 | 3.5%(+26.4)#268 |
| 7. | Wakpala | 22.9% | 3.4%(+19.4)#7 | 3.5%(+19.4)#476 |
| 8. | Delmont | 22.7% | 3.4%(+19.3)#8 | 3.5%(+19.2)#482 |
| 9. | Cherry Creek | 22.2% | 3.4%(+18.8)#9 | 3.5%(+18.7)#506 |
| 10. | Erwin | 20.0% | 3.4%(+16.6)#10 | 3.5%(+16.5)#634 |
| 11. | Canova | 19.6% | 3.4%(+16.2)#11 | 3.5%(+16.2)#658 |
| 12. | Ravinia | 18.2% | 3.4%(+14.7)#12 | 3.5%(+14.7)#771 |
| 13. | Pine Ridge | 18.1% | 3.4%(+14.6)#13 | 3.5%(+14.6)#776 |
| 14. | Waubay | 16.8% | 3.4%(+13.3)#14 | 3.5%(+13.3)#897 |
| 15. | Hecla | 16.7% | 3.4%(+13.2)#15 | 3.5%(+13.2)#901 |
| 16. | South Shore | 16.3% | 3.4%(+12.9)#16 | 3.5%(+12.8)#954 |
| 17. | Okreek | 16.0% | 3.4%(+12.6)#17 | 3.5%(+12.5)#983 |
| 18. | Kyle | 15.5% | 3.4%(+12.0)#18 | 3.5%(+12.0)#1,050 |
| 19. | New Witten | 15.2% | 3.4%(+11.7)#19 | 3.5%(+11.7)#1,084 |
| 20. | Lower Brule | 15.0% | 3.4%(+11.6)#20 | 3.5%(+11.6)#1,105 |
| 21. | Leola | 14.9% | 3.4%(+11.5)#21 | 3.5%(+11.4)#1,123 |
| 22. | Lebanon | 14.9% | 3.4%(+11.5)#22 | 3.5%(+11.4)#1,127 |
| 23. | Antelope | 14.3% | 3.4%(+10.8)#23 | 3.5%(+10.8)#1,233 |
| 24. | Blucksberg Mountain | 14.2% | 3.4%(+10.8)#24 | 3.5%(+10.8)#1,253 |
| 25. | Ashland Heights | 13.7% | 3.4%(+10.2)#25 | 3.5%(+10.2)#1,373 |
| 26. | Lane | 13.3% | 3.4%(+9.89)#26 | 3.5%(+9.85)#1,456 |
| 27. | Oacoma | 13.0% | 3.4%(+9.60)#27 | 3.5%(+9.56)#1,523 |
| 28. | Whitehorse | 12.9% | 3.4%(+9.46)#28 | 3.5%(+9.42)#1,569 |
| 29. | White River | 12.8% | 3.4%(+9.38)#29 | 3.5%(+9.34)#1,600 |
| 30. | Oelrichs | 12.7% | 3.4%(+9.31)#30 | 3.5%(+9.26)#1,627 |
| 31. | Blackhawk | 12.6% | 3.4%(+9.15)#31 | 3.5%(+9.11)#1,666 |
| 32. | Fairburn | 11.8% | 3.4%(+8.33)#32 | 3.5%(+8.28)#1,934 |
| 33. | Lake Andes | 11.7% | 3.4%(+8.23)#33 | 3.5%(+8.18)#1,956 |
| 34. | Clark | 11.4% | 3.4%(+7.99)#34 | 3.5%(+7.95)#2,034 |
| 35. | St Lawrence | 11.4% | 3.4%(+7.96)#35 | 3.5%(+7.92)#2,049 |
| 36. | Centerville | 11.4% | 3.4%(+7.96)#36 | 3.5%(+7.92)#2,053 |
| 37. | Arlington | 11.3% | 3.4%(+7.83)#37 | 3.5%(+7.78)#2,107 |
| 38. | Bison | 11.2% | 3.4%(+7.77)#38 | 3.5%(+7.73)#2,126 |
| 39. | Wonderland Homes | 11.1% | 3.4%(+7.67)#39 | 3.5%(+7.63)#2,152 |
| 40. | Mission | 10.8% | 3.4%(+7.36)#40 | 3.5%(+7.31)#2,287 |
| 41. | Keystone | 10.2% | 3.4%(+6.79)#41 | 3.5%(+6.75)#2,513 |
| 42. | Corn Creek | 10.0% | 3.4%(+6.56)#42 | 3.5%(+6.52)#2,629 |
| 43. | Astoria | 10.0% | 3.4%(+6.56)#43 | 3.5%(+6.52)#2,630 |
| 44. | Lead | 9.8% | 3.4%(+6.40)#44 | 3.5%(+6.36)#2,718 |
| 45. | Wakonda | 9.8% | 3.4%(+6.32)#45 | 3.5%(+6.27)#2,768 |
| 46. | Custer | 9.4% | 3.4%(+5.94)#46 | 3.5%(+5.90)#2,956 |
| 47. | Whitewood | 8.8% | 3.4%(+5.32)#47 | 3.5%(+5.28)#3,353 |
| 48. | Rosebud | 8.6% | 3.4%(+5.14)#48 | 3.5%(+5.09)#3,489 |
| 49. | Agency Village | 8.4% | 3.4%(+4.96)#49 | 3.5%(+4.92)#3,616 |
| 50. | Wessington | 8.3% | 3.4%(+4.82)#50 | 3.5%(+4.77)#3,734 |
| 51. | New Effington | 8.2% | 3.4%(+4.80)#51 | 3.5%(+4.75)#3,762 |
| 52. | Kadoka | 8.2% | 3.4%(+4.78)#52 | 3.5%(+4.74)#3,775 |
| 53. | Hot Springs | 8.1% | 3.4%(+4.68)#53 | 3.5%(+4.63)#3,872 |
| 54. | Wanblee | 8.0% | 3.4%(+4.56)#54 | 3.5%(+4.52)#3,966 |
| 55. | Peever | 8.0% | 3.4%(+4.56)#55 | 3.5%(+4.52)#3,970 |
| 56. | Summerset | 7.8% | 3.4%(+4.39)#56 | 3.5%(+4.35)#4,117 |
| 57. | Sisseton | 7.4% | 3.4%(+3.98)#57 | 3.5%(+3.94)#4,495 |
| 58. | Ree Heights | 7.4% | 3.4%(+3.97)#58 | 3.5%(+3.92)#4,523 |
| 59. | Mountain Plains | 7.3% | 3.4%(+3.85)#59 | 3.5%(+3.81)#4,640 |
| 60. | Chester | 7.1% | 3.4%(+3.70)#60 | 3.5%(+3.66)#4,784 |
| 61. | Java | 7.1% | 3.4%(+3.70)#61 | 3.5%(+3.66)#4,789 |
| 62. | Britton | 6.9% | 3.4%(+3.51)#62 | 3.5%(+3.46)#4,994 |
| 63. | Madison | 6.8% | 3.4%(+3.39)#63 | 3.5%(+3.35)#5,143 |
| 64. | Groton | 6.8% | 3.4%(+3.38)#64 | 3.5%(+3.33)#5,174 |
| 65. | White | 6.8% | 3.4%(+3.34)#65 | 3.5%(+3.30)#5,224 |
| 66. | Ethan | 6.7% | 3.4%(+3.27)#66 | 3.5%(+3.22)#5,310 |
| 67. | Bushnell | 6.7% | 3.4%(+3.23)#67 | 3.5%(+3.18)#5,382 |
| 68. | Wagner | 6.6% | 3.4%(+3.13)#68 | 3.5%(+3.09)#5,496 |
| 69. | Hosmer | 6.5% | 3.4%(+3.01)#69 | 3.5%(+2.97)#5,668 |
| 70. | Miller | 6.2% | 3.4%(+2.74)#70 | 3.5%(+2.70)#6,089 |
| 71. | Willow Lake | 6.1% | 3.4%(+2.70)#71 | 3.5%(+2.66)#6,158 |
| 72. | Flandreau | 6.1% | 3.4%(+2.65)#72 | 3.5%(+2.60)#6,221 |
| 73. | Egan | 5.9% | 3.4%(+2.50)#73 | 3.5%(+2.46)#6,485 |
| 74. | Highmore | 5.8% | 3.4%(+2.33)#74 | 3.5%(+2.28)#6,748 |
| 75. | Scotland | 5.7% | 3.4%(+2.27)#75 | 3.5%(+2.22)#6,852 |
| 76. | Harrold | 5.7% | 3.4%(+2.22)#76 | 3.5%(+2.18)#6,931 |
| 77. | Pollock | 5.6% | 3.4%(+2.19)#77 | 3.5%(+2.15)#6,982 |
| 78. | Cavour | 5.6% | 3.4%(+2.12)#78 | 3.5%(+2.07)#7,121 |
| 79. | St Francis | 5.5% | 3.4%(+2.09)#79 | 3.5%(+2.05)#7,159 |
| 80. | Hitchcock | 5.4% | 3.4%(+1.97)#80 | 3.5%(+1.92)#7,384 |
| 81. | Stratford | 5.4% | 3.4%(+1.97)#81 | 3.5%(+1.92)#7,386 |
| 82. | Elkton | 5.4% | 3.4%(+1.95)#82 | 3.5%(+1.90)#7,419 |
| 83. | Lemmon | 5.4% | 3.4%(+1.92)#83 | 3.5%(+1.87)#7,465 |
| 84. | Mclaughlin | 5.3% | 3.4%(+1.85)#84 | 3.5%(+1.80)#7,597 |
| 85. | Mitchell | 5.3% | 3.4%(+1.83)#85 | 3.5%(+1.79)#7,612 |
| 86. | Edgemont | 5.3% | 3.4%(+1.82)#86 | 3.5%(+1.78)#7,632 |
| 87. | Veblen | 5.3% | 3.4%(+1.82)#87 | 3.5%(+1.78)#7,642 |
| 88. | Frankfort | 5.3% | 3.4%(+1.82)#88 | 3.5%(+1.78)#7,661 |
| 89. | Dimock | 5.3% | 3.4%(+1.82)#89 | 3.5%(+1.78)#7,672 |
| 90. | Lennox | 5.2% | 3.4%(+1.75)#90 | 3.5%(+1.71)#7,835 |
| 91. | Green Valley | 5.2% | 3.4%(+1.75)#91 | 3.5%(+1.71)#7,841 |
| 92. | New Underwood | 5.2% | 3.4%(+1.75)#92 | 3.5%(+1.71)#7,843 |
| 93. | Avon | 5.1% | 3.4%(+1.69)#93 | 3.5%(+1.65)#7,965 |
| 94. | Reliance | 5.1% | 3.4%(+1.69)#94 | 3.5%(+1.65)#7,977 |
| 95. | Kennebec | 5.1% | 3.4%(+1.62)#95 | 3.5%(+1.58)#8,126 |
| 96. | Carthage | 5.1% | 3.4%(+1.62)#96 | 3.5%(+1.58)#8,129 |
| 97. | Fort Thompson | 5.0% | 3.4%(+1.61)#97 | 3.5%(+1.56)#8,167 |
| 98. | Mina | 5.0% | 3.4%(+1.59)#98 | 3.5%(+1.54)#8,198 |
| 99. | Camp Crook | 5.0% | 3.4%(+1.56)#99 | 3.5%(+1.52)#8,270 |
| 100. | Dallas | 4.9% | 3.4%(+1.48)#100 | 3.5%(+1.44)#8,447 |
Common Questions
What are the Top 10 Cities with the Highest Percentage of Population Employed in Cleaning & Maintenance in South Dakota?
Top 10 Cities with the Highest Percentage of Population Employed in Cleaning & Maintenance in South Dakota are:
What city has the Highest Percentage of Population Employed in Cleaning & Maintenance in South Dakota?
Parmelee has the Highest Percentage of Population Employed in Cleaning & Maintenance in South Dakota with 35.3%.
What is the Percentage of Population Employed in Cleaning & Maintenance in the State of South Dakota?
Percentage of Population Employed in Cleaning & Maintenance in South Dakota is 3.4%.
What is the Percentage of Population Employed in Cleaning & Maintenance in the United States?
Percentage of Population Employed in Cleaning & Maintenance in the United States is 3.5%.