Cities with the Highest Percentage of Population Employed in Cleaning & Maintenance in Utah
RELATED REPORTS & OPTIONS
Cleaning & Maintenance
Utah
Compare Cities
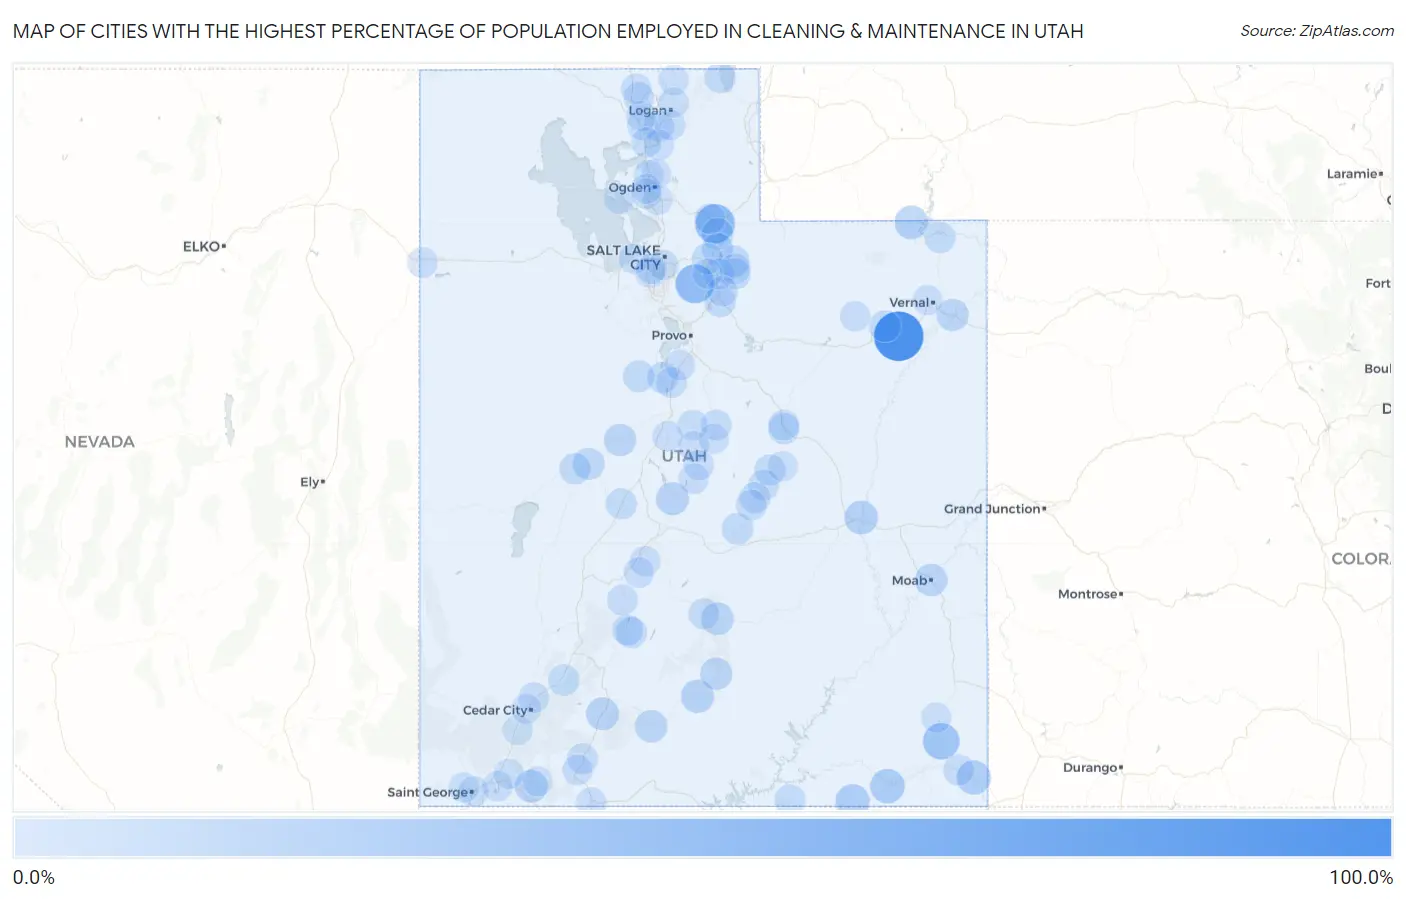
Map of Cities with the Highest Percentage of Population Employed in Cleaning & Maintenance in Utah
0.0%
100.0%
Cities with the Highest Percentage of Population Employed in Cleaning & Maintenance in Utah
| City | % Employed | vs State | vs National | |
| 1. | Randlett | 100.0% | 3.2%(+96.8)#1 | 3.5%(+96.5)#14 |
| 2. | Sundance | 50.0% | 3.2%(+46.8)#2 | 3.5%(+46.5)#85 |
| 3. | Echo | 48.7% | 3.2%(+45.5)#3 | 3.5%(+45.2)#95 |
| 4. | Alta | 46.2% | 3.2%(+43.0)#4 | 3.5%(+42.7)#104 |
| 5. | White Mesa | 34.6% | 3.2%(+31.4)#5 | 3.5%(+31.1)#191 |
| 6. | Halchita | 24.7% | 3.2%(+21.5)#6 | 3.5%(+21.2)#404 |
| 7. | Aneth | 23.5% | 3.2%(+20.3)#7 | 3.5%(+20.0)#447 |
| 8. | Oljato Monument Valley | 22.8% | 3.2%(+19.7)#8 | 3.5%(+19.4)#478 |
| 9. | Manila | 21.3% | 3.2%(+18.1)#9 | 3.5%(+17.8)#555 |
| 10. | Green River | 20.4% | 3.2%(+17.2)#10 | 3.5%(+16.9)#612 |
| 11. | Escalante | 18.4% | 3.2%(+15.2)#11 | 3.5%(+14.9)#738 |
| 12. | Centerfield | 17.2% | 3.2%(+14.0)#12 | 3.5%(+13.7)#852 |
| 13. | Hatch | 16.7% | 3.2%(+13.5)#13 | 3.5%(+13.2)#906 |
| 14. | Rockville | 16.2% | 3.2%(+13.0)#14 | 3.5%(+12.7)#970 |
| 15. | Torrey | 15.1% | 3.2%(+11.9)#15 | 3.5%(+11.6)#1,090 |
| 16. | Moab | 14.6% | 3.2%(+11.4)#16 | 3.5%(+11.1)#1,181 |
| 17. | Henrieville | 14.5% | 3.2%(+11.3)#17 | 3.5%(+11.0)#1,213 |
| 18. | Leamington | 14.3% | 3.2%(+11.1)#18 | 3.5%(+10.8)#1,236 |
| 19. | Boulder | 14.2% | 3.2%(+11.0)#19 | 3.5%(+10.7)#1,267 |
| 20. | Jensen | 13.6% | 3.2%(+10.4)#20 | 3.5%(+10.1)#1,386 |
| 21. | Delta | 11.5% | 3.2%(+8.36)#21 | 3.5%(+8.06)#1,988 |
| 22. | Oakley | 11.4% | 3.2%(+8.22)#22 | 3.5%(+7.92)#2,047 |
| 23. | Ballard | 11.3% | 3.2%(+8.07)#23 | 3.5%(+7.77)#2,111 |
| 24. | Coalville | 11.1% | 3.2%(+7.89)#24 | 3.5%(+7.59)#2,185 |
| 25. | Wanship | 10.9% | 3.2%(+7.75)#25 | 3.5%(+7.45)#2,231 |
| 26. | Daniel | 10.9% | 3.2%(+7.72)#26 | 3.5%(+7.42)#2,248 |
| 27. | Emery | 10.9% | 3.2%(+7.67)#27 | 3.5%(+7.37)#2,260 |
| 28. | Eureka | 10.8% | 3.2%(+7.59)#28 | 3.5%(+7.29)#2,294 |
| 29. | Hinckley | 10.4% | 3.2%(+7.22)#29 | 3.5%(+6.92)#2,451 |
| 30. | Kingston | 10.3% | 3.2%(+7.10)#30 | 3.5%(+6.80)#2,490 |
| 31. | Garden City | 9.4% | 3.2%(+6.25)#31 | 3.5%(+5.95)#2,925 |
| 32. | Paragonah | 9.3% | 3.2%(+6.13)#32 | 3.5%(+5.83)#2,991 |
| 33. | West Wood | 9.1% | 3.2%(+5.95)#33 | 3.5%(+5.65)#3,079 |
| 34. | Flaming Gorge | 9.1% | 3.2%(+5.91)#34 | 3.5%(+5.61)#3,118 |
| 35. | Kamas | 9.1% | 3.2%(+5.87)#35 | 3.5%(+5.57)#3,145 |
| 36. | Silver Summit | 9.0% | 3.2%(+5.81)#36 | 3.5%(+5.51)#3,179 |
| 37. | Navajo Mountain | 8.6% | 3.2%(+5.46)#37 | 3.5%(+5.16)#3,449 |
| 38. | Huntington | 8.6% | 3.2%(+5.37)#38 | 3.5%(+5.07)#3,504 |
| 39. | Holden | 8.3% | 3.2%(+5.15)#39 | 3.5%(+4.85)#3,656 |
| 40. | Goshen | 8.2% | 3.2%(+4.98)#40 | 3.5%(+4.69)#3,820 |
| 41. | Bicknell | 7.9% | 3.2%(+4.77)#41 | 3.5%(+4.47)#4,003 |
| 42. | Hideout | 7.9% | 3.2%(+4.75)#42 | 3.5%(+4.45)#4,023 |
| 43. | Castle Dale | 7.9% | 3.2%(+4.71)#43 | 3.5%(+4.41)#4,056 |
| 44. | Glendale | 7.9% | 3.2%(+4.71)#44 | 3.5%(+4.41)#4,060 |
| 45. | Clawson | 7.7% | 3.2%(+4.51)#45 | 3.5%(+4.21)#4,252 |
| 46. | Montezuma Creek | 7.5% | 3.2%(+4.28)#46 | 3.5%(+3.98)#4,450 |
| 47. | Ferron | 7.4% | 3.2%(+4.26)#47 | 3.5%(+3.96)#4,479 |
| 48. | Junction | 7.4% | 3.2%(+4.22)#48 | 3.5%(+3.92)#4,506 |
| 49. | Rocky Ridge | 7.4% | 3.2%(+4.20)#49 | 3.5%(+3.90)#4,542 |
| 50. | Carbonville | 7.0% | 3.2%(+3.86)#50 | 3.5%(+3.56)#4,879 |
| 51. | Marysvale | 6.9% | 3.2%(+3.75)#51 | 3.5%(+3.45)#5,011 |
| 52. | Fairview | 6.9% | 3.2%(+3.71)#52 | 3.5%(+3.41)#5,043 |
| 53. | Wellsville | 6.8% | 3.2%(+3.57)#53 | 3.5%(+3.27)#5,252 |
| 54. | Fountain Green | 6.4% | 3.2%(+3.21)#54 | 3.5%(+2.91)#5,744 |
| 55. | Henefer | 6.3% | 3.2%(+3.17)#55 | 3.5%(+2.87)#5,805 |
| 56. | Honeyville | 6.3% | 3.2%(+3.15)#56 | 3.5%(+2.85)#5,838 |
| 57. | Wendover | 6.3% | 3.2%(+3.14)#57 | 3.5%(+2.84)#5,843 |
| 58. | Wales | 6.2% | 3.2%(+3.07)#58 | 3.5%(+2.77)#5,964 |
| 59. | Enoch | 6.1% | 3.2%(+2.96)#59 | 3.5%(+2.66)#6,155 |
| 60. | Kearns | 6.1% | 3.2%(+2.88)#60 | 3.5%(+2.58)#6,282 |
| 61. | Marion | 5.8% | 3.2%(+2.65)#61 | 3.5%(+2.35)#6,632 |
| 62. | Fielding | 5.8% | 3.2%(+2.63)#62 | 3.5%(+2.33)#6,660 |
| 63. | Levan | 5.8% | 3.2%(+2.62)#63 | 3.5%(+2.32)#6,676 |
| 64. | Manti | 5.6% | 3.2%(+2.42)#64 | 3.5%(+2.12)#7,041 |
| 65. | Annabella | 5.5% | 3.2%(+2.36)#65 | 3.5%(+2.06)#7,142 |
| 66. | Plymouth | 5.5% | 3.2%(+2.34)#66 | 3.5%(+2.04)#7,163 |
| 67. | Hurricane | 5.5% | 3.2%(+2.33)#67 | 3.5%(+2.03)#7,181 |
| 68. | Ephraim | 5.4% | 3.2%(+2.20)#68 | 3.5%(+1.90)#7,431 |
| 69. | Mantua | 5.4% | 3.2%(+2.20)#69 | 3.5%(+1.90)#7,432 |
| 70. | Orderville | 5.3% | 3.2%(+2.12)#70 | 3.5%(+1.82)#7,565 |
| 71. | Bluebell | 5.3% | 3.2%(+2.12)#71 | 3.5%(+1.82)#7,567 |
| 72. | Monroe | 5.3% | 3.2%(+2.09)#72 | 3.5%(+1.79)#7,619 |
| 73. | Hyrum | 5.3% | 3.2%(+2.07)#73 | 3.5%(+1.77)#7,693 |
| 74. | Heber | 5.2% | 3.2%(+2.02)#74 | 3.5%(+1.72)#7,795 |
| 75. | Kanab | 5.2% | 3.2%(+2.00)#75 | 3.5%(+1.70)#7,855 |
| 76. | South Salt Lake | 5.0% | 3.2%(+1.82)#76 | 3.5%(+1.52)#8,234 |
| 77. | Payson | 5.0% | 3.2%(+1.78)#77 | 3.5%(+1.48)#8,328 |
| 78. | Magna | 4.9% | 3.2%(+1.71)#78 | 3.5%(+1.42)#8,482 |
| 79. | Deweyville | 4.8% | 3.2%(+1.64)#79 | 3.5%(+1.34)#8,654 |
| 80. | La Verkin | 4.8% | 3.2%(+1.63)#80 | 3.5%(+1.33)#8,684 |
| 81. | Brigham City | 4.7% | 3.2%(+1.56)#81 | 3.5%(+1.26)#8,885 |
| 82. | Richmond | 4.7% | 3.2%(+1.52)#82 | 3.5%(+1.22)#8,953 |
| 83. | Maeser | 4.7% | 3.2%(+1.52)#83 | 3.5%(+1.22)#8,971 |
| 84. | Farr West | 4.6% | 3.2%(+1.38)#84 | 3.5%(+1.08)#9,322 |
| 85. | Cleveland | 4.6% | 3.2%(+1.38)#85 | 3.5%(+1.08)#9,325 |
| 86. | Blanding | 4.5% | 3.2%(+1.29)#86 | 3.5%(+0.989)#9,584 |
| 87. | Santa Clara | 4.5% | 3.2%(+1.28)#87 | 3.5%(+0.983)#9,608 |
| 88. | Hooper | 4.4% | 3.2%(+1.26)#88 | 3.5%(+0.963)#9,644 |
| 89. | St George | 4.4% | 3.2%(+1.24)#89 | 3.5%(+0.938)#9,728 |
| 90. | Kanarraville | 4.4% | 3.2%(+1.19)#90 | 3.5%(+0.892)#9,861 |
| 91. | Mount Pleasant | 4.3% | 3.2%(+1.17)#91 | 3.5%(+0.865)#9,935 |
| 92. | North Ogden | 4.3% | 3.2%(+1.13)#92 | 3.5%(+0.831)#10,051 |
| 93. | Park City | 4.3% | 3.2%(+1.12)#93 | 3.5%(+0.818)#10,100 |
| 94. | Roy | 4.3% | 3.2%(+1.08)#94 | 3.5%(+0.776)#10,186 |
| 95. | Cedar City | 4.2% | 3.2%(+1.02)#95 | 3.5%(+0.720)#10,360 |
| 96. | North Logan | 4.2% | 3.2%(+1.02)#96 | 3.5%(+0.716)#10,378 |
| 97. | South Weber | 4.2% | 3.2%(+0.991)#97 | 3.5%(+0.691)#10,438 |
| 98. | West Valley City | 4.2% | 3.2%(+0.985)#98 | 3.5%(+0.685)#10,453 |
| 99. | West Haven | 4.1% | 3.2%(+0.910)#99 | 3.5%(+0.610)#10,713 |
| 100. | Springdale | 4.1% | 3.2%(+0.908)#100 | 3.5%(+0.608)#10,720 |
Common Questions
What are the Top 10 Cities with the Highest Percentage of Population Employed in Cleaning & Maintenance in Utah?
Top 10 Cities with the Highest Percentage of Population Employed in Cleaning & Maintenance in Utah are:
#1
100.0%
#2
48.7%
#3
46.2%
#4
34.6%
#5
24.7%
#6
23.5%
#7
22.8%
#8
21.3%
#9
20.4%
#10
18.4%
What city has the Highest Percentage of Population Employed in Cleaning & Maintenance in Utah?
Randlett has the Highest Percentage of Population Employed in Cleaning & Maintenance in Utah with 100.0%.
What is the Percentage of Population Employed in Cleaning & Maintenance in the State of Utah?
Percentage of Population Employed in Cleaning & Maintenance in Utah is 3.2%.
What is the Percentage of Population Employed in Cleaning & Maintenance in the United States?
Percentage of Population Employed in Cleaning & Maintenance in the United States is 3.5%.