Cities with the Highest Percentage of Population Employed in Cleaning & Maintenance in Virginia
RELATED REPORTS & OPTIONS
Cleaning & Maintenance
Virginia
Compare Cities
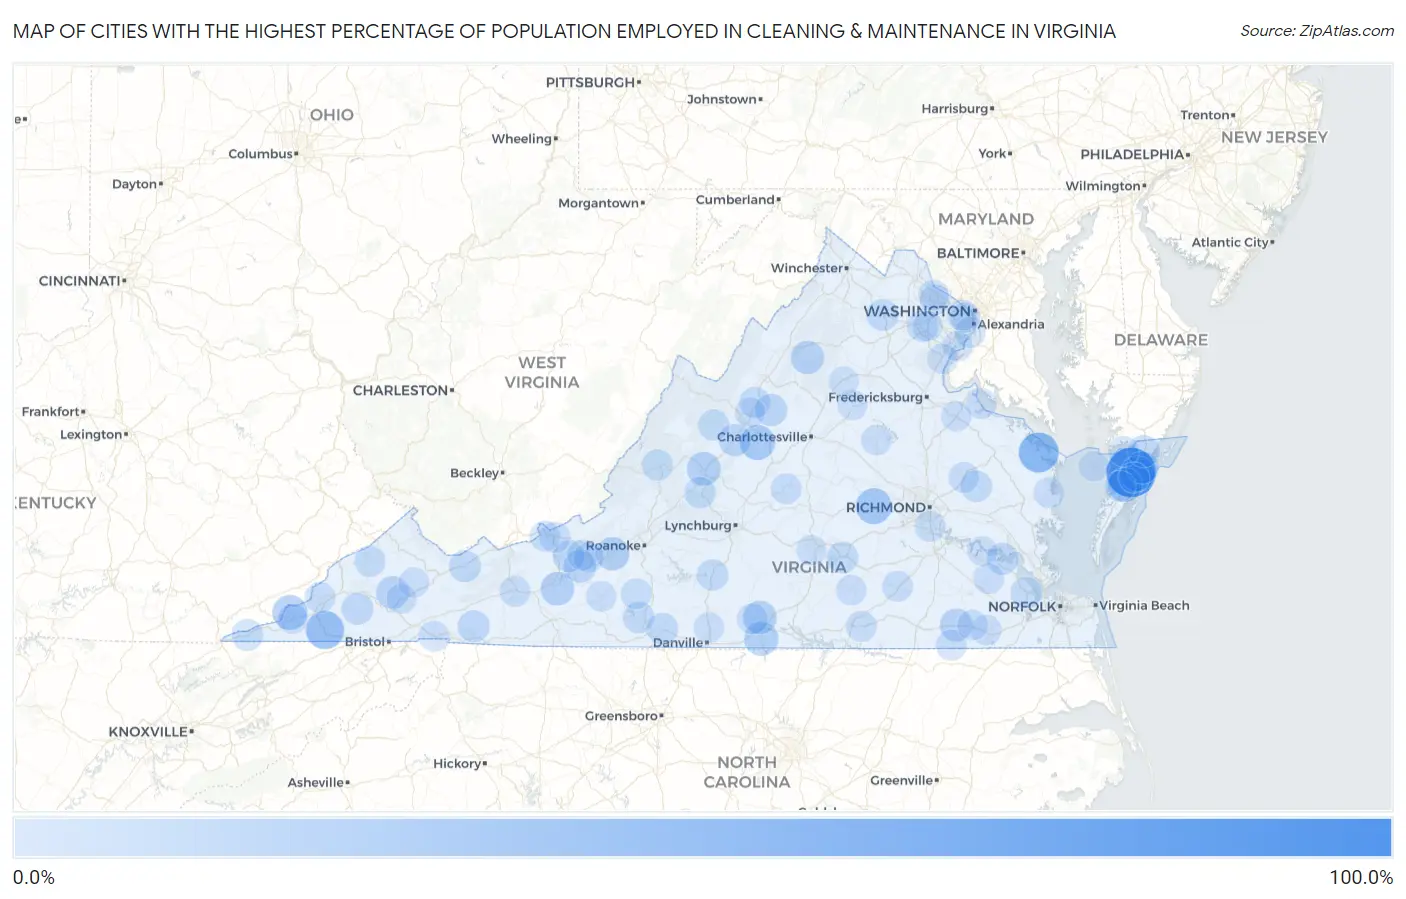
Map of Cities with the Highest Percentage of Population Employed in Cleaning & Maintenance in Virginia
0.0%
100.0%
Cities with the Highest Percentage of Population Employed in Cleaning & Maintenance in Virginia
| City | % Employed | vs State | vs National | |
| 1. | Stonega | 100.0% | 3.1%(+96.9)#1 | 3.5%(+96.5)#7 |
| 2. | Whitesville | 100.0% | 3.1%(+96.9)#2 | 3.5%(+96.5)#16 |
| 3. | Heathsville | 52.6% | 3.1%(+49.5)#3 | 3.5%(+49.1)#75 |
| 4. | Clinchport | 44.4% | 3.1%(+41.3)#4 | 3.5%(+41.0)#116 |
| 5. | Powhatan | 33.3% | 3.1%(+30.2)#5 | 3.5%(+29.9)#209 |
| 6. | Sherando | 29.4% | 3.1%(+26.2)#6 | 3.5%(+25.9)#277 |
| 7. | Metompkin | 28.7% | 3.1%(+25.5)#7 | 3.5%(+25.2)#295 |
| 8. | St Charles | 28.6% | 3.1%(+25.4)#8 | 3.5%(+25.1)#300 |
| 9. | Onley | 24.7% | 3.1%(+21.6)#9 | 3.5%(+21.2)#405 |
| 10. | Cluster Springs | 24.5% | 3.1%(+21.3)#10 | 3.5%(+21.0)#412 |
| 11. | East Lexington | 24.0% | 3.1%(+20.9)#11 | 3.5%(+20.5)#425 |
| 12. | Afton | 22.6% | 3.1%(+19.5)#12 | 3.5%(+19.1)#488 |
| 13. | Hiwassee | 22.2% | 3.1%(+19.1)#13 | 3.5%(+18.7)#510 |
| 14. | Elliston | 22.0% | 3.1%(+18.9)#14 | 3.5%(+18.5)#530 |
| 15. | Halifax | 22.0% | 3.1%(+18.8)#15 | 3.5%(+18.5)#531 |
| 16. | Breaks | 21.9% | 3.1%(+18.7)#16 | 3.5%(+18.4)#534 |
| 17. | Stanley | 20.4% | 3.1%(+17.3)#17 | 3.5%(+16.9)#610 |
| 18. | Cleveland | 19.4% | 3.1%(+16.2)#18 | 3.5%(+15.9)#679 |
| 19. | Capron | 19.0% | 3.1%(+15.8)#19 | 3.5%(+15.5)#706 |
| 20. | Plum Creek | 17.8% | 3.1%(+14.6)#20 | 3.5%(+14.3)#803 |
| 21. | Greenville | 16.9% | 3.1%(+13.8)#21 | 3.5%(+13.4)#889 |
| 22. | Modest Town | 16.5% | 3.1%(+13.4)#22 | 3.5%(+13.0)#932 |
| 23. | East Stone Gap | 16.2% | 3.1%(+13.1)#23 | 3.5%(+12.7)#963 |
| 24. | Harriston | 16.1% | 3.1%(+13.0)#24 | 3.5%(+12.6)#977 |
| 25. | Troutdale | 15.1% | 3.1%(+11.9)#25 | 3.5%(+11.6)#1,098 |
| 26. | Oak Hall | 15.0% | 3.1%(+11.9)#26 | 3.5%(+11.5)#1,116 |
| 27. | Dungannon | 14.6% | 3.1%(+11.5)#27 | 3.5%(+11.1)#1,179 |
| 28. | Belspring | 14.6% | 3.1%(+11.5)#28 | 3.5%(+11.1)#1,186 |
| 29. | Scotland | 14.6% | 3.1%(+11.5)#29 | 3.5%(+11.1)#1,187 |
| 30. | Tazewell | 14.5% | 3.1%(+11.4)#30 | 3.5%(+11.1)#1,198 |
| 31. | Weems | 13.9% | 3.1%(+10.8)#31 | 3.5%(+10.4)#1,319 |
| 32. | Marshall | 13.6% | 3.1%(+10.5)#32 | 3.5%(+10.1)#1,390 |
| 33. | Keezletown | 13.3% | 3.1%(+10.2)#33 | 3.5%(+9.85)#1,443 |
| 34. | Burkeville | 13.3% | 3.1%(+10.2)#34 | 3.5%(+9.85)#1,444 |
| 35. | Laurel Park | 13.3% | 3.1%(+10.2)#35 | 3.5%(+9.82)#1,459 |
| 36. | Ewing | 13.2% | 3.1%(+10.1)#36 | 3.5%(+9.71)#1,486 |
| 37. | Motley | 13.2% | 3.1%(+10.0)#37 | 3.5%(+9.69)#1,490 |
| 38. | The University Of Virginia's College At Wise | 12.8% | 3.1%(+9.68)#38 | 3.5%(+9.33)#1,605 |
| 39. | Bassett | 12.7% | 3.1%(+9.56)#39 | 3.5%(+9.21)#1,640 |
| 40. | Baywood | 12.7% | 3.1%(+9.52)#40 | 3.5%(+9.17)#1,648 |
| 41. | King William | 12.3% | 3.1%(+9.22)#41 | 3.5%(+8.86)#1,750 |
| 42. | Hutchison | 12.0% | 3.1%(+8.88)#42 | 3.5%(+8.52)#1,851 |
| 43. | Glasgow | 12.0% | 3.1%(+8.83)#43 | 3.5%(+8.47)#1,875 |
| 44. | Benns Church | 11.5% | 3.1%(+8.41)#44 | 3.5%(+8.06)#1,989 |
| 45. | Sudley | 11.5% | 3.1%(+8.34)#45 | 3.5%(+7.98)#2,024 |
| 46. | Augusta Springs | 11.4% | 3.1%(+8.26)#46 | 3.5%(+7.91)#2,056 |
| 47. | Clifton Forge | 11.2% | 3.1%(+8.11)#47 | 3.5%(+7.76)#2,115 |
| 48. | Ripplemead | 10.7% | 3.1%(+7.60)#48 | 3.5%(+7.25)#2,309 |
| 49. | Mount Sidney | 10.7% | 3.1%(+7.53)#49 | 3.5%(+7.18)#2,336 |
| 50. | Linville | 10.7% | 3.1%(+7.53)#50 | 3.5%(+7.17)#2,338 |
| 51. | Clinchco | 10.6% | 3.1%(+7.51)#51 | 3.5%(+7.16)#2,344 |
| 52. | Pearisburg | 10.1% | 3.1%(+7.01)#52 | 3.5%(+6.66)#2,551 |
| 53. | Bellwood | 10.1% | 3.1%(+6.96)#53 | 3.5%(+6.61)#2,574 |
| 54. | Mountain Road | 10.0% | 3.1%(+6.85)#54 | 3.5%(+6.49)#2,647 |
| 55. | Ferrum | 9.9% | 3.1%(+6.76)#55 | 3.5%(+6.41)#2,694 |
| 56. | Hiltons | 9.9% | 3.1%(+6.75)#56 | 3.5%(+6.39)#2,706 |
| 57. | Wytheville | 9.7% | 3.1%(+6.55)#57 | 3.5%(+6.19)#2,803 |
| 58. | Bastian | 9.6% | 3.1%(+6.51)#58 | 3.5%(+6.16)#2,818 |
| 59. | Hybla Valley | 9.6% | 3.1%(+6.51)#59 | 3.5%(+6.15)#2,820 |
| 60. | Brodnax | 9.6% | 3.1%(+6.44)#60 | 3.5%(+6.09)#2,861 |
| 61. | Appalachia | 9.4% | 3.1%(+6.28)#61 | 3.5%(+5.93)#2,939 |
| 62. | Mckenney | 9.3% | 3.1%(+6.20)#62 | 3.5%(+5.84)#2,985 |
| 63. | Savageville | 9.3% | 3.1%(+6.15)#63 | 3.5%(+5.80)#3,006 |
| 64. | Yogaville | 9.2% | 3.1%(+6.10)#64 | 3.5%(+5.75)#3,033 |
| 65. | Branchville | 9.2% | 3.1%(+6.10)#65 | 3.5%(+5.75)#3,034 |
| 66. | Saxis | 9.1% | 3.1%(+5.96)#66 | 3.5%(+5.61)#3,099 |
| 67. | Central Garage | 9.0% | 3.1%(+5.86)#67 | 3.5%(+5.50)#3,187 |
| 68. | Narrows | 9.0% | 3.1%(+5.85)#68 | 3.5%(+5.50)#3,192 |
| 69. | White Stone | 8.8% | 3.1%(+5.68)#69 | 3.5%(+5.32)#3,322 |
| 70. | Dendron | 8.7% | 3.1%(+5.53)#70 | 3.5%(+5.18)#3,434 |
| 71. | Franklin | 8.6% | 3.1%(+5.45)#71 | 3.5%(+5.10)#3,484 |
| 72. | Mineral | 8.5% | 3.1%(+5.41)#72 | 3.5%(+5.05)#3,517 |
| 73. | Colonial Beach | 8.5% | 3.1%(+5.35)#73 | 3.5%(+5.00)#3,556 |
| 74. | Damascus | 8.5% | 3.1%(+5.33)#74 | 3.5%(+4.98)#3,567 |
| 75. | Dumfries | 8.5% | 3.1%(+5.32)#75 | 3.5%(+4.97)#3,574 |
| 76. | Seven Corners | 8.4% | 3.1%(+5.29)#76 | 3.5%(+4.94)#3,605 |
| 77. | Woodlawn Cdp Fairfax County | 8.4% | 3.1%(+5.26)#77 | 3.5%(+4.91)#3,623 |
| 78. | Kenbridge | 8.3% | 3.1%(+5.20)#78 | 3.5%(+4.85)#3,652 |
| 79. | Courtland | 8.3% | 3.1%(+5.16)#79 | 3.5%(+4.81)#3,712 |
| 80. | Herndon | 8.2% | 3.1%(+5.11)#80 | 3.5%(+4.76)#3,757 |
| 81. | Disputanta | 8.1% | 3.1%(+4.96)#81 | 3.5%(+4.61)#3,888 |
| 82. | Pennington Gap | 8.0% | 3.1%(+4.92)#82 | 3.5%(+4.57)#3,923 |
| 83. | Port Royal | 8.0% | 3.1%(+4.92)#83 | 3.5%(+4.56)#3,927 |
| 84. | Floyd | 8.0% | 3.1%(+4.90)#84 | 3.5%(+4.55)#3,938 |
| 85. | Honaker | 8.0% | 3.1%(+4.89)#85 | 3.5%(+4.54)#3,950 |
| 86. | Blairs | 8.0% | 3.1%(+4.88)#86 | 3.5%(+4.53)#3,960 |
| 87. | Prices Fork | 8.0% | 3.1%(+4.86)#87 | 3.5%(+4.51)#3,974 |
| 88. | Verona | 7.9% | 3.1%(+4.78)#88 | 3.5%(+4.43)#4,046 |
| 89. | Sterling | 7.7% | 3.1%(+4.56)#89 | 3.5%(+4.20)#4,259 |
| 90. | Mason Neck | 7.5% | 3.1%(+4.33)#90 | 3.5%(+3.97)#4,460 |
| 91. | Yorkshire | 7.2% | 3.1%(+4.06)#91 | 3.5%(+3.70)#4,740 |
| 92. | Tangier | 7.0% | 3.1%(+3.86)#92 | 3.5%(+3.51)#4,950 |
| 93. | Merrimac | 7.0% | 3.1%(+3.85)#93 | 3.5%(+3.50)#4,954 |
| 94. | Bailey S Crossroads | 6.8% | 3.1%(+3.69)#94 | 3.5%(+3.34)#5,155 |
| 95. | Lebanon | 6.8% | 3.1%(+3.65)#95 | 3.5%(+3.30)#5,212 |
| 96. | Orange | 6.7% | 3.1%(+3.58)#96 | 3.5%(+3.22)#5,311 |
| 97. | Pastoria | 6.7% | 3.1%(+3.54)#97 | 3.5%(+3.18)#5,357 |
| 98. | Brightwood | 6.6% | 3.1%(+3.47)#98 | 3.5%(+3.12)#5,437 |
| 99. | Claremont | 6.6% | 3.1%(+3.46)#99 | 3.5%(+3.11)#5,455 |
| 100. | Hampden Sydney | 6.6% | 3.1%(+3.46)#100 | 3.5%(+3.11)#5,457 |
Common Questions
What are the Top 10 Cities with the Highest Percentage of Population Employed in Cleaning & Maintenance in Virginia?
Top 10 Cities with the Highest Percentage of Population Employed in Cleaning & Maintenance in Virginia are:
#1
100.0%
#2
52.6%
#3
44.4%
#4
33.3%
#5
29.4%
#6
28.7%
#7
28.6%
#8
24.7%
#9
24.5%
#10
24.0%
What city has the Highest Percentage of Population Employed in Cleaning & Maintenance in Virginia?
Whitesville has the Highest Percentage of Population Employed in Cleaning & Maintenance in Virginia with 100.0%.
What is the Percentage of Population Employed in Cleaning & Maintenance in the State of Virginia?
Percentage of Population Employed in Cleaning & Maintenance in Virginia is 3.1%.
What is the Percentage of Population Employed in Cleaning & Maintenance in the United States?
Percentage of Population Employed in Cleaning & Maintenance in the United States is 3.5%.