Cities with the Highest Percentage of Population Employed in Cleaning & Maintenance in Michigan
RELATED REPORTS & OPTIONS
Cleaning & Maintenance
Michigan
Compare Cities
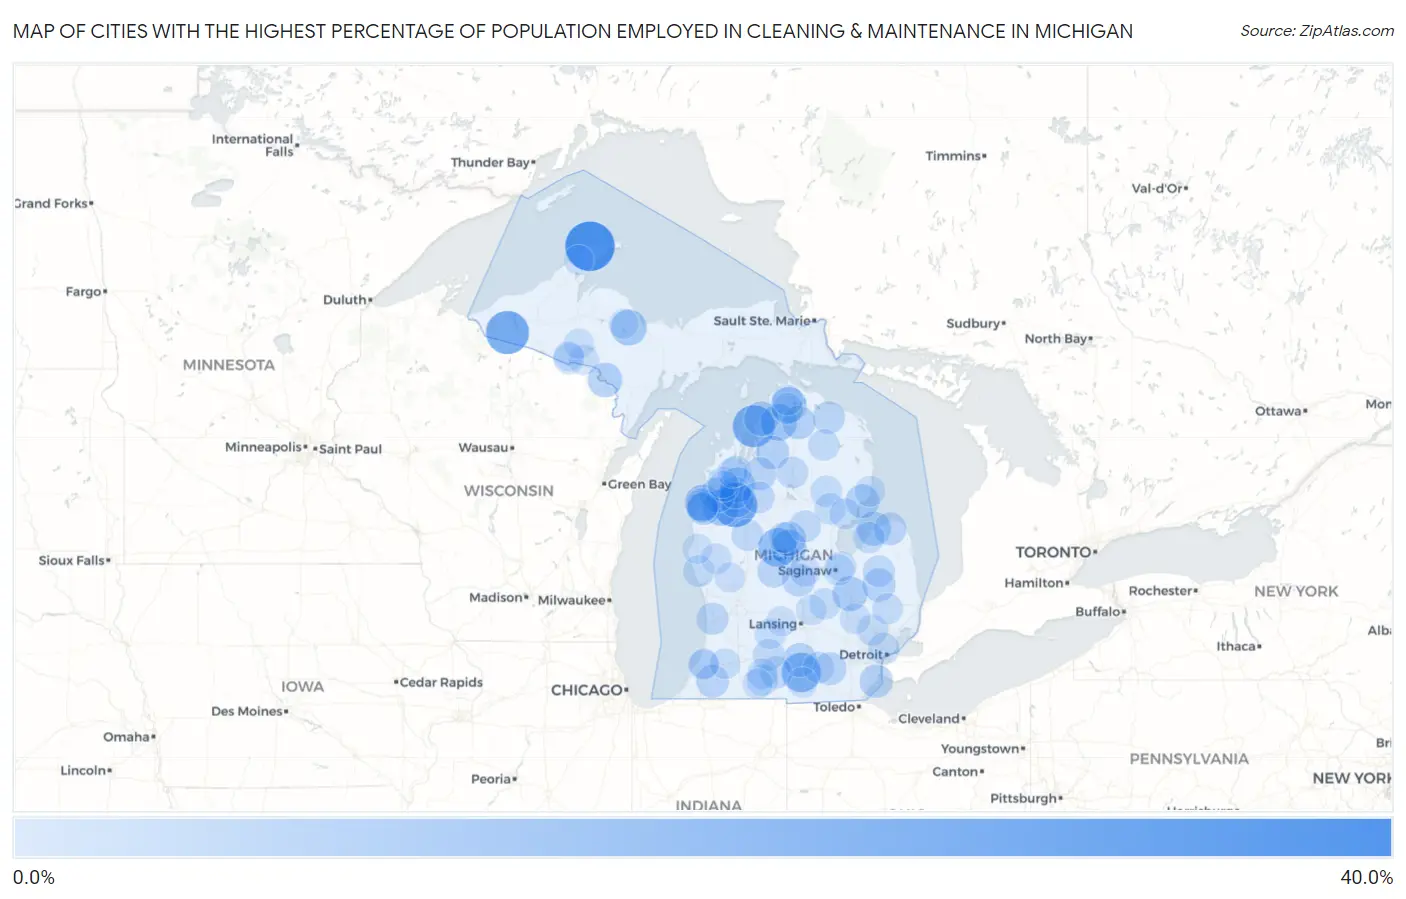
Map of Cities with the Highest Percentage of Population Employed in Cleaning & Maintenance in Michigan
0.0%
40.0%
Cities with the Highest Percentage of Population Employed in Cleaning & Maintenance in Michigan
| City | % Employed | vs State | vs National | |
| 1. | Eagle River | 35.7% | 3.4%(+32.3)#1 | 3.5%(+32.2)#182 |
| 2. | Caberfae | 27.8% | 3.4%(+24.4)#2 | 3.5%(+24.3)#314 |
| 3. | Marenisco | 26.0% | 3.4%(+22.6)#3 | 3.5%(+22.5)#361 |
| 4. | Norwood | 24.4% | 3.4%(+21.1)#4 | 3.5%(+21.0)#413 |
| 5. | Bergland | 23.4% | 3.4%(+20.0)#5 | 3.5%(+19.9)#454 |
| 6. | Hanover | 20.3% | 3.4%(+16.9)#6 | 3.5%(+16.8)#617 |
| 7. | Weidman | 19.0% | 3.4%(+15.6)#7 | 3.5%(+15.5)#705 |
| 8. | Mears | 16.5% | 3.4%(+13.2)#8 | 3.5%(+13.1)#925 |
| 9. | Walloon Lake | 16.1% | 3.4%(+12.8)#9 | 3.5%(+12.7)#972 |
| 10. | Wellston | 16.0% | 3.4%(+12.6)#10 | 3.5%(+12.5)#982 |
| 11. | Palmer | 15.3% | 3.4%(+12.0)#11 | 3.5%(+11.9)#1,066 |
| 12. | Dodgeville | 15.0% | 3.4%(+11.6)#12 | 3.5%(+11.5)#1,118 |
| 13. | Brutus | 15.0% | 3.4%(+11.6)#13 | 3.5%(+11.5)#1,119 |
| 14. | Parkdale | 14.8% | 3.4%(+11.5)#14 | 3.5%(+11.3)#1,136 |
| 15. | Rosebush | 14.5% | 3.4%(+11.1)#15 | 3.5%(+11.0)#1,215 |
| 16. | Atlantic Mine | 14.0% | 3.4%(+10.6)#16 | 3.5%(+10.5)#1,291 |
| 17. | Buckley | 14.0% | 3.4%(+10.6)#17 | 3.5%(+10.5)#1,292 |
| 18. | Harrietta | 14.0% | 3.4%(+10.6)#18 | 3.5%(+10.5)#1,301 |
| 19. | Kaleva | 13.8% | 3.4%(+10.4)#19 | 3.5%(+10.3)#1,355 |
| 20. | Mount Morris | 13.7% | 3.4%(+10.4)#20 | 3.5%(+10.3)#1,358 |
| 21. | Mohawk | 13.7% | 3.4%(+10.3)#21 | 3.5%(+10.2)#1,361 |
| 22. | Stronach | 13.5% | 3.4%(+10.2)#22 | 3.5%(+10.1)#1,401 |
| 23. | Charlevoix | 13.4% | 3.4%(+9.99)#23 | 3.5%(+9.88)#1,439 |
| 24. | Quinnesec | 13.3% | 3.4%(+9.94)#24 | 3.5%(+9.84)#1,458 |
| 25. | Caseville | 13.1% | 3.4%(+9.70)#25 | 3.5%(+9.59)#1,515 |
| 26. | Fulton | 13.0% | 3.4%(+9.58)#26 | 3.5%(+9.48)#1,555 |
| 27. | Clare | 12.9% | 3.4%(+9.55)#27 | 3.5%(+9.44)#1,562 |
| 28. | Painesdale | 12.8% | 3.4%(+9.40)#28 | 3.5%(+9.30)#1,616 |
| 29. | Kincheloe | 12.5% | 3.4%(+9.12)#29 | 3.5%(+9.02)#1,681 |
| 30. | East Tawas | 12.4% | 3.4%(+9.03)#30 | 3.5%(+8.92)#1,735 |
| 31. | Parma | 12.3% | 3.4%(+8.94)#31 | 3.5%(+8.84)#1,753 |
| 32. | Eastlake | 11.9% | 3.4%(+8.53)#32 | 3.5%(+8.42)#1,891 |
| 33. | Wolverine | 11.8% | 3.4%(+8.45)#33 | 3.5%(+8.35)#1,915 |
| 34. | Mancelona | 11.8% | 3.4%(+8.42)#34 | 3.5%(+8.31)#1,919 |
| 35. | Estral Beach | 11.6% | 3.4%(+8.24)#35 | 3.5%(+8.13)#1,973 |
| 36. | North Branch | 11.1% | 3.4%(+7.76)#36 | 3.5%(+7.65)#2,145 |
| 37. | South Boardman | 11.1% | 3.4%(+7.73)#37 | 3.5%(+7.63)#2,154 |
| 38. | Ithaca | 11.1% | 3.4%(+7.68)#38 | 3.5%(+7.57)#2,188 |
| 39. | Manchester | 11.0% | 3.4%(+7.60)#39 | 3.5%(+7.49)#2,212 |
| 40. | Dowagiac | 10.9% | 3.4%(+7.55)#40 | 3.5%(+7.45)#2,235 |
| 41. | Kinde | 10.8% | 3.4%(+7.38)#41 | 3.5%(+7.28)#2,298 |
| 42. | Edmore | 10.6% | 3.4%(+7.22)#42 | 3.5%(+7.12)#2,359 |
| 43. | Millersburg | 10.2% | 3.4%(+6.82)#43 | 3.5%(+6.72)#2,523 |
| 44. | Beechwood | 10.1% | 3.4%(+6.71)#44 | 3.5%(+6.61)#2,571 |
| 45. | Elm Hall | 9.8% | 3.4%(+6.46)#45 | 3.5%(+6.35)#2,726 |
| 46. | Mesick | 9.8% | 3.4%(+6.39)#46 | 3.5%(+6.29)#2,761 |
| 47. | Highland Park | 9.5% | 3.4%(+6.08)#47 | 3.5%(+5.98)#2,910 |
| 48. | Reed City | 9.4% | 3.4%(+6.06)#48 | 3.5%(+5.96)#2,917 |
| 49. | Jennings | 9.4% | 3.4%(+6.03)#49 | 3.5%(+5.93)#2,942 |
| 50. | Gladwin | 9.4% | 3.4%(+6.03)#50 | 3.5%(+5.92)#2,945 |
| 51. | Grayling | 9.4% | 3.4%(+6.02)#51 | 3.5%(+5.92)#2,950 |
| 52. | Kingston | 9.3% | 3.4%(+5.94)#52 | 3.5%(+5.83)#2,989 |
| 53. | Tekonsha | 9.3% | 3.4%(+5.93)#53 | 3.5%(+5.83)#2,993 |
| 54. | Brownlee Park | 9.3% | 3.4%(+5.87)#54 | 3.5%(+5.77)#3,023 |
| 55. | Napoleon | 9.1% | 3.4%(+5.71)#55 | 3.5%(+5.61)#3,093 |
| 56. | Rockland | 9.1% | 3.4%(+5.71)#56 | 3.5%(+5.61)#3,107 |
| 57. | Montague | 9.1% | 3.4%(+5.70)#57 | 3.5%(+5.60)#3,129 |
| 58. | Brimley | 8.9% | 3.4%(+5.52)#58 | 3.5%(+5.42)#3,235 |
| 59. | Bay Port | 8.9% | 3.4%(+5.52)#59 | 3.5%(+5.42)#3,243 |
| 60. | Sherwood | 8.9% | 3.4%(+5.51)#60 | 3.5%(+5.41)#3,254 |
| 61. | Atlanta | 8.8% | 3.4%(+5.46)#61 | 3.5%(+5.36)#3,302 |
| 62. | Buena Vista | 8.8% | 3.4%(+5.46)#62 | 3.5%(+5.36)#3,304 |
| 63. | Rose City | 8.8% | 3.4%(+5.42)#63 | 3.5%(+5.31)#3,326 |
| 64. | Alanson | 8.8% | 3.4%(+5.37)#64 | 3.5%(+5.27)#3,361 |
| 65. | Middletown | 8.7% | 3.4%(+5.32)#65 | 3.5%(+5.21)#3,386 |
| 66. | Skidway Lake | 8.7% | 3.4%(+5.28)#66 | 3.5%(+5.18)#3,432 |
| 67. | Pontiac | 8.6% | 3.4%(+5.19)#67 | 3.5%(+5.09)#3,498 |
| 68. | Caspian | 8.5% | 3.4%(+5.17)#68 | 3.5%(+5.06)#3,507 |
| 69. | Shaftsburg | 8.4% | 3.4%(+5.07)#69 | 3.5%(+4.96)#3,583 |
| 70. | Almont | 8.3% | 3.4%(+4.95)#70 | 3.5%(+4.85)#3,650 |
| 71. | Turner | 8.3% | 3.4%(+4.95)#71 | 3.5%(+4.85)#3,682 |
| 72. | Thompsonville | 8.3% | 3.4%(+4.88)#72 | 3.5%(+4.78)#3,732 |
| 73. | Grawn | 8.3% | 3.4%(+4.87)#73 | 3.5%(+4.77)#3,739 |
| 74. | Breckenridge | 8.2% | 3.4%(+4.86)#74 | 3.5%(+4.75)#3,758 |
| 75. | Copemish | 8.2% | 3.4%(+4.86)#75 | 3.5%(+4.75)#3,763 |
| 76. | Farwell | 8.1% | 3.4%(+4.69)#76 | 3.5%(+4.59)#3,899 |
| 77. | Hesperia | 8.0% | 3.4%(+4.67)#77 | 3.5%(+4.57)#3,922 |
| 78. | Holly | 8.0% | 3.4%(+4.63)#78 | 3.5%(+4.53)#3,956 |
| 79. | Pellston | 7.9% | 3.4%(+4.54)#79 | 3.5%(+4.44)#4,031 |
| 80. | Lake Victoria | 7.9% | 3.4%(+4.54)#80 | 3.5%(+4.43)#4,037 |
| 81. | Nashville | 7.8% | 3.4%(+4.46)#81 | 3.5%(+4.35)#4,113 |
| 82. | Athens | 7.8% | 3.4%(+4.45)#82 | 3.5%(+4.35)#4,119 |
| 83. | Paw Paw | 7.8% | 3.4%(+4.42)#83 | 3.5%(+4.31)#4,150 |
| 84. | Oscoda | 7.8% | 3.4%(+4.41)#84 | 3.5%(+4.31)#4,154 |
| 85. | Interlochen | 7.7% | 3.4%(+4.31)#85 | 3.5%(+4.21)#4,225 |
| 86. | Watervliet | 7.6% | 3.4%(+4.26)#86 | 3.5%(+4.15)#4,292 |
| 87. | Ramsay | 7.6% | 3.4%(+4.20)#87 | 3.5%(+4.09)#4,351 |
| 88. | Paw Paw Lake | 7.5% | 3.4%(+4.16)#88 | 3.5%(+4.06)#4,381 |
| 89. | North Adams | 7.5% | 3.4%(+4.12)#89 | 3.5%(+4.02)#4,413 |
| 90. | Alpha | 7.4% | 3.4%(+4.07)#90 | 3.5%(+3.96)#4,474 |
| 91. | Colon | 7.4% | 3.4%(+4.03)#91 | 3.5%(+3.92)#4,500 |
| 92. | Amasa | 7.4% | 3.4%(+4.03)#92 | 3.5%(+3.92)#4,507 |
| 93. | Grant | 7.4% | 3.4%(+3.99)#93 | 3.5%(+3.88)#4,557 |
| 94. | Filer City | 7.3% | 3.4%(+3.96)#94 | 3.5%(+3.86)#4,592 |
| 95. | Iron River | 7.3% | 3.4%(+3.88)#95 | 3.5%(+3.77)#4,668 |
| 96. | Hart | 7.2% | 3.4%(+3.86)#96 | 3.5%(+3.76)#4,693 |
| 97. | Robin Glen Indiantown | 7.2% | 3.4%(+3.79)#97 | 3.5%(+3.69)#4,754 |
| 98. | Ishpeming | 7.1% | 3.4%(+3.76)#98 | 3.5%(+3.66)#4,770 |
| 99. | Mulliken | 7.1% | 3.4%(+3.76)#99 | 3.5%(+3.66)#4,774 |
| 100. | Calumet | 7.1% | 3.4%(+3.67)#100 | 3.5%(+3.57)#4,864 |
Common Questions
What are the Top 10 Cities with the Highest Percentage of Population Employed in Cleaning & Maintenance in Michigan?
Top 10 Cities with the Highest Percentage of Population Employed in Cleaning & Maintenance in Michigan are:
#1
35.7%
#2
27.8%
#3
26.0%
#4
24.4%
#5
20.3%
#6
19.0%
#7
16.1%
#8
16.0%
#9
15.3%
#10
15.0%
What city has the Highest Percentage of Population Employed in Cleaning & Maintenance in Michigan?
Eagle River has the Highest Percentage of Population Employed in Cleaning & Maintenance in Michigan with 35.7%.
What is the Percentage of Population Employed in Cleaning & Maintenance in the State of Michigan?
Percentage of Population Employed in Cleaning & Maintenance in Michigan is 3.4%.
What is the Percentage of Population Employed in Cleaning & Maintenance in the United States?
Percentage of Population Employed in Cleaning & Maintenance in the United States is 3.5%.