Cities with the Most Immigrants from Lebanon in Ohio
RELATED REPORTS & OPTIONS
Lebanon
Ohio
Compare Cities
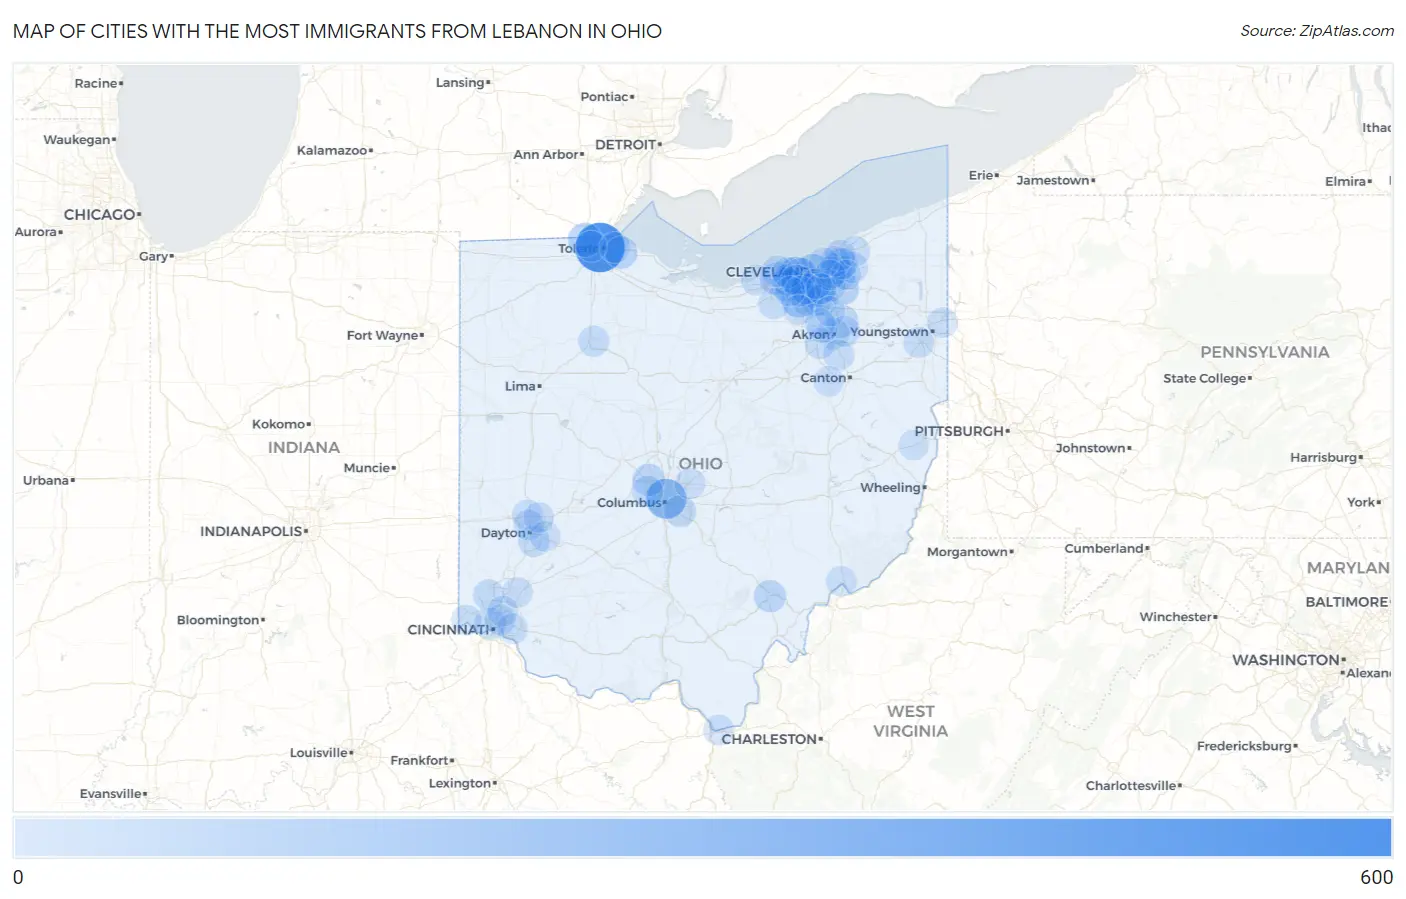
Map of Cities with the Most Immigrants from Lebanon in Ohio
0
600
Cities with the Most Immigrants from Lebanon in Ohio
| City | Lebanon | vs State | vs National | |
| 1. | Toledo | 558 | 3,862(14.45%)#1 | 133,021(0.42%)#16 |
| 2. | Columbus | 281 | 3,862(7.28%)#2 | 133,021(0.21%)#58 |
| 3. | Rocky River | 177 | 3,862(4.58%)#3 | 133,021(0.13%)#105 |
| 4. | Parma | 144 | 3,862(3.73%)#4 | 133,021(0.11%)#131 |
| 5. | Strongsville | 132 | 3,862(3.42%)#5 | 133,021(0.10%)#146 |
| 6. | Cleveland | 126 | 3,862(3.26%)#6 | 133,021(0.09%)#156 |
| 7. | Seven Hills | 114 | 3,862(2.95%)#7 | 133,021(0.09%)#166 |
| 8. | Sylvania | 109 | 3,862(2.82%)#8 | 133,021(0.08%)#177 |
| 9. | North Olmsted | 96 | 3,862(2.49%)#9 | 133,021(0.07%)#208 |
| 10. | Avon | 76 | 3,862(1.97%)#10 | 133,021(0.06%)#278 |
| 11. | Solon | 75 | 3,862(1.94%)#11 | 133,021(0.06%)#286 |
| 12. | Curtice | 67 | 3,862(1.73%)#12 | 133,021(0.05%)#319 |
| 13. | Dublin | 64 | 3,862(1.66%)#13 | 133,021(0.05%)#334 |
| 14. | Athens | 57 | 3,862(1.48%)#14 | 133,021(0.04%)#375 |
| 15. | Lakewood | 51 | 3,862(1.32%)#15 | 133,021(0.04%)#409 |
| 16. | Blacklick Estates | 50 | 3,862(1.29%)#16 | 133,021(0.04%)#417 |
| 17. | Highland Heights | 49 | 3,862(1.27%)#17 | 133,021(0.04%)#431 |
| 18. | Stow | 48 | 3,862(1.24%)#18 | 133,021(0.04%)#438 |
| 19. | North Royalton | 43 | 3,862(1.11%)#19 | 133,021(0.03%)#480 |
| 20. | Westlake | 42 | 3,862(1.09%)#20 | 133,021(0.03%)#487 |
| 21. | Broadview Heights | 41 | 3,862(1.06%)#21 | 133,021(0.03%)#499 |
| 22. | Cincinnati | 36 | 3,862(0.93%)#22 | 133,021(0.03%)#546 |
| 23. | Kettering | 35 | 3,862(0.91%)#23 | 133,021(0.03%)#561 |
| 24. | Hilliard | 34 | 3,862(0.88%)#24 | 133,021(0.03%)#580 |
| 25. | Avon Lake | 33 | 3,862(0.85%)#25 | 133,021(0.02%)#599 |
| 26. | Lyndhurst | 33 | 3,862(0.85%)#26 | 133,021(0.02%)#600 |
| 27. | Fairfield | 32 | 3,862(0.83%)#27 | 133,021(0.02%)#612 |
| 28. | Brecksville | 30 | 3,862(0.78%)#28 | 133,021(0.02%)#654 |
| 29. | Pepper Pike | 30 | 3,862(0.78%)#29 | 133,021(0.02%)#656 |
| 30. | Akron | 29 | 3,862(0.75%)#30 | 133,021(0.02%)#659 |
| 31. | University Heights | 29 | 3,862(0.75%)#31 | 133,021(0.02%)#675 |
| 32. | Maple Heights | 28 | 3,862(0.73%)#32 | 133,021(0.02%)#690 |
| 33. | Findlay | 25 | 3,862(0.65%)#33 | 133,021(0.02%)#735 |
| 34. | Grafton | 23 | 3,862(0.60%)#34 | 133,021(0.02%)#788 |
| 35. | Ottawa Hills | 23 | 3,862(0.60%)#35 | 133,021(0.02%)#789 |
| 36. | Oregon | 21 | 3,862(0.54%)#36 | 133,021(0.02%)#830 |
| 37. | Tallmadge | 20 | 3,862(0.52%)#37 | 133,021(0.02%)#856 |
| 38. | Chesterland | 20 | 3,862(0.52%)#38 | 133,021(0.02%)#863 |
| 39. | Parma Heights | 18 | 3,862(0.47%)#39 | 133,021(0.01%)#913 |
| 40. | Vandalia | 18 | 3,862(0.47%)#40 | 133,021(0.01%)#920 |
| 41. | Mayfield | 18 | 3,862(0.47%)#41 | 133,021(0.01%)#932 |
| 42. | Green | 17 | 3,862(0.44%)#42 | 133,021(0.01%)#941 |
| 43. | Norwood | 17 | 3,862(0.44%)#43 | 133,021(0.01%)#945 |
| 44. | Canfield | 17 | 3,862(0.44%)#44 | 133,021(0.01%)#954 |
| 45. | Dry Run | 17 | 3,862(0.44%)#45 | 133,021(0.01%)#956 |
| 46. | Lorain | 16 | 3,862(0.41%)#46 | 133,021(0.01%)#970 |
| 47. | Bay Village | 15 | 3,862(0.39%)#47 | 133,021(0.01%)#1,012 |
| 48. | Norton | 15 | 3,862(0.39%)#48 | 133,021(0.01%)#1,017 |
| 49. | Reading | 15 | 3,862(0.39%)#49 | 133,021(0.01%)#1,018 |
| 50. | Burlington | 15 | 3,862(0.39%)#50 | 133,021(0.01%)#1,029 |
| 51. | Dayton | 13 | 3,862(0.34%)#51 | 133,021(0.01%)#1,064 |
| 52. | Mason | 13 | 3,862(0.34%)#52 | 133,021(0.01%)#1,075 |
| 53. | Fairview Park | 13 | 3,862(0.34%)#53 | 133,021(0.01%)#1,078 |
| 54. | Middleburg Heights | 12 | 3,862(0.31%)#54 | 133,021(0.01%)#1,109 |
| 55. | Wickliffe | 12 | 3,862(0.31%)#55 | 133,021(0.01%)#1,111 |
| 56. | Hubbard | 12 | 3,862(0.31%)#56 | 133,021(0.01%)#1,114 |
| 57. | Richmond Heights | 11 | 3,862(0.28%)#57 | 133,021(0.01%)#1,160 |
| 58. | Fairlawn | 11 | 3,862(0.28%)#58 | 133,021(0.01%)#1,169 |
| 59. | Montrose Ghent | 11 | 3,862(0.28%)#59 | 133,021(0.01%)#1,173 |
| 60. | Brooklyn Heights | 11 | 3,862(0.28%)#60 | 133,021(0.01%)#1,178 |
| 61. | Beavercreek | 10 | 3,862(0.26%)#61 | 133,021(0.01%)#1,193 |
| 62. | Massillon | 10 | 3,862(0.26%)#62 | 133,021(0.01%)#1,203 |
| 63. | Shaker Heights | 10 | 3,862(0.26%)#63 | 133,021(0.01%)#1,208 |
| 64. | New Albany | 10 | 3,862(0.26%)#64 | 133,021(0.01%)#1,225 |
| 65. | Independence | 10 | 3,862(0.26%)#65 | 133,021(0.01%)#1,230 |
| 66. | Brunswick | 9 | 3,862(0.23%)#66 | 133,021(0.01%)#1,260 |
| 67. | Huber Heights | 7 | 3,862(0.18%)#67 | 133,021(0.01%)#1,352 |
| 68. | Kirtland Hills | 6 | 3,862(0.16%)#68 | 133,021(0.00%)#1,422 |
| 69. | Marietta | 5 | 3,862(0.13%)#69 | 133,021(0.00%)#1,432 |
| 70. | Cleves | 5 | 3,862(0.13%)#70 | 133,021(0.00%)#1,438 |
| 71. | Hunting Valley | 4 | 3,862(0.10%)#71 | 133,021(0.00%)#1,482 |
| 72. | Bloomingdale | 4 | 3,862(0.10%)#72 | 133,021(0.00%)#1,486 |
| 73. | Olmsted Falls | 3 | 3,862(0.08%)#73 | 133,021(0.00%)#1,498 |
| 74. | Bratenahl | 3 | 3,862(0.08%)#74 | 133,021(0.00%)#1,506 |
| 75. | Peninsula | 2 | 3,862(0.05%)#75 | 133,021(0.00%)#1,529 |
Common Questions
What are the Top 10 Cities with the Most Immigrants from Lebanon in Ohio?
Top 10 Cities with the Most Immigrants from Lebanon in Ohio are:
#1
558
#2
281
#3
177
#4
144
#5
132
#6
126
#7
114
#8
109
#9
96
#10
76
What city has the Most Immigrants from Lebanon in Ohio?
Toledo has the Most Immigrants from Lebanon in Ohio with 558.
What is the Total Immigrants from Lebanon in the State of Ohio?
Total Immigrants from Lebanon in Ohio is 3,862.
What is the Total Immigrants from Lebanon in the United States?
Total Immigrants from Lebanon in the United States is 133,021.