Cities with the Most Immigrants from Lebanon in Michigan
RELATED REPORTS & OPTIONS
Lebanon
Michigan
Compare Cities
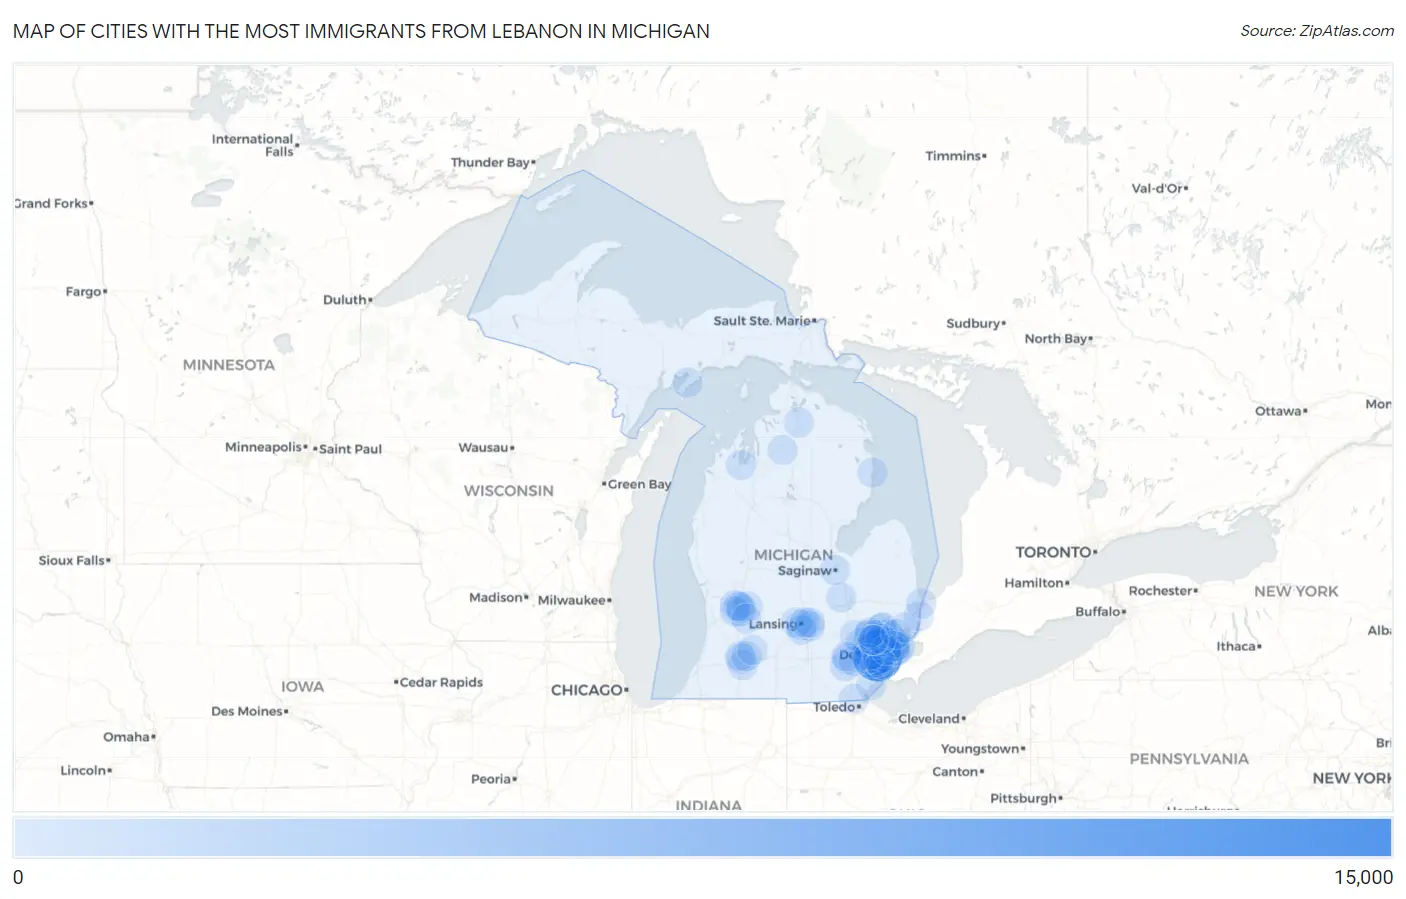
Map of Cities with the Most Immigrants from Lebanon in Michigan
0
15,000
Cities with the Most Immigrants from Lebanon in Michigan
| City | Lebanon | vs State | vs National | |
| 1. | Dearborn | 10,420 | 25,634(40.65%)#1 | 133,021(7.83%)#1 |
| 2. | Dearborn Heights | 6,443 | 25,634(25.13%)#2 | 133,021(4.84%)#2 |
| 3. | Farmington Hills | 809 | 25,634(3.16%)#3 | 133,021(0.61%)#9 |
| 4. | Sterling Heights | 744 | 25,634(2.90%)#4 | 133,021(0.56%)#10 |
| 5. | Taylor | 605 | 25,634(2.36%)#5 | 133,021(0.45%)#14 |
| 6. | Livonia | 521 | 25,634(2.03%)#6 | 133,021(0.39%)#18 |
| 7. | Detroit | 408 | 25,634(1.59%)#7 | 133,021(0.31%)#29 |
| 8. | Troy | 363 | 25,634(1.42%)#8 | 133,021(0.27%)#36 |
| 9. | Warren | 271 | 25,634(1.06%)#9 | 133,021(0.20%)#62 |
| 10. | Westland | 233 | 25,634(0.91%)#10 | 133,021(0.18%)#76 |
| 11. | Harper Woods | 177 | 25,634(0.69%)#11 | 133,021(0.13%)#106 |
| 12. | Ann Arbor | 173 | 25,634(0.67%)#12 | 133,021(0.13%)#109 |
| 13. | Inkster | 138 | 25,634(0.54%)#13 | 133,021(0.10%)#138 |
| 14. | Lansing | 137 | 25,634(0.53%)#14 | 133,021(0.10%)#139 |
| 15. | Rochester Hills | 131 | 25,634(0.51%)#15 | 133,021(0.10%)#148 |
| 16. | Walker | 124 | 25,634(0.48%)#16 | 133,021(0.09%)#159 |
| 17. | Lincoln Park | 111 | 25,634(0.43%)#17 | 133,021(0.08%)#172 |
| 18. | Melvindale | 105 | 25,634(0.41%)#18 | 133,021(0.08%)#184 |
| 19. | Novi | 98 | 25,634(0.38%)#19 | 133,021(0.07%)#204 |
| 20. | Grosse Pointe Farms | 95 | 25,634(0.37%)#20 | 133,021(0.07%)#215 |
| 21. | Southfield | 78 | 25,634(0.30%)#21 | 133,021(0.06%)#267 |
| 22. | Kalamazoo | 72 | 25,634(0.28%)#22 | 133,021(0.05%)#297 |
| 23. | St Clair Shores | 70 | 25,634(0.27%)#23 | 133,021(0.05%)#304 |
| 24. | Rochester | 67 | 25,634(0.26%)#24 | 133,021(0.05%)#318 |
| 25. | Madison Heights | 60 | 25,634(0.23%)#25 | 133,021(0.05%)#361 |
| 26. | Waverly | 60 | 25,634(0.23%)#26 | 133,021(0.05%)#362 |
| 27. | Riverview | 49 | 25,634(0.19%)#27 | 133,021(0.04%)#430 |
| 28. | Kentwood | 44 | 25,634(0.17%)#28 | 133,021(0.03%)#468 |
| 29. | Portage | 43 | 25,634(0.17%)#29 | 133,021(0.03%)#476 |
| 30. | Oak Park | 41 | 25,634(0.16%)#30 | 133,021(0.03%)#498 |
| 31. | Holt | 37 | 25,634(0.14%)#31 | 133,021(0.03%)#542 |
| 32. | Garden City | 35 | 25,634(0.14%)#32 | 133,021(0.03%)#565 |
| 33. | Village Of Grosse Pointe Shores | 33 | 25,634(0.13%)#33 | 133,021(0.02%)#604 |
| 34. | Okemos | 32 | 25,634(0.12%)#34 | 133,021(0.02%)#616 |
| 35. | Birmingham | 32 | 25,634(0.12%)#35 | 133,021(0.02%)#618 |
| 36. | Forest Hills | 29 | 25,634(0.11%)#36 | 133,021(0.02%)#667 |
| 37. | Milford | 26 | 25,634(0.10%)#37 | 133,021(0.02%)#722 |
| 38. | Allen Park | 24 | 25,634(0.09%)#38 | 133,021(0.02%)#760 |
| 39. | Bloomfield Hills | 24 | 25,634(0.09%)#39 | 133,021(0.02%)#769 |
| 40. | Grosse Pointe Woods | 23 | 25,634(0.09%)#40 | 133,021(0.02%)#783 |
| 41. | Royal Oak | 21 | 25,634(0.08%)#41 | 133,021(0.02%)#820 |
| 42. | Orchard Lake Village | 21 | 25,634(0.08%)#42 | 133,021(0.02%)#840 |
| 43. | Woodland Beach | 20 | 25,634(0.08%)#43 | 133,021(0.02%)#864 |
| 44. | Westwood | 19 | 25,634(0.07%)#44 | 133,021(0.01%)#889 |
| 45. | Wayne | 17 | 25,634(0.07%)#45 | 133,021(0.01%)#947 |
| 46. | Comstock Northwest | 17 | 25,634(0.07%)#46 | 133,021(0.01%)#958 |
| 47. | Saline | 15 | 25,634(0.06%)#47 | 133,021(0.01%)#1,022 |
| 48. | East Lansing | 14 | 25,634(0.05%)#48 | 133,021(0.01%)#1,041 |
| 49. | Flushing | 14 | 25,634(0.05%)#49 | 133,021(0.01%)#1,055 |
| 50. | Wyoming | 13 | 25,634(0.05%)#50 | 133,021(0.01%)#1,067 |
| 51. | Lakes Of The North | 13 | 25,634(0.05%)#51 | 133,021(0.01%)#1,092 |
| 52. | Grosse Pointe | 12 | 25,634(0.05%)#52 | 133,021(0.01%)#1,118 |
| 53. | Saginaw | 11 | 25,634(0.04%)#53 | 133,021(0.01%)#1,138 |
| 54. | Hamtramck | 11 | 25,634(0.04%)#54 | 133,021(0.01%)#1,144 |
| 55. | New Baltimore | 11 | 25,634(0.04%)#55 | 133,021(0.01%)#1,157 |
| 56. | Traverse City | 9 | 25,634(0.04%)#56 | 133,021(0.01%)#1,269 |
| 57. | Lambertville | 9 | 25,634(0.04%)#57 | 133,021(0.01%)#1,277 |
| 58. | Ypsilanti | 8 | 25,634(0.03%)#58 | 133,021(0.01%)#1,306 |
| 59. | Haslett | 8 | 25,634(0.03%)#59 | 133,021(0.01%)#1,310 |
| 60. | East Grand Rapids | 8 | 25,634(0.03%)#60 | 133,021(0.01%)#1,317 |
| 61. | Wyandotte | 7 | 25,634(0.03%)#61 | 133,021(0.01%)#1,361 |
| 62. | Clawson | 6 | 25,634(0.02%)#62 | 133,021(0.00%)#1,404 |
| 63. | St Clair | 6 | 25,634(0.02%)#63 | 133,021(0.00%)#1,410 |
| 64. | Wolverine | 6 | 25,634(0.02%)#64 | 133,021(0.00%)#1,424 |
| 65. | Grand Rapids | 5 | 25,634(0.02%)#65 | 133,021(0.00%)#1,425 |
| 66. | Franklin | 5 | 25,634(0.02%)#66 | 133,021(0.00%)#1,439 |
| 67. | Caledonia | 5 | 25,634(0.02%)#67 | 133,021(0.00%)#1,442 |
| 68. | Sylvan Lake | 4 | 25,634(0.02%)#68 | 133,021(0.00%)#1,476 |
| 69. | Mount Clemens | 3 | 25,634(0.01%)#69 | 133,021(0.00%)#1,495 |
| 70. | Bingham Farms | 3 | 25,634(0.01%)#70 | 133,021(0.00%)#1,504 |
| 71. | South Gull Lake | 2 | 25,634(0.01%)#71 | 133,021(0.00%)#1,525 |
| 72. | Port Huron | 1 | 25,634(0.00%)#72 | 133,021(0.00%)#1,536 |
| 73. | Harrisville | 1 | 25,634(0.00%)#73 | 133,021(0.00%)#1,540 |
| 74. | Barton Hills | 1 | 25,634(0.00%)#74 | 133,021(0.00%)#1,542 |
| 75. | Garden | 1 | 25,634(0.00%)#75 | 133,021(0.00%)#1,544 |
Common Questions
What are the Top 10 Cities with the Most Immigrants from Lebanon in Michigan?
Top 10 Cities with the Most Immigrants from Lebanon in Michigan are:
#1
10,420
#2
6,443
#3
809
#4
744
#5
605
#6
521
#7
408
#8
363
#9
271
#10
233
What city has the Most Immigrants from Lebanon in Michigan?
Dearborn has the Most Immigrants from Lebanon in Michigan with 10,420.
What is the Total Immigrants from Lebanon in the State of Michigan?
Total Immigrants from Lebanon in Michigan is 25,634.
What is the Total Immigrants from Lebanon in the United States?
Total Immigrants from Lebanon in the United States is 133,021.