Cities with the Most Immigrants from Lebanon in Maryland
RELATED REPORTS & OPTIONS
Lebanon
Maryland
Compare Cities
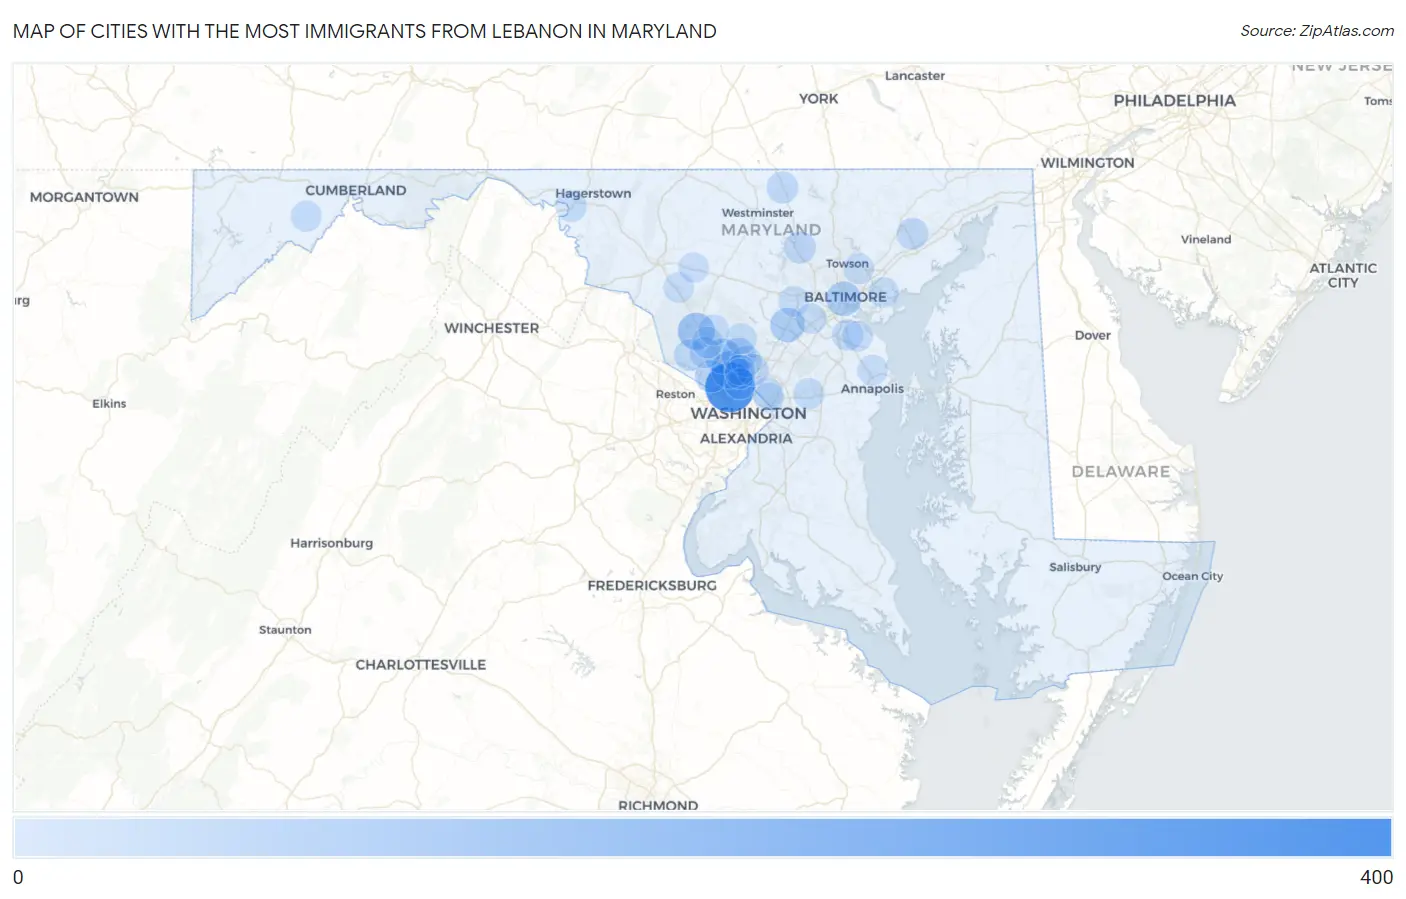
Map of Cities with the Most Immigrants from Lebanon in Maryland
0
400
Cities with the Most Immigrants from Lebanon in Maryland
| City | Lebanon | vs State | vs National | |
| 1. | Bethesda | 307 | 1,454(21.11%)#1 | 133,021(0.23%)#46 |
| 2. | North Bethesda | 111 | 1,454(7.63%)#2 | 133,021(0.08%)#171 |
| 3. | Germantown | 102 | 1,454(7.02%)#3 | 133,021(0.08%)#189 |
| 4. | Rockville | 79 | 1,454(5.43%)#4 | 133,021(0.06%)#261 |
| 5. | Baltimore | 69 | 1,454(4.75%)#5 | 133,021(0.05%)#306 |
| 6. | Columbia | 66 | 1,454(4.54%)#6 | 133,021(0.05%)#320 |
| 7. | Aspen Hill | 60 | 1,454(4.13%)#7 | 133,021(0.05%)#359 |
| 8. | Potomac | 34 | 1,454(2.34%)#8 | 133,021(0.03%)#579 |
| 9. | Kemp Mill | 30 | 1,454(2.06%)#9 | 133,021(0.02%)#652 |
| 10. | Reisterstown | 29 | 1,454(1.99%)#10 | 133,021(0.02%)#668 |
| 11. | Bel Air South | 25 | 1,454(1.72%)#11 | 133,021(0.02%)#734 |
| 12. | Darnestown | 25 | 1,454(1.72%)#12 | 133,021(0.02%)#749 |
| 13. | Manchester | 25 | 1,454(1.72%)#13 | 133,021(0.02%)#750 |
| 14. | North Potomac | 20 | 1,454(1.38%)#14 | 133,021(0.02%)#854 |
| 15. | Glen Burnie | 18 | 1,454(1.24%)#15 | 133,021(0.01%)#901 |
| 16. | Gaithersburg | 18 | 1,454(1.24%)#16 | 133,021(0.01%)#902 |
| 17. | Fairwood | 17 | 1,454(1.17%)#17 | 133,021(0.01%)#955 |
| 18. | Glenmont | 16 | 1,454(1.10%)#18 | 133,021(0.01%)#987 |
| 19. | Hyattsville | 15 | 1,454(1.03%)#19 | 133,021(0.01%)#1,009 |
| 20. | Olney | 14 | 1,454(0.96%)#20 | 133,021(0.01%)#1,045 |
| 21. | Chevy Chase | 14 | 1,454(0.96%)#21 | 133,021(0.01%)#1,054 |
| 22. | Williamsport | 14 | 1,454(0.96%)#22 | 133,021(0.01%)#1,063 |
| 23. | Honeygo | 13 | 1,454(0.89%)#23 | 133,021(0.01%)#1,083 |
| 24. | Lonaconing | 13 | 1,454(0.89%)#24 | 133,021(0.01%)#1,091 |
| 25. | Ellicott City | 12 | 1,454(0.83%)#25 | 133,021(0.01%)#1,095 |
| 26. | Essex | 10 | 1,454(0.69%)#26 | 133,021(0.01%)#1,197 |
| 27. | Montgomery Village | 10 | 1,454(0.69%)#27 | 133,021(0.01%)#1,201 |
| 28. | Parkville | 10 | 1,454(0.69%)#28 | 133,021(0.01%)#1,206 |
| 29. | Arnold | 10 | 1,454(0.69%)#29 | 133,021(0.01%)#1,211 |
| 30. | Urbana | 10 | 1,454(0.69%)#30 | 133,021(0.01%)#1,221 |
| 31. | Ilchester | 8 | 1,454(0.55%)#31 | 133,021(0.01%)#1,302 |
| 32. | North Kensington | 7 | 1,454(0.48%)#32 | 133,021(0.01%)#1,372 |
| 33. | Pasadena | 6 | 1,454(0.41%)#33 | 133,021(0.00%)#1,395 |
| 34. | Kensington | 4 | 1,454(0.28%)#34 | 133,021(0.00%)#1,472 |
| 35. | New Market | 3 | 1,454(0.21%)#35 | 133,021(0.00%)#1,505 |
| 36. | North Brentwood | 2 | 1,454(0.14%)#36 | 133,021(0.00%)#1,528 |
Common Questions
What are the Top 10 Cities with the Most Immigrants from Lebanon in Maryland?
Top 10 Cities with the Most Immigrants from Lebanon in Maryland are:
#1
307
#2
111
#3
102
#4
79
#5
69
#6
66
#7
60
#8
34
#9
30
#10
29
What city has the Most Immigrants from Lebanon in Maryland?
Bethesda has the Most Immigrants from Lebanon in Maryland with 307.
What is the Total Immigrants from Lebanon in the State of Maryland?
Total Immigrants from Lebanon in Maryland is 1,454.
What is the Total Immigrants from Lebanon in the United States?
Total Immigrants from Lebanon in the United States is 133,021.