Cities with the Highest Percentage of Ukrainian Population in Connecticut
RELATED REPORTS & OPTIONS
Ukrainian
Connecticut
Compare Cities
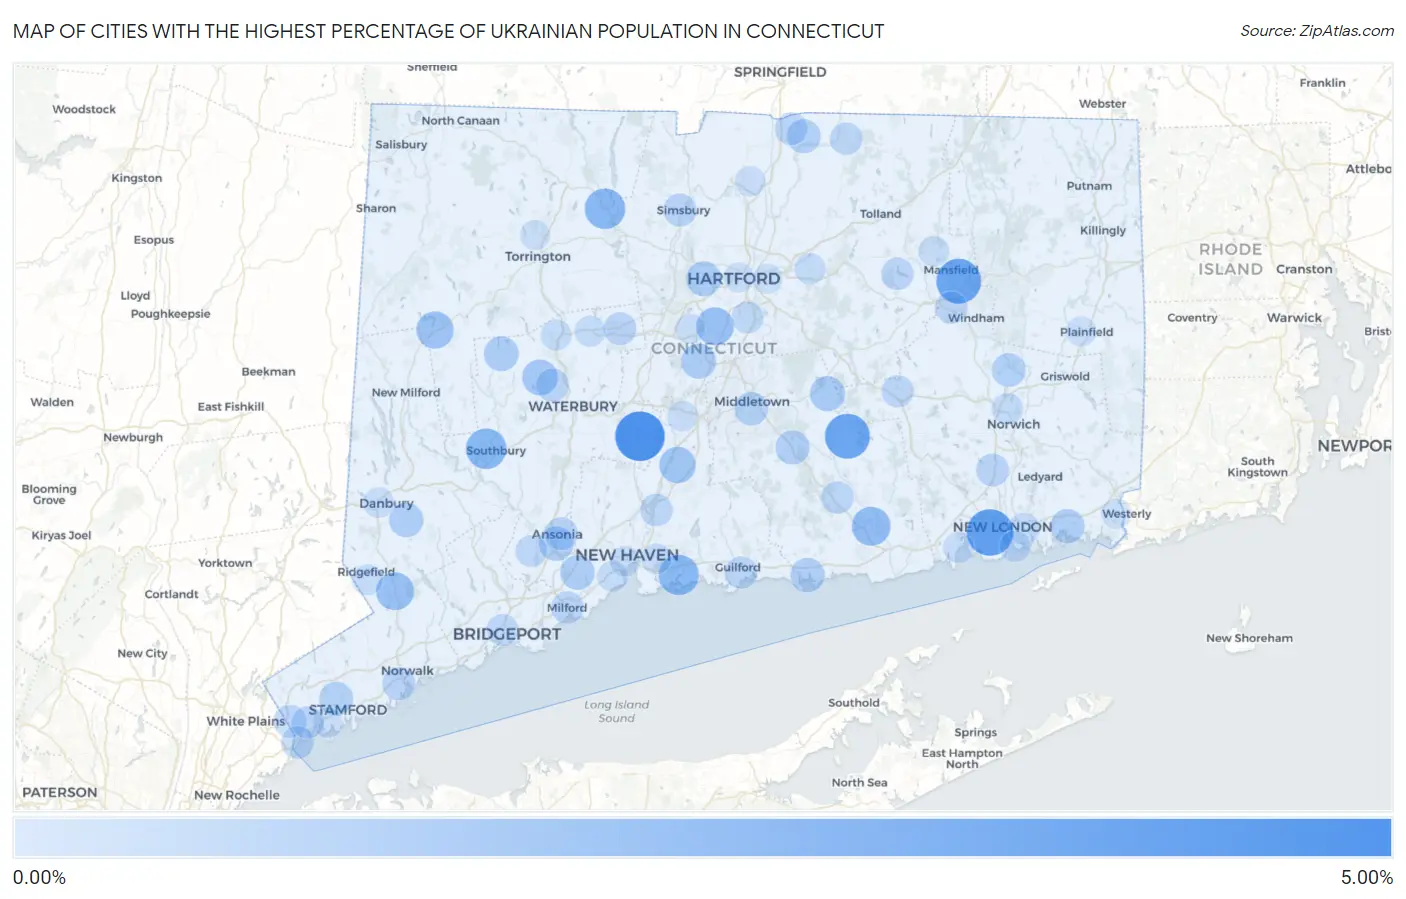
Map of Cities with the Highest Percentage of Ukrainian Population in Connecticut
0.00%
5.00%
Cities with the Highest Percentage of Ukrainian Population in Connecticut
| City | Ukrainian | vs State | vs National | |
| 1. | Lake Chaffee | 4.32% | 0.59%(+3.73)#1 | 0.31%(+4.00)#213 |
| 2. | Cheshire Village | 4.30% | 0.59%(+3.72)#2 | 0.31%(+3.99)#217 |
| 3. | Waterford | 3.66% | 0.59%(+3.08)#3 | 0.31%(+3.35)#277 |
| 4. | Moodus | 3.30% | 0.59%(+2.71)#4 | 0.31%(+2.99)#329 |
| 5. | Mansfield Center | 3.28% | 0.59%(+2.69)#5 | 0.31%(+2.96)#340 |
| 6. | Indian Field | 2.88% | 0.59%(+2.30)#6 | 0.31%(+2.57)#421 |
| 7. | Lakes West | 2.87% | 0.59%(+2.29)#7 | 0.31%(+2.56)#423 |
| 8. | New Hartford Center | 2.35% | 0.59%(+1.76)#8 | 0.31%(+2.03)#581 |
| 9. | Heritage Village | 2.34% | 0.59%(+1.75)#9 | 0.31%(+2.02)#583 |
| 10. | Branford Center | 2.29% | 0.59%(+1.70)#10 | 0.31%(+1.97)#600 |
| 11. | Essex Village | 1.98% | 0.59%(+1.40)#11 | 0.31%(+1.67)#725 |
| 12. | Darien Downtown | 1.87% | 0.59%(+1.28)#12 | 0.31%(+1.55)#801 |
| 13. | Georgetown | 1.81% | 0.59%(+1.23)#13 | 0.31%(+1.50)#837 |
| 14. | Taylor Corners | 1.77% | 0.59%(+1.18)#14 | 0.31%(+1.45)#864 |
| 15. | Newington | 1.75% | 0.59%(+1.17)#15 | 0.31%(+1.44)#873 |
| 16. | New Preston | 1.66% | 0.59%(+1.07)#16 | 0.31%(+1.34)#948 |
| 17. | Wallingford Center | 1.50% | 0.59%(+0.919)#17 | 0.31%(+1.19)#1,084 |
| 18. | Route 7 Gateway | 1.39% | 0.59%(+0.801)#18 | 0.31%(+1.07)#1,198 |
| 19. | Staples | 1.38% | 0.59%(+0.789)#19 | 0.31%(+1.06)#1,206 |
| 20. | Watertown | 1.35% | 0.59%(+0.768)#20 | 0.31%(+1.04)#1,231 |
| 21. | Noroton Heights | 1.30% | 0.59%(+0.711)#21 | 0.31%(+0.982)#1,292 |
| 22. | Woodmont Borough | 1.30% | 0.59%(+0.711)#22 | 0.31%(+0.982)#1,293 |
| 23. | Saugatuck | 1.23% | 0.59%(+0.647)#23 | 0.31%(+0.919)#1,385 |
| 24. | East Hampton | 1.22% | 0.59%(+0.636)#24 | 0.31%(+0.908)#1,403 |
| 25. | Kensington | 1.18% | 0.59%(+0.593)#25 | 0.31%(+0.865)#1,456 |
| 26. | West Hartford | 1.17% | 0.59%(+0.587)#26 | 0.31%(+0.858)#1,466 |
| 27. | Bethlehem Village | 1.14% | 0.59%(+0.555)#27 | 0.31%(+0.826)#1,518 |
| 28. | Northford | 1.13% | 0.59%(+0.545)#28 | 0.31%(+0.816)#1,532 |
| 29. | Derby | 1.10% | 0.59%(+0.513)#29 | 0.31%(+0.784)#1,582 |
| 30. | Orange | 1.10% | 0.59%(+0.510)#30 | 0.31%(+0.781)#1,587 |
| 31. | Bethel | 1.06% | 0.59%(+0.478)#31 | 0.31%(+0.750)#1,651 |
| 32. | Clinton | 1.06% | 0.59%(+0.474)#32 | 0.31%(+0.745)#1,666 |
| 33. | Mystic | 1.04% | 0.59%(+0.455)#33 | 0.31%(+0.726)#1,697 |
| 34. | Sandy Hook | 1.01% | 0.59%(+0.424)#34 | 0.31%(+0.695)#1,760 |
| 35. | Higganum | 1.00% | 0.59%(+0.418)#35 | 0.31%(+0.689)#1,769 |
| 36. | Stamford | 0.98% | 0.59%(+0.395)#36 | 0.31%(+0.666)#1,803 |
| 37. | Hazardville | 0.96% | 0.59%(+0.377)#37 | 0.31%(+0.649)#1,835 |
| 38. | Baltic | 0.96% | 0.59%(+0.370)#38 | 0.31%(+0.642)#1,857 |
| 39. | Middletown | 0.91% | 0.59%(+0.325)#39 | 0.31%(+0.597)#1,965 |
| 40. | Weston | 0.88% | 0.59%(+0.292)#40 | 0.31%(+0.563)#2,048 |
| 41. | Oakville | 0.79% | 0.59%(+0.202)#41 | 0.31%(+0.473)#2,309 |
| 42. | Ansonia | 0.79% | 0.59%(+0.200)#42 | 0.31%(+0.471)#2,315 |
| 43. | Simsbury Center | 0.79% | 0.59%(+0.199)#43 | 0.31%(+0.471)#2,318 |
| 44. | Norwalk | 0.78% | 0.59%(+0.193)#44 | 0.31%(+0.465)#2,337 |
| 45. | Oxoboxo River | 0.74% | 0.59%(+0.155)#45 | 0.31%(+0.426)#2,442 |
| 46. | Bristol | 0.74% | 0.59%(+0.152)#46 | 0.31%(+0.424)#2,449 |
| 47. | Stratford Downtown | 0.72% | 0.59%(+0.132)#47 | 0.31%(+0.403)#2,517 |
| 48. | Sherwood Manor | 0.72% | 0.59%(+0.129)#48 | 0.31%(+0.400)#2,526 |
| 49. | Glenville | 0.71% | 0.59%(+0.121)#49 | 0.31%(+0.392)#2,562 |
| 50. | Naugatuck Borough | 0.70% | 0.59%(+0.118)#50 | 0.31%(+0.390)#2,574 |
| 51. | Byram | 0.70% | 0.59%(+0.114)#51 | 0.31%(+0.385)#2,589 |
| 52. | North Haven | 0.70% | 0.59%(+0.113)#52 | 0.31%(+0.384)#2,593 |
| 53. | Chester Center | 0.69% | 0.59%(+0.108)#53 | 0.31%(+0.379)#2,613 |
| 54. | Coventry Lake | 0.67% | 0.59%(+0.086)#54 | 0.31%(+0.358)#2,688 |
| 55. | Somers | 0.67% | 0.59%(+0.086)#55 | 0.31%(+0.357)#2,690 |
| 56. | Milford City Balance | 0.66% | 0.59%(+0.069)#56 | 0.31%(+0.340)#2,766 |
| 57. | Sacred Heart University | 0.63% | 0.59%(+0.044)#57 | 0.31%(+0.315)#2,881 |
| 58. | Guilford Center | 0.63% | 0.59%(+0.043)#58 | 0.31%(+0.315)#2,884 |
| 59. | Greenwich | 0.63% | 0.59%(+0.040)#59 | 0.31%(+0.311)#2,901 |
| 60. | Willimantic | 0.62% | 0.59%(+0.039)#60 | 0.31%(+0.310)#2,906 |
| 61. | Colchester | 0.60% | 0.59%(+0.009)#61 | 0.31%(+0.281)#3,033 |
| 62. | Old Hill | 0.60% | 0.59%(+0.009)#62 | 0.31%(+0.280)#3,034 |
| 63. | East | 0.57% | 0.59%(-0.013)#63 | 0.31%(+0.258)#3,150 |
| 64. | Trumbull Center | 0.56% | 0.59%(-0.025)#64 | 0.31%(+0.246)#3,201 |
| 65. | Wethersfield | 0.56% | 0.59%(-0.027)#65 | 0.31%(+0.244)#3,209 |
| 66. | Tashua | 0.56% | 0.59%(-0.028)#66 | 0.31%(+0.243)#3,216 |
| 67. | Lordship | 0.55% | 0.59%(-0.041)#67 | 0.31%(+0.230)#3,285 |
| 68. | Bridgeport | 0.54% | 0.59%(-0.048)#68 | 0.31%(+0.224)#3,313 |
| 69. | Shelton | 0.53% | 0.59%(-0.057)#69 | 0.31%(+0.214)#3,362 |
| 70. | Long Hill | 0.51% | 0.59%(-0.078)#70 | 0.31%(+0.194)#3,484 |
| 71. | Greens Farms | 0.49% | 0.59%(-0.095)#71 | 0.31%(+0.177)#3,592 |
| 72. | Daniels Farm | 0.46% | 0.59%(-0.125)#72 | 0.31%(+0.147)#3,757 |
| 73. | Norwich | 0.44% | 0.59%(-0.144)#73 | 0.31%(+0.127)#3,881 |
| 74. | Mill Plain | 0.43% | 0.59%(-0.152)#74 | 0.31%(+0.120)#3,913 |
| 75. | Stonington Borough | 0.42% | 0.59%(-0.162)#75 | 0.31%(+0.110)#3,972 |
| 76. | Manchester | 0.40% | 0.59%(-0.184)#76 | 0.31%(+0.088)#4,101 |
| 77. | Terryville | 0.40% | 0.59%(-0.186)#77 | 0.31%(+0.085)#4,115 |
| 78. | Groton Long Point Borough | 0.39% | 0.59%(-0.200)#78 | 0.31%(+0.072)#4,198 |
| 79. | Groton | 0.38% | 0.59%(-0.202)#79 | 0.31%(+0.069)#4,218 |
| 80. | Thomaston | 0.38% | 0.59%(-0.203)#80 | 0.31%(+0.068)#4,230 |
| 81. | Niantic | 0.37% | 0.59%(-0.215)#81 | 0.31%(+0.057)#4,321 |
| 82. | West Haven | 0.35% | 0.59%(-0.234)#82 | 0.31%(+0.037)#4,452 |
| 83. | Storrs | 0.34% | 0.59%(-0.246)#83 | 0.31%(+0.026)#4,537 |
| 84. | Compo | 0.33% | 0.59%(-0.256)#84 | 0.31%(+0.015)#4,626 |
| 85. | Ridgefield | 0.31% | 0.59%(-0.273)#85 | 0.31%(-0.001)#4,763 |
| 86. | Newtown Borough | 0.31% | 0.59%(-0.280)#86 | 0.31%(-0.009)#4,845 |
| 87. | Noroton | 0.30% | 0.59%(-0.283)#87 | 0.31%(-0.012)#4,871 |
| 88. | Danbury | 0.30% | 0.59%(-0.288)#88 | 0.31%(-0.017)#4,906 |
| 89. | Meriden | 0.30% | 0.59%(-0.289)#89 | 0.31%(-0.018)#4,915 |
| 90. | East Haven | 0.29% | 0.59%(-0.296)#90 | 0.31%(-0.024)#4,978 |
| 91. | New Haven | 0.26% | 0.59%(-0.323)#91 | 0.31%(-0.051)#5,218 |
| 92. | Windsor Locks | 0.26% | 0.59%(-0.324)#92 | 0.31%(-0.052)#5,233 |
| 93. | New Britain | 0.23% | 0.59%(-0.361)#93 | 0.31%(-0.090)#5,606 |
| 94. | Plainfield Village | 0.22% | 0.59%(-0.363)#94 | 0.31%(-0.091)#5,623 |
| 95. | Hartford | 0.22% | 0.59%(-0.368)#95 | 0.31%(-0.097)#5,704 |
| 96. | Pawcatuck | 0.22% | 0.59%(-0.371)#96 | 0.31%(-0.100)#5,736 |
| 97. | Torrington | 0.21% | 0.59%(-0.375)#97 | 0.31%(-0.104)#5,788 |
| 98. | Riverside | 0.21% | 0.59%(-0.377)#98 | 0.31%(-0.106)#5,816 |
| 99. | Coleytown | 0.21% | 0.59%(-0.380)#99 | 0.31%(-0.109)#5,842 |
| 100. | East Hartford | 0.21% | 0.59%(-0.380)#100 | 0.31%(-0.109)#5,845 |
Common Questions
What are the Top 10 Cities with the Highest Percentage of Ukrainian Population in Connecticut?
Top 10 Cities with the Highest Percentage of Ukrainian Population in Connecticut are:
#1
4.30%
#2
3.66%
#3
3.30%
#4
3.28%
#5
2.35%
#6
2.34%
#7
2.29%
#8
1.98%
#9
1.81%
#10
1.75%
What city has the Highest Percentage of Ukrainian Population in Connecticut?
Cheshire Village has the Highest Percentage of Ukrainian Population in Connecticut with 4.30%.
What is the Percentage of Ukrainian Population in the State of Connecticut?
Percentage of Ukrainian Population in Connecticut is 0.59%.
What is the Percentage of Ukrainian Population in the United States?
Percentage of Ukrainian Population in the United States is 0.31%.