Cities with the Highest Percentage of Immigrants from Chile in Pennsylvania
RELATED REPORTS & OPTIONS
Chile
Pennsylvania
Compare Cities
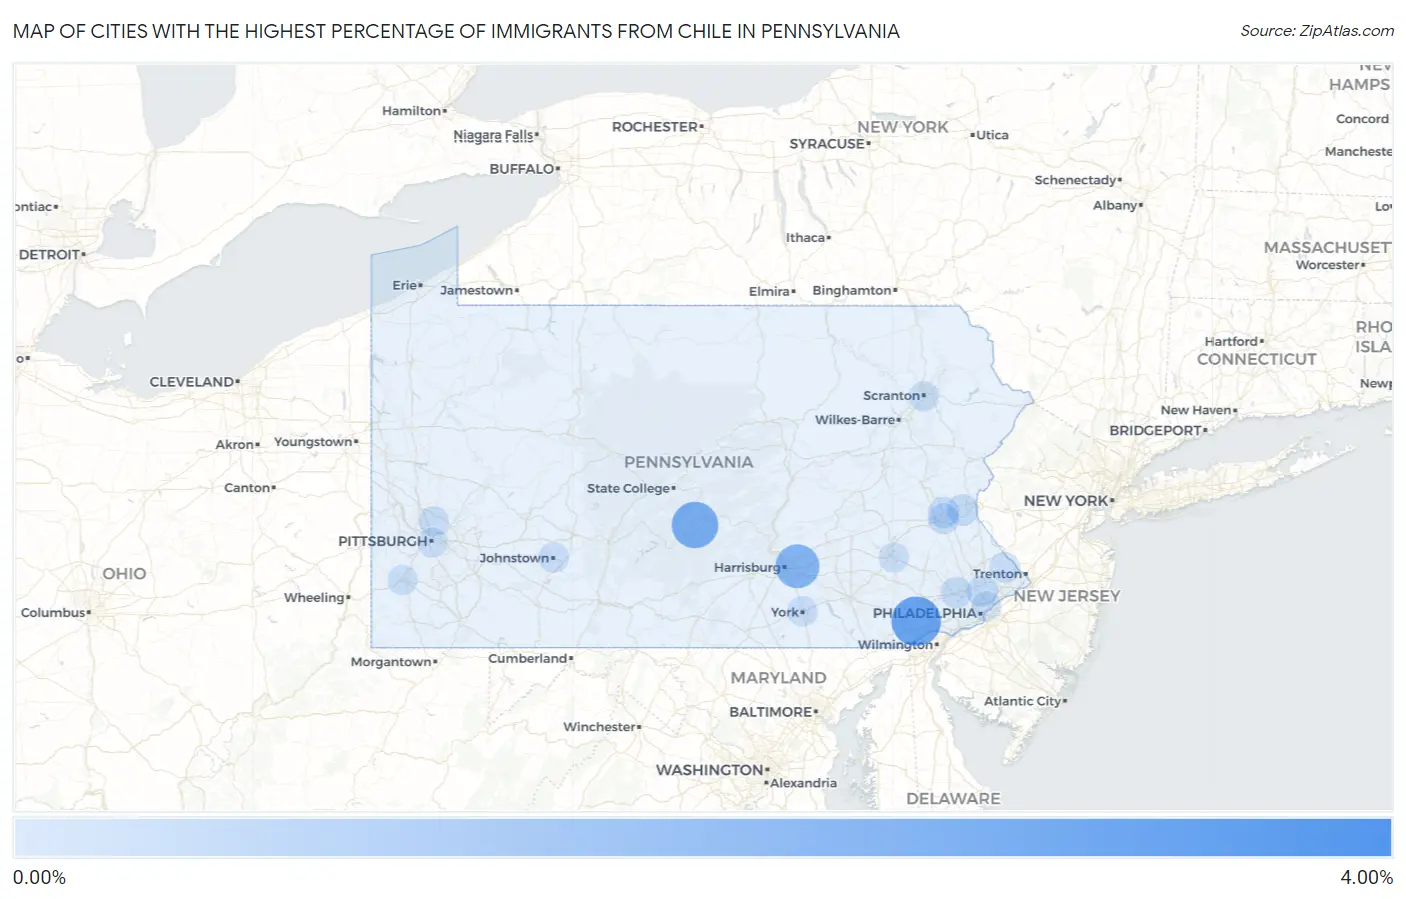
Map of Cities with the Highest Percentage of Immigrants from Chile in Pennsylvania
0.00%
4.00%
Cities with the Highest Percentage of Immigrants from Chile in Pennsylvania
| City | Chile | vs State | vs National | |
| 1. | Baden Borough | 3.21% | 0.019%(+3.19)#-1 | 0.032%(+3.18)#0 |
| 2. | Unionville | 2.49% | 0.019%(+2.47)#0 | 0.032%(+2.46)#1 |
| 3. | Mifflintown Borough | 2.48% | 0.019%(+2.46)#1 | 0.032%(+2.45)#2 |
| 4. | Port Royal Borough | 2.47% | 0.019%(+2.45)#2 | 0.032%(+2.44)#3 |
| 5. | Strodes Mills | 2.10% | 0.019%(+2.08)#3 | 0.032%(+2.06)#4 |
| 6. | Rutherford | 1.75% | 0.019%(+1.73)#4 | 0.032%(+1.72)#5 |
| 7. | Topton Borough | 0.97% | 0.019%(+0.947)#30 | 0.032%(+0.934)#1,474 |
| 8. | Clarion Borough | 0.93% | 0.019%(+0.908)#31 | 0.032%(+0.895)#1,475 |
| 9. | Strasburg Borough | 0.87% | 0.019%(+0.853)#32 | 0.032%(+0.840)#1,476 |
| 10. | Stroudsburg Borough | 0.85% | 0.019%(+0.829)#33 | 0.032%(+0.816)#1,477 |
| 11. | Rosemont | 0.67% | 0.019%(+0.654)#34 | 0.032%(+0.641)#1,478 |
| 12. | Ashley Borough | 0.54% | 0.019%(+0.517)#35 | 0.032%(+0.504)#1,479 |
| 13. | Fountain Hill Borough | 0.50% | 0.019%(+0.479)#36 | 0.032%(+0.466)#1,480 |
| 14. | Manor Borough | 0.34% | 0.019%(+0.319)#37 | 0.032%(+0.306)#1,481 |
| 15. | Glenolden Borough | 0.29% | 0.019%(+0.273)#38 | 0.032%(+0.260)#1,482 |
| 16. | Norristown Borough | 0.25% | 0.019%(+0.236)#94 | 0.032%(+0.223)#3,608 |
| 17. | Roslyn | 0.24% | 0.019%(+0.221)#95 | 0.032%(+0.208)#3,609 |
| 18. | Elkins Park | 0.22% | 0.019%(+0.196)#96 | 0.032%(+0.183)#3,610 |
| 19. | Middletown | 0.18% | 0.019%(+0.160)#97 | 0.032%(+0.147)#3,611 |
| 20. | Fullerton | 0.17% | 0.019%(+0.152)#98 | 0.032%(+0.139)#3,612 |
| 21. | Glenside | 0.17% | 0.019%(+0.149)#99 | 0.032%(+0.136)#3,613 |
| 22. | King Of Prussia | 0.17% | 0.019%(+0.149)#100 | 0.032%(+0.136)#3,614 |
| 23. | Dalton Borough | 0.16% | 0.019%(+0.137)#101 | 0.032%(+0.124)#3,615 |
| 24. | West Chester Borough | 0.15% | 0.019%(+0.133)#102 | 0.032%(+0.120)#3,616 |
| 25. | Pottstown Borough | 0.15% | 0.019%(+0.127)#103 | 0.032%(+0.113)#3,617 |
| 26. | Kennett Square Borough | 0.13% | 0.019%(+0.115)#104 | 0.032%(+0.102)#3,618 |
| 27. | Allentown | 0.12% | 0.019%(+0.098)#105 | 0.032%(+0.085)#3,619 |
| 28. | Villanova | 0.11% | 0.019%(+0.092)#106 | 0.032%(+0.079)#3,620 |
| 29. | Canonsburg Borough | 0.10% | 0.019%(+0.084)#107 | 0.032%(+0.071)#3,621 |
| 30. | State College Borough | 0.083% | 0.019%(+0.064)#108 | 0.032%(+0.051)#3,817 |
| 31. | Newtown Grant | 0.068% | 0.019%(+0.049)#109 | 0.032%(+0.036)#3,818 |
| 32. | Johnstown | 0.065% | 0.019%(+0.046)#110 | 0.032%(+0.033)#3,819 |
| 33. | York | 0.036% | 0.019%(+0.017)#112 | 0.032%(+0.004)#4,387 |
| 34. | Allison Park | 0.031% | 0.019%(+0.012)#113 | 0.032%(-0.001)#4,388 |
| 35. | Washington | 0.030% | 0.019%(+0.011)#114 | 0.032%(-0.002)#4,389 |
| 36. | Scranton | 0.025% | 0.019%(+0.006)#115 | 0.032%(-0.007)#4,390 |
| 37. | Philadelphia | 0.023% | 0.019%(+0.004)#116 | 0.032%(-0.009)#4,391 |
| 38. | Pittsburgh | 0.019% | 0.019%(+0.000)#117 | 0.032%(-0.013)#4,392 |
| 39. | Reading | 0.018% | 0.019%(-0.001)#118 | 0.032%(-0.014)#4,393 |
| 40. | Lansdale Borough | 0.011% | 0.019%(-0.008)#119 | 0.032%(-0.022)#4,394 |
Common Questions
What are the Top 10 Cities with the Highest Percentage of Immigrants from Chile in Pennsylvania?
Top 10 Cities with the Highest Percentage of Immigrants from Chile in Pennsylvania are:
#1
2.49%
#2
2.10%
#3
1.75%
#4
0.18%
#5
0.17%
#6
0.17%
#7
0.17%
#8
0.12%
#9
0.068%
#10
0.065%
What city has the Highest Percentage of Immigrants from Chile in Pennsylvania?
Unionville has the Highest Percentage of Immigrants from Chile in Pennsylvania with 2.49%.
What is the Percentage of Immigrants from Chile in the State of Pennsylvania?
Percentage of Immigrants from Chile in Pennsylvania is 0.019%.
What is the Percentage of Immigrants from Chile in the United States?
Percentage of Immigrants from Chile in the United States is 0.032%.