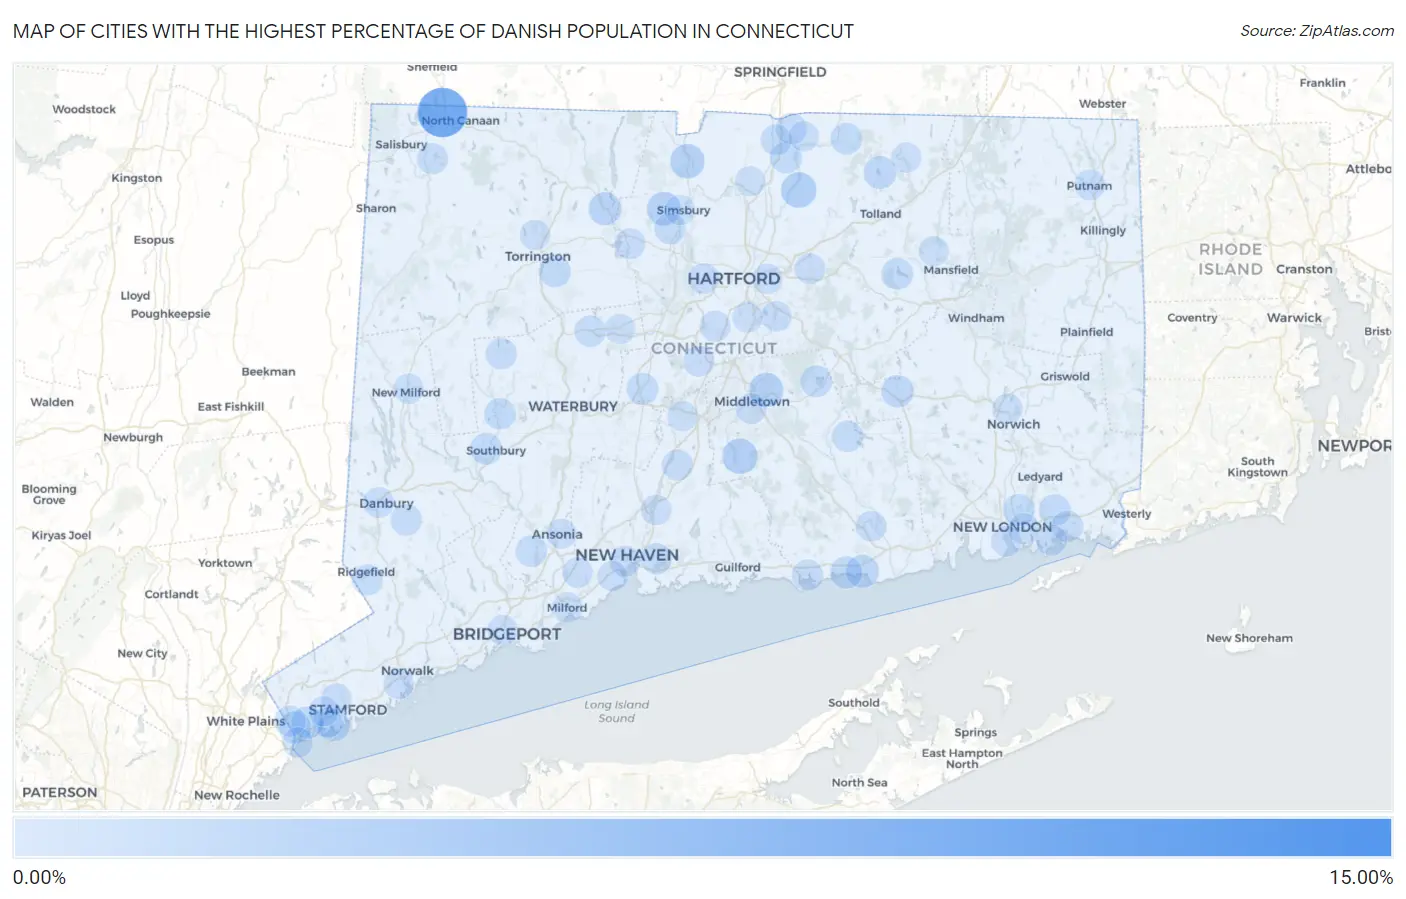
Cities with the Highest Percentage of Danish Population in Connecticut
RELATED REPORTS & OPTIONS
Danish
Connecticut
Compare Cities
Map of Cities with the Highest Percentage of Danish Population in Connecticut
0.00%
15.00%
Cities with the Highest Percentage of Danish Population in Connecticut
| City | Danish | vs State | vs National | |
| 1. | Pleasant Valley | 13.68% | 0.27%(+13.4)#1 | 0.36%(+13.3)#127 |
| 2. | Canaan | 9.46% | 0.27%(+9.19)#2 | 0.36%(+9.10)#213 |
| 3. | Fenwick Borough | 5.00% | 0.27%(+4.73)#3 | 0.36%(+4.64)#564 |
| 4. | Broad Brook | 2.52% | 0.27%(+2.25)#4 | 0.36%(+2.16)#1,370 |
| 5. | Durham | 2.39% | 0.27%(+2.12)#5 | 0.36%(+2.04)#1,456 |
| 6. | Candlewood Shores | 2.27% | 0.27%(+2.00)#6 | 0.36%(+1.92)#1,545 |
| 7. | Salmon Brook | 2.06% | 0.27%(+1.79)#7 | 0.36%(+1.70)#1,714 |
| 8. | Portland | 1.99% | 0.27%(+1.73)#8 | 0.36%(+1.64)#1,778 |
| 9. | West Simsbury | 1.79% | 0.27%(+1.52)#9 | 0.36%(+1.43)#1,989 |
| 10. | Saugatuck | 1.60% | 0.27%(+1.33)#10 | 0.36%(+1.24)#2,215 |
| 11. | Route 7 Gateway | 1.49% | 0.27%(+1.22)#11 | 0.36%(+1.13)#2,408 |
| 12. | New Hartford Center | 1.39% | 0.27%(+1.12)#12 | 0.36%(+1.04)#2,565 |
| 13. | Saybrook Manor | 1.30% | 0.27%(+1.03)#13 | 0.36%(+0.942)#2,779 |
| 14. | Crystal Lake | 1.25% | 0.27%(+0.982)#14 | 0.36%(+0.893)#2,893 |
| 15. | New Canaan | 1.24% | 0.27%(+0.970)#15 | 0.36%(+0.881)#2,920 |
| 16. | Coleytown | 1.09% | 0.27%(+0.823)#16 | 0.36%(+0.734)#3,326 |
| 17. | Old Greenwich | 1.09% | 0.27%(+0.822)#17 | 0.36%(+0.733)#3,331 |
| 18. | Colchester | 1.09% | 0.27%(+0.820)#18 | 0.36%(+0.731)#3,335 |
| 19. | Westbrook Center | 1.04% | 0.27%(+0.767)#19 | 0.36%(+0.679)#3,485 |
| 20. | Pemberwick | 1.00% | 0.27%(+0.728)#20 | 0.36%(+0.639)#3,617 |
| 21. | Greenwich | 0.98% | 0.27%(+0.714)#21 | 0.36%(+0.625)#3,670 |
| 22. | Indian Field | 0.89% | 0.27%(+0.619)#22 | 0.36%(+0.530)#4,002 |
| 23. | Northwest Harwinton | 0.87% | 0.27%(+0.606)#23 | 0.36%(+0.517)#4,057 |
| 24. | Plantsville | 0.82% | 0.27%(+0.547)#24 | 0.36%(+0.458)#4,315 |
| 25. | Southwood Acres | 0.79% | 0.27%(+0.526)#25 | 0.36%(+0.437)#4,402 |
| 26. | Lake Pocotopaug | 0.76% | 0.27%(+0.488)#26 | 0.36%(+0.399)#4,578 |
| 27. | Heritage Village | 0.75% | 0.27%(+0.480)#27 | 0.36%(+0.391)#4,609 |
| 28. | Old Mystic | 0.74% | 0.27%(+0.470)#28 | 0.36%(+0.381)#4,653 |
| 29. | Coventry Lake | 0.72% | 0.27%(+0.449)#29 | 0.36%(+0.360)#4,759 |
| 30. | Somers | 0.72% | 0.27%(+0.449)#30 | 0.36%(+0.360)#4,761 |
| 31. | Conning Towers Nautilus Park | 0.70% | 0.27%(+0.428)#31 | 0.36%(+0.339)#4,884 |
| 32. | Woodbury Center | 0.69% | 0.27%(+0.424)#32 | 0.36%(+0.335)#4,905 |
| 33. | Old Hill | 0.67% | 0.27%(+0.397)#33 | 0.36%(+0.308)#5,035 |
| 34. | Staples | 0.64% | 0.27%(+0.370)#34 | 0.36%(+0.282)#5,182 |
| 35. | Stonington Borough | 0.64% | 0.27%(+0.369)#35 | 0.36%(+0.280)#5,191 |
| 36. | South Wilton | 0.63% | 0.27%(+0.362)#36 | 0.36%(+0.273)#5,223 |
| 37. | Mystic | 0.61% | 0.27%(+0.343)#37 | 0.36%(+0.254)#5,316 |
| 38. | Terryville | 0.60% | 0.27%(+0.332)#38 | 0.36%(+0.243)#5,391 |
| 39. | Moodus | 0.60% | 0.27%(+0.332)#39 | 0.36%(+0.243)#5,392 |
| 40. | Mill Plain | 0.60% | 0.27%(+0.329)#40 | 0.36%(+0.240)#5,407 |
| 41. | Bethel | 0.58% | 0.27%(+0.312)#41 | 0.36%(+0.223)#5,500 |
| 42. | Shelton | 0.57% | 0.27%(+0.304)#42 | 0.36%(+0.215)#5,536 |
| 43. | Newtown Borough | 0.56% | 0.27%(+0.293)#43 | 0.36%(+0.204)#5,592 |
| 44. | Weatogue | 0.52% | 0.27%(+0.256)#44 | 0.36%(+0.167)#5,842 |
| 45. | Wallingford Center | 0.52% | 0.27%(+0.249)#45 | 0.36%(+0.160)#5,886 |
| 46. | East Haven | 0.51% | 0.27%(+0.237)#46 | 0.36%(+0.149)#5,955 |
| 47. | Tokeneke | 0.50% | 0.27%(+0.236)#47 | 0.36%(+0.148)#5,967 |
| 48. | Glenville | 0.48% | 0.27%(+0.214)#48 | 0.36%(+0.125)#6,131 |
| 49. | Clinton | 0.48% | 0.27%(+0.213)#49 | 0.36%(+0.125)#6,137 |
| 50. | Bethlehem Village | 0.48% | 0.27%(+0.207)#50 | 0.36%(+0.118)#6,181 |
| 51. | Sherwood Manor | 0.47% | 0.27%(+0.203)#51 | 0.36%(+0.114)#6,221 |
| 52. | Noank | 0.47% | 0.27%(+0.200)#52 | 0.36%(+0.111)#6,238 |
| 53. | Trumbull Center | 0.43% | 0.27%(+0.157)#53 | 0.36%(+0.068)#6,560 |
| 54. | Falls Village | 0.42% | 0.27%(+0.154)#54 | 0.36%(+0.066)#6,578 |
| 55. | Thompsonville | 0.41% | 0.27%(+0.139)#55 | 0.36%(+0.050)#6,705 |
| 56. | Newington | 0.40% | 0.27%(+0.132)#56 | 0.36%(+0.043)#6,755 |
| 57. | Kensington | 0.40% | 0.27%(+0.128)#57 | 0.36%(+0.039)#6,787 |
| 58. | New Haven | 0.39% | 0.27%(+0.121)#58 | 0.36%(+0.032)#6,869 |
| 59. | Groton Long Point Borough | 0.39% | 0.27%(+0.118)#59 | 0.36%(+0.030)#6,895 |
| 60. | West Hartford | 0.37% | 0.27%(+0.105)#60 | 0.36%(+0.016)#7,021 |
| 61. | Ridgefield | 0.37% | 0.27%(+0.097)#61 | 0.36%(+0.009)#7,094 |
| 62. | Long Hill | 0.35% | 0.27%(+0.086)#62 | 0.36%(-0.003)#7,194 |
| 63. | Putnam | 0.31% | 0.27%(+0.037)#63 | 0.36%(-0.052)#7,608 |
| 64. | Collinsville | 0.27% | 0.27%(-0.002)#64 | 0.36%(-0.091)#8,041 |
| 65. | Danbury | 0.26% | 0.27%(-0.005)#65 | 0.36%(-0.094)#8,090 |
| 66. | Essex Village | 0.26% | 0.27%(-0.012)#66 | 0.36%(-0.100)#8,170 |
| 67. | Middletown | 0.25% | 0.27%(-0.017)#67 | 0.36%(-0.106)#8,226 |
| 68. | Woodmont Borough | 0.25% | 0.27%(-0.021)#68 | 0.36%(-0.110)#8,278 |
| 69. | Norwalk | 0.24% | 0.27%(-0.028)#69 | 0.36%(-0.117)#8,375 |
| 70. | Stamford | 0.23% | 0.27%(-0.038)#70 | 0.36%(-0.127)#8,518 |
| 71. | Byram | 0.23% | 0.27%(-0.041)#71 | 0.36%(-0.130)#8,558 |
| 72. | Northford | 0.23% | 0.27%(-0.042)#72 | 0.36%(-0.131)#8,569 |
| 73. | New London | 0.22% | 0.27%(-0.044)#73 | 0.36%(-0.133)#8,585 |
| 74. | Orange | 0.21% | 0.27%(-0.058)#74 | 0.36%(-0.146)#8,751 |
| 75. | Manchester | 0.21% | 0.27%(-0.060)#75 | 0.36%(-0.149)#8,789 |
| 76. | Glastonbury Center | 0.19% | 0.27%(-0.080)#76 | 0.36%(-0.169)#9,047 |
| 77. | North Haven | 0.18% | 0.27%(-0.086)#77 | 0.36%(-0.175)#9,116 |
| 78. | Noroton | 0.18% | 0.27%(-0.090)#78 | 0.36%(-0.179)#9,160 |
| 79. | Naugatuck Borough | 0.18% | 0.27%(-0.091)#79 | 0.36%(-0.180)#9,184 |
| 80. | Riverside | 0.18% | 0.27%(-0.092)#80 | 0.36%(-0.181)#9,202 |
| 81. | Milford City Balance | 0.18% | 0.27%(-0.093)#81 | 0.36%(-0.182)#9,204 |
| 82. | New Milford | 0.17% | 0.27%(-0.099)#82 | 0.36%(-0.188)#9,284 |
| 83. | Daniels Farm | 0.16% | 0.27%(-0.104)#83 | 0.36%(-0.192)#9,335 |
| 84. | Sandy Hook | 0.16% | 0.27%(-0.112)#84 | 0.36%(-0.201)#9,454 |
| 85. | East Hartford | 0.15% | 0.27%(-0.117)#85 | 0.36%(-0.206)#9,537 |
| 86. | Bristol | 0.15% | 0.27%(-0.119)#86 | 0.36%(-0.208)#9,566 |
| 87. | Norwich | 0.14% | 0.27%(-0.124)#87 | 0.36%(-0.212)#9,627 |
| 88. | Quinnipiac University | 0.14% | 0.27%(-0.126)#88 | 0.36%(-0.215)#9,661 |
| 89. | Cos Cob | 0.14% | 0.27%(-0.130)#89 | 0.36%(-0.219)#9,704 |
| 90. | Torrington | 0.13% | 0.27%(-0.136)#90 | 0.36%(-0.225)#9,777 |
| 91. | West Haven | 0.13% | 0.27%(-0.136)#91 | 0.36%(-0.225)#9,788 |
| 92. | Stafford Springs | 0.12% | 0.27%(-0.146)#92 | 0.36%(-0.235)#9,911 |
| 93. | Bridgeport | 0.11% | 0.27%(-0.162)#93 | 0.36%(-0.251)#10,149 |
| 94. | Ansonia | 0.11% | 0.27%(-0.163)#94 | 0.36%(-0.252)#10,162 |
| 95. | Windsor Locks | 0.088% | 0.27%(-0.181)#95 | 0.36%(-0.270)#10,421 |
| 96. | Wethersfield | 0.085% | 0.27%(-0.184)#96 | 0.36%(-0.273)#10,457 |
| 97. | Meriden | 0.066% | 0.27%(-0.202)#97 | 0.36%(-0.291)#10,654 |
| 98. | Simsbury Center | 0.065% | 0.27%(-0.203)#98 | 0.36%(-0.292)#10,658 |
| 99. | Hazardville | 0.065% | 0.27%(-0.203)#99 | 0.36%(-0.292)#10,659 |
| 100. | Storrs | 0.062% | 0.27%(-0.206)#100 | 0.36%(-0.295)#10,682 |
Common Questions
What are the Top 10 Cities with the Highest Percentage of Danish Population in Connecticut?
Top 10 Cities with the Highest Percentage of Danish Population in Connecticut are:
#1
9.46%
#2
2.52%
#3
2.39%
#4
2.06%
#5
1.99%
#6
1.79%
#7
1.39%
#8
1.30%
#9
1.25%
#10
1.09%
What city has the Highest Percentage of Danish Population in Connecticut?
Canaan has the Highest Percentage of Danish Population in Connecticut with 9.46%.
What is the Percentage of Danish Population in the State of Connecticut?
Percentage of Danish Population in Connecticut is 0.27%.
What is the Percentage of Danish Population in the United States?
Percentage of Danish Population in the United States is 0.36%.